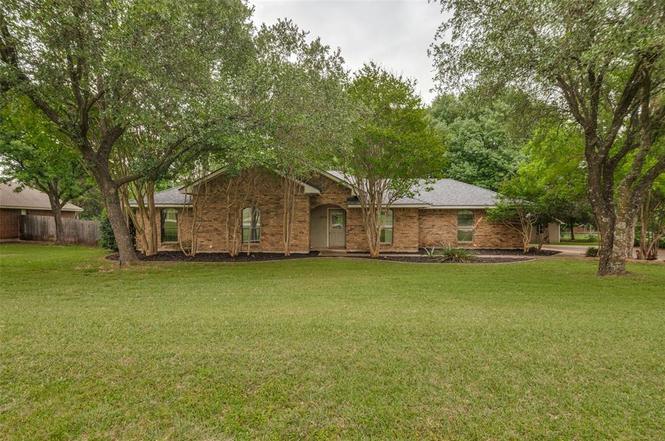
3470 Oak Tree Ln · Midlothian, TX
Flood risk 1/10 · Minimal
- FEMA flood zone
- X (unshaded)
- Chance of flooding over 30 yrs
- 0.0%
- Est. flood insurance / yr
- $507 – $1,088
Fire risk 5/10 · Moderate
- Est. fire insurance / yr
- $1,222 – $2,270
Heat risk 7/10 · Major
- Hot days now (above 109°F)
- 7 days/yr
- Hot days in 30 yrs
- 24 days/yr
Wind risk 6/10 · Moderate
- Chance of severe wind over 30 yrs
- 27.0%
Air-quality risk 2/10 · Minimal
- Unhealthy air days now
- 1 days/yr
- Unhealthy air days in 30 yrs
- 2 days/yr
Risk factors via First Street. Map © Google.
Why this score? — see what drove the D grade
The composite is a weighted blend of 9 inputs, each scored 0–100. Each bar is that input's sub-score; the figure is the points it added to the 100-point composite (weight × sub-score).
- ARV discount +15.0/15.0
- Cash flow +7.8/30.0
- Schools +4.8/10.0
- Rent growth +3.6/5.0
- Livability +3.5/5.0
- 1% rule +2.7/10.0
- Condition / age +2.5/5.0
- DSCR +1.9/10.0
- Appreciation +0.0/10.0
$405,000
🖨 Deal sheet (PDF) 📄 Offer letter ✓ Due diligence
Listing remarks
PRICE IMPROVEMENT!!!! BRING US AN OFFER!!!Tucked away on a beautifully treed one-acre lot, this inviting 3-bedroom, 2-bath home offers the perfect blend of privacy and neighborhood charm. Surrounded by mature trees, the property provides a peaceful setting while still being part of a community that features scenic walking paths and a stocked lake ideal for fishing and relaxing afternoons outdoors. Inside, the home boasts an updated kitchen complete with granite countertops, offering both style and functionality for everyday living or entertaining. The living room with tiled floors is a true open concept area, so the entire family is involved in all activities. The flexible garage space has
Key facts
- One acre lot
- Scenic walking paths
- Updated kitchen
Tags
Property features AI
Finance
- Other: Community features include fishing and jogging/bike paths
- Financial info: Listing accepts Cash, Conventional, FHA, Texas Vet, and VA loans
- HOA & community: Mandatory HOA (Lake Grove HOA); Annual association fee; Association fee covers full use of facilities, grounds maintenance, and management fees
Exterior
- Parking: Driveway; Converted garage; Additional parking; Garage faces side (no listed garage spaces or covered/carport spaces)
- Utilities: Co-op water; Septic
- Home design: Single-family residence; One story; Accessory unit attached
- Construction: Brick construction; Composition roof; Slab foundation; Built in 1987; Preowned
- Exterior features: Large backyard with grass; Many trees; Interior lot; Subdivision setting; Storage; Utilities easement
Interior
- Kitchen: Dishwasher; Disposal; Electric cooktop; Electric oven; Microwave
- Bedrooms: 3 bedrooms (all on the main level); Primary bedroom on the main level
- Flooring: Carpet; Ceramic tile; Laminate
- Bathrooms: 2 full bathrooms
- Heating & cooling: Central heating (electric); Central air conditioning (electric)
- Interior features: Open floorplan; Eat-in kitchen; Granite counters; Cable TV available; High-speed internet available; Walk-in closet(s); Two living areas; One dining area; Storage
- Laundry & utility: Full-size washer/dryer area; 120 sq ft accessory unit
Neighborhood map
What this means for you Summary
Snapshot
- This is a 3-bed/2.0-bath single-family listed at $405k.
Deal economics
- At list price, monthly cash flow is $-455 ($-5k/yr) — negative.
- To cash-flow at today's rent, offer at most $325k (19.8% below list).
- To meet the 1% rule (rent ≥ 1% of price), the offer needs to be $314k (22.6% below list).
- Recommended offer: $314k (22.6% below list) — sets the bar for 1% rule.
- Cap rate 4.9% vs local median 3.5% in Midlothian — top-decile yield for the area; either an underpriced asset or a hidden risk that comps aren't pricing in. Stress-test before assuming the spread holds.
Location & tenants
- Location reads 70/100 on livability (#371 in TX) — a middle-class / working-renter tenant base. Strengths: crime A+, employment A+, housing A+; Watch: amenities F, commute F, health & safety F.
- Midlothian ISD (suburban): math 53% / reading 52% proficiency, ranked #94 of 826 in TX (top 11%) — acceptable for families but not a draw, mixed tenant base, ~2y average lease.
- Zoned schools: Jean Coleman El (503 students, 22% FRL); Frank Seale Middle (math 42% / reading 41%, grade F, #595 of 1,662 statewide, top 37%, 671 students, 55% FRL); Midlothian H S (math 48% / reading 55%, grade D+, #478 of 1,632 statewide, top 29%, 1,994 students, 29% FRL).
- Market conditions: Rents rising fast (+4.3%/yr); 1135 active listings in the ZIP; 4 comparable units currently listed for rent nearby; rentals leasing fast (median 9d on market — plan ~1-2 weeks tenant-placement turnaround); high-income renter base; 3,016 units permitted in Ellis County in 2024 (20 in 5+ unit buildings).
Forward outlook
- Local home prices are declining (-3.0%/yr); year-one equity from $3k of loan paydown is wiped out by about $12k of value loss. Plan a longer hold.
- Ellis County population projected at +36% by 2050 — long-run rental-demand tailwind backs the buy-and-hold thesis.
Negotiation context
- It's been on market 46 days — a 3% lower offer ($393k) is reasonable based on typical stale-listing flexibility.
- 3 sale attempts since 6y ago with the ask held roughly flat each time — persistent listings suggest the price (not the market) is what's stuck; bring a comps-based counter.
Risks & watch-outs
- Climate carrying-cost: major wind risk, 27% chance of damaging wind over 30y; moderate wildfire risk; extreme-heat days projected 7→24/yr by 2055 (HVAC capex compounding) — expect insurance premiums to compound above CPI over the hold.
Questions for the listing agent
- What do current leases actually rent for vs. the listed asking? Can we see a recent rent roll and the last 12 months of T-12 income?
- It's been on market 46 days. Have you received any prior offers? Is the seller open to a 23% concession, seller financing, or rate buy-down credit?
- What does the HOA fee cover, when was the last increase, and are there any pending special assessments or reserve-fund shortfalls?
- Is there a deadline driving the sale (1031 exchange, divorce, estate, relocation)? That informs how much negotiation room exists.
- Schools are B-rated — typically a magnet for longer-tenancy family renters. What's the average tenant stay here, and is there a school-zone premium baked into asking?
- The area grade is low — what's the realistic commute time and amenity access for the typical tenant pool here? Any planned neighborhood developments (good or bad) we should know about?
- What's the average days-on-market for RENTAL listings here right now (not sales)? A rising rental-DOM trend means longer vacancies and softer asking-rent achievability than the comps imply.
- What's the recent tenant-quality profile in this submarket — average credit score on applications, eviction rate, late-payment / NSF rate, and stable-employment percentage? A property-management company in the area should have these aggregated.
- How much new for-sale + rental construction is in the pipeline within 1–3 miles? Heavy new supply typically softens prices + rents 12–24 months out; constrained supply supports both.
Investment metrics
- 1% rule
- 0.77% ✗
- Cap rate
- 4.94%
- Cash-on-cash
- -4.82%
- DSCR
- 0.79
- GRM
- 10.8
CMA / ARV
- ARV (median comp)
- $489,798
- List price
- $405,000
- Delta
- -17.31%
- Verdict
- UNDERPRICED
- Comps
- 20 within 1.0 mi
Show comp detail 12 sales within ~0.75 mi
| Address | Dist | Beds/Ba | Sqft | Sold | Price | $/sf | Match |
|---|---|---|---|---|---|---|---|
| 3470 Oak Tree Ln | 0.00mi | 3/2.0 | 2,182 (0%) | 0mo | $405,000 | $186 | 100 |
| 1411 Honeysuckle Ridge Ct | 0.53mi | 4/2.0 (+1) | 2,291 (+5%) | 1mo | $525,000 | $229 | 61 |
| 1859 Ashford Ln | 0.34mi | 3/2.0 | 1,911 (-12%) | 5mo | $459,900 | $241 | 59 |
| 3606 Brighton Dr | 0.61mi | 3/2.0 | 2,015 (-8%) | 1mo | $399,999 | $199 | 58 |
| 4218 Bel Air Dr | 0.59mi | 4/3.0 (+1) | 2,250 (+3%) | 3mo | $449,000 | $200 | 56 |
| 414 Belmont Dr | 0.71mi | 3/2.0 | 2,233 (+2%) | 11mo | $420,000 | $188 | 54 |
| 4410 Bel Air Dr | 0.68mi | 4/2.0 (+1) | 2,241 (+3%) | 6mo | $498,000 | $222 | 54 |
| 1811 Ashford Ln | 0.59mi | 4/2.0 (+1) | 2,085 (-4%) | 11mo | $599,900 | $288 | 51 |
| 430 Hillstone Dr | 0.72mi | 4/2.0 (+1) | 2,277 (+4%) | 5mo | $410,000 | $180 | 50 |
| 3420 Sudith Ln | 0.59mi | 3/2.5 | 2,469 (+13%) | 2mo | $539,900 | $219 | 47 |
| 2850 Oak Tree Ln | 0.49mi | 4/3.0 (+1) | 2,480 (+14%) | 0mo | $539,999 | $218 | 45 |
| 837 Rusty Run Dr | 0.70mi | 4/3.0 (+1) | 2,462 (+13%) | 11mo | $506,990 | $206 | 28 |
Match score weights: distance 35% · size 25% · config 20% · recency 20%. Top-matched comps best support the ARV.
Projected returns pro-forma
-3.0% appreciation · 4.32% rent growth · sell at horizon
- IRR
- -22.9%
- Equity multiple
- 0.20×
- Total profit
- $-90,262
- Equity at exit
- $60,387
- IRR
- -14.1%
- Equity multiple
- 0.14×
- Total profit
- $-97,611
- Equity at exit
- $35,017
Cash invested: $113,400 (down + closing). Projections, not guarantees.
Landlord ↔ Tenant lean methodology
- Overall (STATE)
- 87 Strongly Landlord-Friendly
- State Texas
- 87 Strongly Landlord-Friendly · R+5
- County
- — inherits STATE
- City
- — inherits STATE
ZIP-level market 76065
- Home prices YoY
- -18.9%
- Rents YoY
- 4.3%
- Active inventory
- 1135
- Price-to-rent
- 10.8×
Monthly cashflow live
- Estimated rent
- $3,135 medium interval (Pro) →
- Mortgage (P&I)
- −$2,124
- Tax from tax record
- −$622 /mo · $7,468/yr
- Insurance
- −$169
- HOA
- −$17
- Vacancy / Maint / Mgmt
- −$658
- Net cashflow
- $-455
Break-even live
Sensitivity live
| Price | -10% $-226 | -5% $-340 | +0% $-455 | +5% $-570 | +10% $-684 |
|---|---|---|---|---|---|
| Rent | -10% $-703 | -5% $-579 | +0% $-455 | +5% $-331 | +10% $-207 |
| Rate | -1.0pp $-251 | -0.5pp $-352 | base $-455 | +0.5pp $-560 | +1.0pp $-667 |
UW: 25.0% down · 7.5% · 30yr · 1.5% tax · 5.0% vac · 8.0% maint · 8.0% mgmt
Financing live
Cash to close
- Down payment
- $101,250
- Closing costs
- $12,150
- Reserves months
- —
- Total cash needed
- —
Loan-product check · same deal, 3 products live
Conventional
25% down · 7.5% · 30yr
- Down + closing
- —
- Monthly P&I
- —
- Monthly cashflow
- —
- DSCR
- —
- Eligible?
- —
Personal DTI + credit; lowest rate.
DSCR
20% down · 8.5% · 30yr
- Down + closing
- —
- Monthly P&I
- —
- Monthly cashflow
- —
- DSCR
- —
- Eligible?
- —
No personal income docs; deal must DSCR.
Hard money
10% down · 12.0% · 12mo
- Down + closing
- —
- Monthly P&I
- —
- Monthly cashflow
- —
- DSCR
- —
- Eligible?
- —
Short-term bridge; refi at stabilization.
Rent comps 4 comps
| Address | Beds | Baths | Sqft | Rent | $/sqft | DOM | Units | Dist |
|---|---|---|---|---|---|---|---|---|
| 254 Ashlawn Dr Midlothian, TX | 4.0 | 2.5 | 2821 | $3,500 | $1.24 | 9d | 1 | 0.88mi |
| 2618 Fawn Valley Ave Midlothian, TX | 4.0 | 2.5 | 2892 | $3,555 | $1.23 | 26d | 1 | 1.07mi |
| 2617 Grouse Hollow Way Midlothian, TX | 4.0 | 3.0 | 2211 | $3,300 | $1.49 | 9d | 1 | 1.22mi |
| 4822 Windfern Way Midlothian, TX | 4.0 | 2.0 | 2016 | $3,150 | $1.56 | 0d | 1 | 1.46mi |
HOA detail
- Monthly dues
- $17 · $204/yr
Listing history 21 events
-
2026-06-15statusdays on market $405,000 Pending 46 DOM
-
2026-06-13days on market $405,000 Active Kick-Out 45 DOM
-
2026-06-09days on market $405,000 Active Kick-Out 41 DOM
-
2026-06-08days on market $405,000 Active Kick-Out 40 DOM
-
2026-06-07days on market $405,000 Active Kick-Out 39 DOM
-
2026-06-04days on market $405,000 Active Kick-Out 36 DOM
-
2026-06-03days on market $405,000 Active Kick-Out 35 DOM
-
2026-06-02days on market $405,000 Active Kick-Out 34 DOM
-
2026-06-01days on market $405,000 Active Kick-Out 33 DOM
-
2026-05-31days on market $405,000 Active Kick-Out 32 DOM
-
2026-05-10price $405,000 1113-char remark
-
2026-04-29$415,000 Active 1113-char remark
-
2026-02-23historical
-
2025-11-10price $427,000
-
2025-08-23$435,000 Active
-
2020-11-03historical
-
2020-10-13price $349,900
-
2020-10-09$360,000 Active
-
2016-02-11soldstatus
-
1996-12-23soldstatus
-
1987-07-10soldstatus
ⓘ Source: listings_history table (triggers on properties + properties_extension) + one-shot
backfill from property_details.listing_events for pre-trigger history.
Tax reassessment forecast TX · Resets to sale price
- Current annual tax
- $7,468 · $622/mo
- Projected year-2 tax
- $7,468 · $622/mo
- Expected delta
- $0/yr ($0/mo · 0.0%)
ⓘ Screening estimate from a state-policy table — verify with the county assessor before closing.
Climate risk First Street
- Flood 1/10 Low FEMA zone X (unshaded) · 0% chance over 30 yrs
- Wildfire 5/10 Major
- Heat 7/10 Severe 7 d/yr ≥109°F today · 24 d/yr by 30 yrs out
- Wind 6/10 Major 27% chance of damaging wind over 30 yrs
- Air quality 2/10 Low 1 unhealthy d/yr today · 2 by 30 yrs out
Nearby sold comps map
Loading sold comps map…
Walkable amenities ~0.75 mi
Loading nearby amenities…
Taxation est. · year 1
- Rental income
- $37,623
- − Mortgage interest
- −$22,686
- − Property taxes
- −$7,468
- − Insurance
- −$2,025
- − Repairs & maintenance
- −$3,010
- − Management
- −$3,010
- − HOA
- −$204
- − Depreciation
- −$11,782
- Taxable loss
- −$12,561
- Est. tax savings @ 24.0%
- +$3,015
- After-tax cash flow
- $-2,446/yr
For passive investors: Depreciation is non-cash, so a rental often shows a tax loss while cash-flowing — sheltering income. Rental losses are passive: they offset passive income freely, and up to $25,000/yr can offset ordinary (W-2) income if you actively participate and your MAGI is under $100k (phasing out to $0 by $150k); unused losses carry forward. On sale, claimed depreciation is recaptured at up to 25%, and gains may owe capital-gains tax (a 1031 exchange can defer both). Figures are a year-1 estimate at your 24.0% rate — not tax advice; consult a CPA.
Schools (NCES district)
- District
- Midlothian ISD
- NCES district ID
- 4830600
- Math proficiency
- 53% ▼ -7.00%
- Reading proficiency
- 52% ▼ -1.00%
- Median HH income
- $85,068
- Composite
- 48.22/100
- National rank
- #2165
- State rank
- #94 of 826 in TX
Livability — Midlothian
- Score
- 70/100
- State rank
- #371
- US rank
- #7851
Category grades
Schools grade is shown separately in the Schools card above.
Census & demographics
- Census place
- Midlothian, TX
- County
- Ellis County · 199,237 people
- City population
- 47,438
- Metro
- Dallas-Fort Worth-Arlington, TX
- Population (ZIP)
- 47,438
- Household income
- $127,756
- Rent vs Own
- Severe rent burden
- 811.0
Population outlook (Ellis County) Hauer SSP2
- Today (2025)
- 194,556 people
- By 2030
- 209,679 · +7.8%
- By 2040
- 238,837 · +22.8%
- By 2050
- 265,451 · +36.4%
- By 2075
- 326,571 · +67.9%
- By 2100
- 362,156 · +86.1%
Race, ethnicity, and origin ACS 2023
- Neighborhood character
- Predominantly White (65%)
- Race & ethnicity
- White 65% Hispanic / Latino 20% Two or more races 13% Black 11%
- Hispanic origin (detail)
- Mexican 15%
- Common ancestry
- Lithuanian 2% Italian 2% Romanian 1%
- Foreign-born
- 5% · Canada
- Languages at home
- 88% English-only · Spanish 10% Other Indo-European 1%
Political lean MEDSL · Ellis
- 2024 margin
- Solid R (+31.1) · D 34.0% · R 65.1%
- 2008→2024 swing
- +11.2pp toward D · 2008: -42.2pp · 2024: -31.1pp
- All cycles
- 2024: R+31.1 2020: R+34.1 2016: R+45.4 2012: R+47.5 2008: R+42.2
Not yet ingested
- Civics
- —
Market trends
- HPI YoY
- ▼ -56.85%
- Current HPI
- 243.5953
- Rent YoY
- ▲ 4.32%
- Metro
- Dallas-Fort Worth-Arlington, TX
- State GDP YoY
- ▲ 3.95%
- F500 in state
- 110
Industry mix (Fortune 500 HQ in TX)
| Industry | F500 HQs | Revenue |
|---|---|---|
| Energy | 16 | $1,198B |
|
||
| Technology | 5 | $198B |
|
||
| Engineering / Construction | 4 | $72B |
|
||
| Energy Services | 3 | $60B |
|
||
| Utilities | 3 | $41B |
|
||
| Healthcare | 2 | $330B |
|
||
Price history
+12.5% since first listed14 events — show timeline
- 2026-06-15 Pending — NTREIS
- 2026-06-10 Sold (MLS) — NTREIS
- 2026-05-21 Contingent — NTREIS
- 2026-05-10 Price Changed $405,000 NTREIS
- 2026-04-29 Listed $415,000 NTREIS
- 2026-02-23 Listing Removed — NTREIS
- 2025-11-10 Price Changed $427,000 NTREIS
- 2025-08-23 Listed $435,000 NTREIS
- 2020-11-03 Listing Removed — NTREIS
- 2020-10-13 Price Changed $349,900 NTREIS
- 2020-10-09 Listed $360,000 NTREIS
- 2016-02-11 Sold (Public Records) — Public Records
- 1996-12-23 Sold (Public Records) — Public Records
- 1987-07-10 Sold (Public Records) — Public Records
Property tax history
+6.2%/yrLatest (2025): $7,468 · +4.8% YoY. Source: county tax records.
Cash-flow waterfall
monthlySold comps — $/sqft
last 12 mo · ≤1 miLoading sold comps…