3907 Longbranch Dr · Crandall, TX
Flood risk No data
- FEMA flood zone
- —
- Chance of flooding over 30 yrs
- —
- Est. flood insurance / yr
- —
Fire risk No data
- Est. fire insurance / yr
- —
Heat risk No data
- Hot days now (above threshold)
- —
- Hot days in 30 yrs
- —
Wind risk No data
- Chance of severe wind over 30 yrs
- —
Air-quality risk No data
- Unhealthy air days now
- —
- Unhealthy air days in 30 yrs
- —
Risk factors via First Street. Map © Google.
Why this score? — see what drove the D grade
The composite is a weighted blend of 9 inputs, each scored 0–100. Each bar is that input's sub-score; the figure is the points it added to the 100-point composite (weight × sub-score).
- Cash flow +13.9/30.0
- ARV discount +7.2/15.0
- 1% rule +4.2/10.0
- DSCR +4.2/10.0
- Condition / age +4.0/5.0
- Schools +3.6/10.0
- Livability +3.4/5.0
- Rent growth +2.5/5.0
- Appreciation +0.0/10.0
$262,499
🖨 Deal sheet (PDF) 📄 Offer letter ✓ Due diligence
Listing remarks
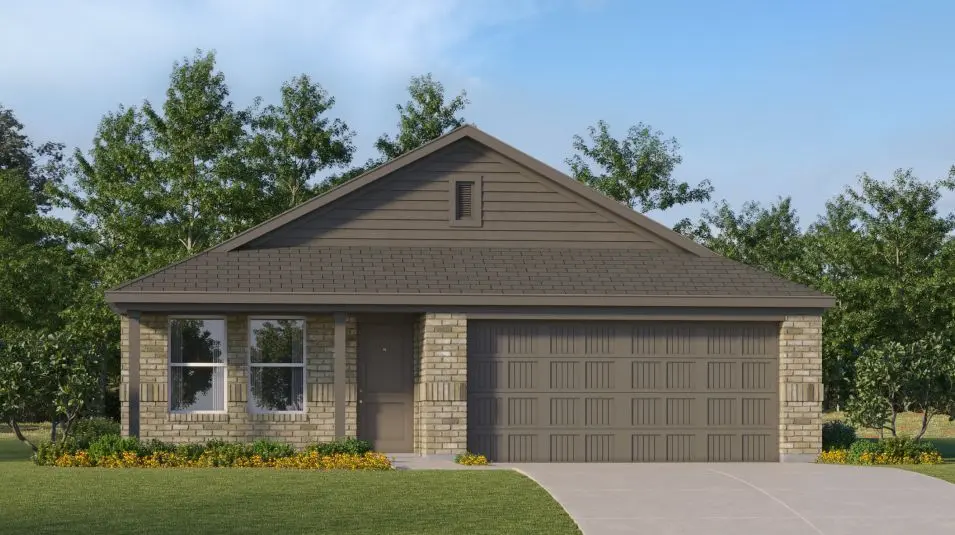
LENNAR - Cartwright Ranch -Oxford Floorplan - This new single-story design makes smart use of the space available. At the front are all three secondary bedrooms arranged near a convenient full-sized bathroom. Down the foyer is a modern layout connecting a peninsula-style kitchen made for inspired meals, an intimate dining area and a family room ideal for gatherings. Tucked in a quiet corner is the owner’s suite with an attached bathroom and walk-in closet. Prices and features may vary and are subject to change. Photos are for illustrative purposes only.
Key facts
- Walk-in closet
- Single-story design
- Owner's suite
Tags
Property features AI
Finance
- Financial info: List price $274,499
Exterior
- Parking: 2 total parking spaces; 2-car garage
- Home design: Single-family home (new construction, Spec); Oxford floor plan
- Exterior features: Address: 3907 Longbranch Dr, Crandall, TX 75114
Interior
- Bedrooms: 4 bedrooms
- Bathrooms: 2 full bathrooms
- Interior features: Spec home — Oxford plan; Living area approximately 1,760
Neighborhood map
What this means for you Summary
Snapshot
- This is a 4-bed/2.0-bath single-family listed at $262k. Condition is rated good.
Deal economics
- At list price, monthly cash flow is $27 ($320/yr) — positive.
- The deal already cash-flows at list — no discount required.
- To meet the 1% rule (rent ≥ 1% of price), the offer needs to be $241k (8.2% below list).
- Recommended offer: $241k (8.2% below list) — sets the bar for 1% rule.
- Cap rate 6.4% vs local median 5.3% in Crandall — meaningfully above typical; check what's discounted (condition, days-on-market, listing class) to confirm the premium yield is real.
Location & tenants
- Location reads 68/100 on livability (#507 in TX) — a middle-class / working-renter tenant base. Strengths: employment A+, cost of living A+, housing A+; Watch: crime F, amenities F, commute F.
- Crandall ISD (rural): math 36% / reading 42% proficiency, ranked #351 of 826 in TX (top 42%) — families likely to look elsewhere, expect single-tenant / working-renter base with shorter leases.
- Zoned schools: Nola Kathryn Wilson El (math 40% / reading 45%, grade F, #1,313 of 4,322 statewide, top 31%, 596 students, 59% FRL); Crandall Middle (math 38% / reading 42%, grade F, #646 of 1,662 statewide, top 40%, 983 students, 60% FRL); Crandall H S (math 33% / reading 53%, grade F, #713 of 1,632 statewide, top 44%, 1,707 students, 56% FRL) — zoned schools average 58% FRL vs 41% district-wide (17 pts higher); higher-poverty schools than district average — tighter screening recommended.
- Market conditions: 802 active listings in the ZIP; 6 comparable units currently listed for rent nearby; rentals at typical pace (median 27d on market — plan ~3-4 weeks tenant-placement turnaround); solid renter incomes; 1,747 units permitted in Kaufman County in 2024 (180 in 5+ unit buildings).
- This rent runs 33% of the median local income ($88k/yr) — at the standard rent-burdened threshold; future hikes will face affordability resistance.
Forward outlook
- Local home prices are declining (-3.0%/yr); year-one equity from $2k of loan paydown is wiped out by about $8k of value loss. Plan a longer hold.
- Kaufman County population projected at +43% by 2050 — long-run rental-demand tailwind backs the buy-and-hold thesis.
Negotiation context
- Only 13 days on market — expect competitive offers; lowballing is unlikely to land.
Questions for the listing agent
- What does the HOA fee cover, when was the last increase, and are there any pending special assessments or reserve-fund shortfalls?
- Is there a deadline driving the sale (1031 exchange, divorce, estate, relocation)? That informs how much negotiation room exists.
- Schools are B-rated — typically a magnet for longer-tenancy family renters. What's the average tenant stay here, and is there a school-zone premium baked into asking?
- Crime grade is F in this area — have there been break-ins, vandalism, or insurance claims at this property in the last 3 years? What carrier currently insures it and at what premium?
- The area grade is low — what's the realistic commute time and amenity access for the typical tenant pool here? Any planned neighborhood developments (good or bad) we should know about?
- What's the average days-on-market for RENTAL listings here right now (not sales)? A rising rental-DOM trend means longer vacancies and softer asking-rent achievability than the comps imply.
- What's the recent tenant-quality profile in this submarket — average credit score on applications, eviction rate, late-payment / NSF rate, and stable-employment percentage? A property-management company in the area should have these aggregated.
- How much new for-sale + rental construction is in the pipeline within 1–3 miles? Heavy new supply typically softens prices + rents 12–24 months out; constrained supply supports both.
Investment metrics
- 1% rule
- 0.92% ✗
- Cap rate
- 6.41%
- Cash-on-cash
- 0.44%
- DSCR
- 1.02
- GRM
- 9.1
CMA / ARV
- ARV (on-the-fly)
- $260,480
- Comps found
- 12
Show comp detail 12 sales within ~0.75 mi
| Address | Dist | Beds/Ba | Sqft | Sold | Price | $/sf | Match |
|---|---|---|---|---|---|---|---|
| 3175 Maplehurst Ave | 0.04mi | 4/2.0 | 1,760 (0%) | 0mo | $251,499 | $143 | 98 |
| 3165 Maplehurst Ave | 0.06mi | 4/2.0 | 1,760 (0%) | 1mo | $260,999 | $148 | 97 |
| 3145 Maplehurst Ave | 0.11mi | 4/2.0 | 1,760 (0%) | 2mo | $237,599 | $135 | 94 |
| 3141 Maplehurst Ave | 0.11mi | 4/2.0 | 1,720 (-2%) | 2mo | $243,499 | $142 | 89 |
| 3134 Maplehurst Ave | 0.14mi | 4/2.0 | 1,720 (-2%) | 2mo | $234,499 | $136 | 88 |
| 3169 Maplehurst Ave | 0.05mi | 3/2.0 (-1) | 1,522 (-14%) | 1mo | $223,000 | $147 | 69 |
| 3138 Maplehurst Ave | 0.12mi | 3/2.0 (-1) | 1,522 (-14%) | 2mo | $225,499 | $148 | 65 |
| 1318 Olivewood Pl | 0.27mi | 3/2.5 (-1) | 1,931 (+10%) | 1mo | $279,990 | $145 | 63 |
| 3122 Maplehurst Ave | 0.16mi | 3/2.0 (-1) | 1,522 (-14%) | 2mo | $225,649 | $148 | 63 |
| 1314 Olivewood Pl | 0.28mi | 3/2.0 (-1) | 1,558 (-12%) | 1mo | $273,990 | $176 | 62 |
| 1427 Canongate Dr | 0.43mi | 3/2.0 (-1) | 1,604 (-9%) | 3mo | $256,490 | $160 | 58 |
| 1256 Barkridge St | 0.46mi | 3/2.0 (-1) | 1,604 (-9%) | 3mo | $256,490 | $160 | 56 |
Match score weights: distance 35% · size 25% · config 20% · recency 20%. Top-matched comps best support the ARV.
Projected returns pro-forma
-3.0% appreciation · 3.0% rent growth · sell at horizon
- IRR
- -15.6%
- Equity multiple
- 0.45×
- Total profit
- $-40,763
- Equity at exit
- $39,139
- IRR
- -7.0%
- Equity multiple
- 0.55×
- Total profit
- $-33,004
- Equity at exit
- $22,696
Cash invested: $73,500 (down + closing). Projections, not guarantees.
Landlord ↔ Tenant lean methodology
- Overall (STATE)
- 87 Strongly Landlord-Friendly
- State Texas
- 87 Strongly Landlord-Friendly · R+5
- County
- — inherits STATE
- City
- — inherits STATE
ZIP-level market 75114
- Home prices YoY
- -26.7%
- Active inventory
- 802
- Price-to-rent
- 9.1×
Monthly cashflow live
- Estimated rent
- $2,410 high interval (Pro) →
- Mortgage (P&I)
- −$1,377
- Tax est. 1.5%
- −$328 /mo · $3,937/yr
- Insurance
- −$109
- HOA
- −$63
- Vacancy / Maint / Mgmt
- −$506
- Net cashflow
- $27
Break-even live
Sensitivity live
| Price | -10% $208 | -5% $117 | +0% $27 | +5% $-64 | +10% $-155 |
|---|---|---|---|---|---|
| Rent | -10% $-164 | -5% $-69 | +0% $27 | +5% $122 | +10% $217 |
| Rate | -1.0pp $159 | -0.5pp $93 | base $27 | +0.5pp $-41 | +1.0pp $-111 |
UW: 25.0% down · 7.5% · 30yr · 1.5% tax · 5.0% vac · 8.0% maint · 8.0% mgmt
Financing live
Cash to close
- Down payment
- $65,625
- Closing costs
- $7,875
- Reserves months
- —
- Total cash needed
- —
Loan-product check · same deal, 3 products live
Conventional
25% down · 7.5% · 30yr
- Down + closing
- —
- Monthly P&I
- —
- Monthly cashflow
- —
- DSCR
- —
- Eligible?
- —
Personal DTI + credit; lowest rate.
DSCR
20% down · 8.5% · 30yr
- Down + closing
- —
- Monthly P&I
- —
- Monthly cashflow
- —
- DSCR
- —
- Eligible?
- —
No personal income docs; deal must DSCR.
Hard money
10% down · 12.0% · 12mo
- Down + closing
- —
- Monthly P&I
- —
- Monthly cashflow
- —
- DSCR
- —
- Eligible?
- —
Short-term bridge; refi at stabilization.
Rent comps 6 comps
| Address | Beds | Baths | Sqft | Rent | $/sqft | DOM | Units | Dist |
|---|---|---|---|---|---|---|---|---|
| 1322 Olivewood Pl Crandall, TX | 3.0 | 2.0 | 1458 | $2,100 | $1.44 | 9d | 1 | 0.24mi |
| 1322 Olivewood Pl Crandall, TX | 3.0 | 2.0 | 1458 | $2,100 | $1.44 | 1d | 1 | 0.24mi |
| 2307 Albert Ln Crandall, TX | 4.0 | 3.0 | 2088 | $2,500 | $1.20 | 26d | 1 | 0.46mi |
| 505 S 5th St Crandall, TX | 3.0 | 2.0 | 1360 | $1,900 | $1.40 | 45d | 1 | 1.20mi |
| 2109 Muscovy St Crandall, TX | 4.0 | 3.0 | 2300 | $2,200 | $0.96 | 26d | 1 | 1.29mi |
| 2043 Serval Ln Crandall, TX | 3.0 | 2.0 | 1544 | $2,100 | $1.36 | 45d | 1 | 1.49mi |
HOA detail
- Monthly dues
- $63 · $756/yr
Listing history 14 events
-
2026-06-21days on market $262,499 Active 13 DOM
-
2026-06-18days on market $262,499 Active 10 DOM
-
2026-06-17days on market $262,499 Active 9 DOM
-
2026-06-16days on market $262,499 Active 8 DOM
-
2026-06-15days on market $262,499 Active 7 DOM
-
2026-06-13days on market $262,499 Active 5 DOM
-
2026-06-08remarks 559-char remark
-
2026-06-08days on market $262,499 Active 1 DOM
-
2026-06-07days on market $262,499 Active 10 DOM
-
2026-06-04days on market $262,499 Active 7 DOM
-
2026-06-03days on market $262,499 Active 6 DOM
-
2026-06-02days on market $262,499 Active 5 DOM
-
2026-06-01days on market $262,499 Active 4 DOM
-
2026-05-31days on market $262,499 Active 3 DOM
ⓘ Source: listings_history table (triggers on properties + properties_extension) + one-shot
backfill from property_details.listing_events for pre-trigger history.
Nearby sold comps map
Loading sold comps map…
Walkable amenities ~0.75 mi
Loading nearby amenities…
Taxation est. · year 1
- Rental income
- $28,917
- − Mortgage interest
- −$14,704
- − Property taxes
- −$3,937
- − Insurance
- −$1,312
- − Repairs & maintenance
- −$2,313
- − Management
- −$2,313
- − HOA
- −$756
- − Depreciation
- −$7,636
- Taxable loss
- −$4,056
- Est. tax savings @ 24.0%
- +$973
- After-tax cash flow
- $1,293/yr
For passive investors: Depreciation is non-cash, so a rental often shows a tax loss while cash-flowing — sheltering income. Rental losses are passive: they offset passive income freely, and up to $25,000/yr can offset ordinary (W-2) income if you actively participate and your MAGI is under $100k (phasing out to $0 by $150k); unused losses carry forward. On sale, claimed depreciation is recaptured at up to 25%, and gains may owe capital-gains tax (a 1031 exchange can defer both). Figures are a year-1 estimate at your 24.0% rate — not tax advice; consult a CPA.
Condition & rehab AI · 1 photo
This single-story home is in excellent condition with no visible repairs needed. It offers a good investment opportunity with potential for minor updates to enhance its resale and rental value.
Value-add opportunities
- Both Painting exterior and interior — Enhances curb appeal and interior aesthetics
- Both Landscaping improvements — Enhances curb appeal and adds value
- Both New flooring in bathrooms and kitchen — Improves functionality and aesthetics
- Both New lighting fixtures — Enhances interior aesthetics and energy efficiency
Renovation cost estimate screening
Value-add ROI direction
- Both Painting exterior and interior — Enhances curb appeal and interior aesthetics ↑
- Both Landscaping improvements — Enhances curb appeal and adds value ↑
- Both New flooring in bathrooms and kitchen — Improves functionality and aesthetics ↑
- Both New lighting fixtures — Enhances interior aesthetics and energy efficiency ↑
ⓘ Cost ranges are severity-bucket heuristics (US national rule-of-thumb). Get contractor quotes + a written scope before underwriting a rehab budget.
Schools (NCES district)
- District
- Crandall ISD
- NCES district ID
- 4815510
- Math proficiency
- 36% ▼ -13.00%
- Reading proficiency
- 42% ▼ -8.00%
- Median HH income
- $70,076
- Composite
- 35.57/100
- National rank
- #4901
- State rank
- #351 of 826 in TX
Livability — Crandall
- Score
- 68/100
- State rank
- #507
- US rank
- #10022
Category grades
Schools grade is shown separately in the Schools card above.
Census & demographics
- Census place
- Crandall, TX
- County
- Kaufman County · 122,338 people
- City population
- 9,333
- Metro
- Dallas-Fort Worth-Arlington, TX
- Population (ZIP)
- 9,333
- Household income
- $88,013
- Rent vs Own
- Severe rent burden
- 33.0
Population outlook (Kaufman County) Hauer SSP2
- Today (2025)
- 138,716 people
- By 2030
- 150,815 · +8.7%
- By 2040
- 174,877 · +26.1%
- By 2050
- 198,020 · +42.8%
- By 2075
- 251,908 · +81.6%
- By 2100
- 285,325 · +105.7%
Race, ethnicity, and origin ACS 2023
- Neighborhood character
- Diverse neighborhood (Simpson 0.62)
- Race & ethnicity
- White 48% Hispanic / Latino 36% Two or more races 14% Black 14%
- Hispanic origin (detail)
- Mexican 34%
- Common ancestry
- Slovak 1%
- Foreign-born
- 18% · Canada, China
- Languages at home
- 71% English-only · Spanish 27% Other Indo-European 1%
Political lean MEDSL · Kaufman
- 2024 margin
- Strong R (+27.9) · D 35.6% · R 63.5%
- 2008→2024 swing
- +7.9pp toward D · 2008: -35.8pp · 2024: -27.9pp
- All cycles
- 2024: R+27.9 2020: R+33.9 2016: R+47.0 2012: R+44.4 2008: R+35.8
Not yet ingested
- Civics
- —
Market trends
- HPI YoY
- ▼ -71.61%
- Current HPI
- 196.4773
- Rent YoY
- —
- Metro
- Dallas-Fort Worth-Arlington, TX
- State GDP YoY
- ▲ 3.95%
- F500 in state
- 110
Industry mix (Fortune 500 HQ in TX)
| Industry | F500 HQs | Revenue |
|---|---|---|
| Energy | 16 | $1,198B |
|
||
| Technology | 5 | $198B |
|
||
| Engineering / Construction | 4 | $72B |
|
||
| Energy Services | 3 | $60B |
|
||
| Utilities | 3 | $41B |
|
||
| Healthcare | 2 | $330B |
|
||
Cash-flow waterfall
monthlySold comps — $/sqft
last 12 mo · ≤1 miLoading sold comps…