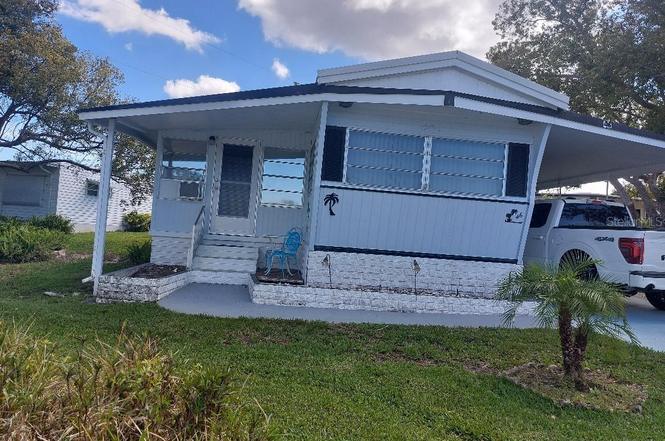
46 Washington Ct #28 · Palm Harbor, FL
Flood risk 6/10 · Moderate
- FEMA flood zone
- X (unshaded)
- Chance of flooding over 30 yrs
- 0.7%
- Est. flood insurance / yr
- $507 – $1,088
Fire risk 2/10 · Minimal
- Est. fire insurance / yr
- $947 – $1,759
Heat risk 10/10 · Severe
- Hot days now (above 108°F)
- 7 days/yr
- Hot days in 30 yrs
- 26 days/yr
Wind risk 10/10 · Severe
- Chance of severe wind over 30 yrs
- 99.0%
Air-quality risk 3/10 · Minor
- Unhealthy air days now
- 2 days/yr
- Unhealthy air days in 30 yrs
- 2 days/yr
Risk factors via First Street. Map © Google.
Why this score? — see what drove the C grade
The composite is a weighted blend of 9 inputs, each scored 0–100. Each bar is that input's sub-score; the figure is the points it added to the 100-point composite (weight × sub-score).
- Cash flow +29.0/30.0
- DSCR +10.0/10.0
- 1% rule +8.2/10.0
- Schools +4.3/10.0
- Livability +4.0/5.0
- Condition / age +2.5/5.0
- Rent growth +1.2/5.0
- ARV discount +0.0/15.0
- Appreciation +0.0/10.0
$139,900
🖨 Deal sheet (PDF) 📄 Offer letter ✓ Due diligence
Listing remarks
Under contract-accepting backup offers. PRICE REDUCED. .. .VERY NICE . .. JUST PROFESSIONALY DECORATED. .SEE NEW PICTURES. .. 2BR/11/2 BATH HOME IN LAKE TARPON VILLAGE . .. CUL-DE-SAC . .. LARGE BEAUTIFULLY LANDSCAPED LOT. .. .HOME SHOWS PRIDE OF OWNERSHIP AT EVERY TURN. .. THIS IS FLORIDA LIVING AT ITS BEST, ,, LOW MAINT $106 MONTHLY. .. ACTIVE 55+ COMMUNITY W/ CLUBHOUSE-HEATED POOL-REC AREA. .AND ACCESS TO BEAUTIFUL LAKE TARPON. ..
Key facts
- Clubhouse
- Rec area
- Cul-de-sac
Tags
Property features AI
Finance
- Other: Buyer approval required for association; Deed restrictions and special community restrictions; Road is privately maintained with a road maintenance agreement
- Financial info: Total annual fees $1,272; Lease restrictions apply
- HOA & community: Has HOA (monthly fee $106); Association name: BETH; Association approval required; HOA covers pool, common area taxes, management, private road, recreational facilities, trash; Community amenities include clubhouse, pool, pickleball and shuffleboard courts, recreation facilities, sidewalks, street lights; Senior community; Pets not allowed
Exterior
- Parking: Driveway; Carport with 1 space
- Security: Fire alarm; Smoke detectors
- Utilities: Public water; Public sewer; Electricity connected; Water connected; Sewer connected; Cable available; Fire hydrant nearby; Sprinkler well
- Home design: Residential mobile home (single wide); Attached property; One story; Faces north; Pillar/Post/Pier foundation
- Construction: Metal siding; Metal roof; Built as single wide mobile home
- Exterior features: Screened patio/porch; Private mailbox; Rain gutters; Sidewalk; Storage; Shed(s)
Interior
- Kitchen: Range; Microwave; Refrigerator; Electric water heater
- Bedrooms: 2 bedrooms
- Flooring: Carpet; Ceramic tile; Laminate
- Bathrooms: 1 full bathroom; 1 half bathroom
- Heating & cooling: Central heating (electric); Central air conditioning
- Interior features: Ceiling fans; Thermostat; Window treatments; Blinds; Exhaust fan; Fire alarm; Smoke detectors
- Laundry & utility: Washer; Dryer; Laundry room
Neighborhood map
What this means for you Summary
Snapshot
- This is a 2-bed/1.5-bath manufactured listed at $140k.
Deal economics
- At list price, monthly cash flow is $478 ($6k/yr) — positive.
- The deal already cash-flows at list — no discount required.
- Meets the 1% rule at list price ($2k rent vs $140k).
- Recommended offer: $123k (12.0% below list) — sets the bar for market timing.
- Cap rate 10.4% vs local median 3.1% in Palm Harbor — top-decile yield for the area; either an underpriced asset or a hidden risk that comps aren't pricing in. Stress-test before assuming the spread holds.
Location & tenants
- Location reads 81/100 on livability (#95 in FL, #1,470 nationally) — a professional / high-income tenant draw. Strengths: schools A+, housing A+, commute A; Watch: amenities F.
- Pinellas (suburban): math 51% / reading 51% proficiency, ranked #31 of 73 in FL (top 42%) — acceptable for families but not a draw, mixed tenant base, ~2y average lease.
- Market conditions: Rents falling (-5.2%/yr); 377 active listings in the ZIP; 7 comparable units currently listed for rent nearby; rentals leasing fast (median 9d on market — plan ~1-2 weeks tenant-placement turnaround); 2,676 units permitted in Pinellas County in 2024 (1,422 in 5+ unit buildings).
- This rent runs 31% of the median local income ($72k/yr) — at the standard rent-burdened threshold; future hikes will face affordability resistance.
Forward outlook
- Local home prices are declining (-3.0%/yr); year-one equity from $967 of loan paydown is wiped out by about $4k of value loss. Plan a longer hold.
- Pinellas County population projected at +14% by 2050 — modest demand growth; plan on rents tracking national, not racing it.
Negotiation context
- It's been on market 437 days — a 12% lower offer ($123k) is reasonable based on typical stale-listing flexibility.
- 2 sale attempts; this cycle's ask has dropped $45k (24%) from the opening price — seller is motivated, your offer sets the floor, not the list.
- Current owner paid $108k; 30% above their basis — modest negotiation headroom, anchor on the comps not their cost.
Risks & watch-outs
- Climate carrying-cost: major flood risk; severe wind risk, 99% chance of damaging wind over 30y; extreme-heat days projected 7→26/yr by 2055 (HVAC capex compounding) — expect insurance premiums to compound above CPI over the hold.
Questions for the listing agent
- It's been on market 437 days. Have you received any prior offers? Is the seller open to a 12% concession, seller financing, or rate buy-down credit?
- Built in 1969 — when were the roof, HVAC, electrical panel, plumbing, and water heater last replaced?
- What does the HOA fee cover, when was the last increase, and are there any pending special assessments or reserve-fund shortfalls?
- Why hasn't it sold? Are there any deal-killer items the seller is aware of (foundation, flood, title, zoning, code violations)?
- Is there a deadline driving the sale (1031 exchange, divorce, estate, relocation)? That informs how much negotiation room exists.
- Schools are A-rated — typically a magnet for longer-tenancy family renters. What's the average tenant stay here, and is there a school-zone premium baked into asking?
- What's the average days-on-market for RENTAL listings here right now (not sales)? A rising rental-DOM trend means longer vacancies and softer asking-rent achievability than the comps imply.
- What's the recent tenant-quality profile in this submarket — average credit score on applications, eviction rate, late-payment / NSF rate, and stable-employment percentage? A property-management company in the area should have these aggregated.
- How much new for-sale + rental construction is in the pipeline within 1–3 miles? Heavy new supply typically softens prices + rents 12–24 months out; constrained supply supports both.
Investment metrics
- 1% rule
- 1.32% ✓
- Cap rate
- 10.39%
- Cash-on-cash
- 14.63%
- DSCR
- 1.65
- GRM
- 6.3
CMA / ARV
- ARV (on-the-fly)
- $95,976
- Comps found
- 1
Show comp detail 1 sale within ~0.75 mi
| Address | Dist | Beds/Ba | Sqft | Sold | Price | $/sf | Match |
|---|---|---|---|---|---|---|---|
| 107 Freedom Ct #29 | 0.47mi | 2/2.0 | 816 (+10%) | 9mo | $105,000 | $129 | 53 |
Match score weights: distance 35% · size 25% · config 20% · recency 20%. Top-matched comps best support the ARV.
Projected returns pro-forma
-3.0% appreciation · 0.0% rent growth · sell at horizon
- IRR
- 1.6%
- Equity multiple
- 1.06×
- Total profit
- $2,376
- Equity at exit
- $20,860
- IRR
- 8.0%
- Equity multiple
- 1.52×
- Total profit
- $20,475
- Equity at exit
- $12,096
Cash invested: $39,172 (down + closing). Projections, not guarantees.
Landlord ↔ Tenant lean methodology
- Overall (STATE)
- 87 Strongly Landlord-Friendly
- State Florida
- 87 Strongly Landlord-Friendly · R+3
- County
- — inherits STATE
- City
- — inherits STATE
ZIP-level market 34684
- Rents YoY
- -5.2%
- Active inventory
- 377
- Price-to-rent
- 6.3×
Monthly cashflow live
- Estimated rent
- $1,847 high interval (Pro) →
- Mortgage (P&I)
- −$734
- Tax from tax record
- −$83 /mo · $1,000/yr
- Insurance
- −$58
- HOA
- −$106
- Vacancy / Maint / Mgmt
- −$388
- Net cashflow
- $478
Break-even live
Sensitivity live
| Price | -10% $557 | -5% $517 | +0% $478 | +5% $438 | +10% $398 |
|---|---|---|---|---|---|
| Rent | -10% $332 | -5% $405 | +0% $478 | +5% $551 | +10% $624 |
| Rate | -1.0pp $548 | -0.5pp $513 | base $478 | +0.5pp $441 | +1.0pp $405 |
UW: 25.0% down · 7.5% · 30yr · 1.5% tax · 5.0% vac · 8.0% maint · 8.0% mgmt
Financing live
Cash to close
- Down payment
- $34,975
- Closing costs
- $4,197
- Reserves months
- —
- Total cash needed
- —
Loan-product check · same deal, 3 products live
Conventional
25% down · 7.5% · 30yr
- Down + closing
- —
- Monthly P&I
- —
- Monthly cashflow
- —
- DSCR
- —
- Eligible?
- —
Personal DTI + credit; lowest rate.
DSCR
20% down · 8.5% · 30yr
- Down + closing
- —
- Monthly P&I
- —
- Monthly cashflow
- —
- DSCR
- —
- Eligible?
- —
No personal income docs; deal must DSCR.
Hard money
10% down · 12.0% · 12mo
- Down + closing
- —
- Monthly P&I
- —
- Monthly cashflow
- —
- DSCR
- —
- Eligible?
- —
Short-term bridge; refi at stabilization.
Rent comps 7 comps
| Address | Beds | Baths | Sqft | Rent | $/sqft | DOM | Units | Dist |
|---|---|---|---|---|---|---|---|---|
| 36090 US Highway 19 N Palm Harbor, FL | 1.0–3.0 | 1.0–2.0 | 1046 | $2,557 | $2.44 | 3d | 66 | 0.61mi |
| 36750 US-19 Palm Harbor, FL | 1.0 | 1.0 | 610 | $1,875 | $3.07 | 8d | 1 | 0.65mi |
| 35820 U.S. 19 Unit A2 Palm Harbor, FL | 1.0 | 1.0 | 740 | $1,884 | $2.55 | 5d | 1 | 0.71mi |
| 3295 Fox Chase Cir N #105 Palm Harbor, FL | 1.0 | 1.0 | 614 | $1,850 | $3.01 | 25d | 1 | 0.81mi |
| 2141 Portofino Pl Palm Harbor, FL | 1.0 | 1.0 | 700 | $1,510 | $2.16 | 25d | 2 | 0.95mi |
| 2171 Portofino Pl #2727 Palm Harbor, FL | 1.0 | 1.0 | 700 | $1,550 | $2.21 | 25d | 1 | 1.06mi |
| 2350 Cypress Pond Rd Palm Harbor, FL | 1.0–2.0 | 1.0–2.0 | 790 | $1,670 | $2.11 | 2d | 54 | 1.09mi |
HOA detail
- Monthly dues
- $106 · $1,272/yr
- Likely covers
- pool
Listing history 16 events
-
2026-05-31remarks 437-char remark
-
2026-05-31statusdays on market $139,900 Pending 437 DOM
-
2026-05-22status Active
-
2026-05-17status Pending
-
2026-03-08price $139,900
-
2026-02-21price $149,900
-
2026-02-09price $154,000
-
2026-01-22price $159,900
-
2025-12-14price $164,000
-
2025-06-05price $179,900
-
2025-03-14$184,900 Active
-
2020-07-16soldstatus $107,500
-
2019-02-25soldstatus $81,000
-
2017-12-21soldstatus $75,000
-
2005-11-01soldstatus $70,500
-
1986-09-09soldstatus $39,500
ⓘ Source: listings_history table (triggers on properties + properties_extension) + one-shot
backfill from property_details.listing_events for pre-trigger history.
Tax reassessment forecast FL · Resets to sale price
- Current annual tax
- $1,000 · $83/mo
- Projected year-2 tax
- $1,161 · $97/mo
- Expected delta
- +$161/yr (+$13/mo · 16.1%)
ⓘ Screening estimate from a state-policy table — verify with the county assessor before closing.
Climate risk First Street
- Flood 6/10 Major FEMA zone X (unshaded) · 70% chance over 30 yrs
- Wildfire 2/10 Low
- Heat 10/10 Extreme 7 d/yr ≥108°F today · 26 d/yr by 30 yrs out
- Wind 10/10 Extreme 99% chance of damaging wind over 30 yrs
- Air quality 3/10 Moderate 2 unhealthy d/yr today · 2 by 30 yrs out
Nearby sold comps map
Loading sold comps map…
Walkable amenities ~0.75 mi
Loading nearby amenities…
Taxation est. · year 1
- Rental income
- $22,161
- − Mortgage interest
- −$7,837
- − Property taxes
- −$1,000
- − Insurance
- −$700
- − Repairs & maintenance
- −$1,773
- − Management
- −$1,773
- − HOA
- −$1,272
- − Depreciation
- −$4,070
- Taxable income
- $3,737
- Est. tax owed @ 24.0%
- −$897
- After-tax cash flow
- $4,835/yr
For passive investors: Depreciation is non-cash, so a rental often shows a tax loss while cash-flowing — sheltering income. Rental losses are passive: they offset passive income freely, and up to $25,000/yr can offset ordinary (W-2) income if you actively participate and your MAGI is under $100k (phasing out to $0 by $150k); unused losses carry forward. On sale, claimed depreciation is recaptured at up to 25%, and gains may owe capital-gains tax (a 1031 exchange can defer both). Figures are a year-1 estimate at your 24.0% rate — not tax advice; consult a CPA.
Schools (NCES district)
- District
- Pinellas
- NCES district ID
- 1201560
- Math proficiency
- 51% ▼ -5.00%
- Reading proficiency
- 51% ▼ -3.00%
- Median HH income
- $46,270
- Composite
- 43.27/100
- National rank
- #3046
- State rank
- #31 of 73 in FL
Livability — Palm Harbor
- Score
- 81/100
- State rank
- #95
- US rank
- #1470
Category grades
Schools grade is shown separately in the Schools card above.
Census & demographics
- Census place
- Palm Harbor, FL
- County
- Pinellas County · 939,478 people
- City population
- 79,072
- Metro
- Tampa-St. Petersburg-Clearwater, FL
- Population (ZIP)
- 27,029
- Household income
- $72,145
- Rent vs Own
- Severe rent burden
- 1495.0
Population outlook (Pinellas County) Hauer SSP2
- Today (2025)
- 1,027,532 people
- By 2030
- 1,063,586 · +3.5%
- By 2040
- 1,125,020 · +9.5%
- By 2050
- 1,168,637 · +13.7%
- By 2075
- 1,265,188 · +23.1%
- By 2100
- 1,260,357 · +22.7%
Race, ethnicity, and origin ACS 2023
- Neighborhood character
- Predominantly White (81%)
- Race & ethnicity
- White 81% Hispanic / Latino 10% Two or more races 8% Asian 4% Black 3%
- Hispanic origin (detail)
- Puerto Rican 2% Cuban 2%
- Common ancestry
- Lithuanian 5% Romanian 5% Scotch-Irish 3%
- Foreign-born
- 13% · Canada, Jamaica, China
- Languages at home
- 84% English-only · Spanish 6% Russian/Polish/Slavic 3% Other Indo-European 2%
Political lean MEDSL · Pinellas
- 2024 margin
- Lean R (+5.2) · D 46.9% · R 52.1%
- 2008→2024 swing
- -13.5pp toward R · 2008: 8.3pp · 2024: -5.2pp
- All cycles
- 2024: R+5.2 2020: D+0.2 2016: R+1.1 2012: D+5.6 2008: D+8.3
Not yet ingested
- Civics
- —
Market trends
- HPI YoY
- ▼ -296.23%
- Current HPI
- 301.651
- Rent YoY
- ▼ -5.17%
- Metro
- Tampa-St. Petersburg-Clearwater, FL
- State GDP YoY
- ▲ 3.28%
- F500 in state
- 36
Industry mix (Fortune 500 HQ in FL)
| Industry | F500 HQs | Revenue |
|---|---|---|
| Industrial Technology | 2 | $29B |
|
||
| Insurance | 2 | $17B |
|
||
| Retail | 1 | $60B |
|
||
| Technology Distribution | 1 | $58B |
|
||
| Homebuilding | 1 | $35B |
|
||
| Technology Manufacturing | 1 | $35B |
|
||
Price history
+254.2% since first listed14 events — show timeline
- 2026-05-22 Relisted — Stellar MLS as Distributed by MLS Grid
- 2026-05-17 Pending — Stellar MLS as Distributed by MLS Grid
- 2026-03-08 Price Changed $139,900 Stellar MLS as Distributed by MLS Grid
- 2026-02-21 Price Changed $149,900 Stellar MLS as Distributed by MLS Grid
- 2026-02-09 Price Changed $154,000 Stellar MLS as Distributed by MLS Grid
- 2026-01-22 Price Changed $159,900 Stellar MLS as Distributed by MLS Grid
- 2025-12-14 Price Changed $164,000 Stellar MLS as Distributed by MLS Grid
- 2025-06-05 Price Changed $179,900 Stellar MLS as Distributed by MLS Grid
- 2025-03-14 Listed $184,900 Stellar MLS as Distributed by MLS Grid
- 2020-07-16 Sold (Public Records) $107,500 Public Records
- 2019-02-25 Sold (Public Records) $81,000 Public Records
- 2017-12-21 Sold (Public Records) $75,000 Public Records
- 2005-11-01 Sold (Public Records) $70,500 Public Records
- 1986-09-09 Sold (Public Records) $39,500 Public Records
Property tax history
+1.9%/yrLatest (2025): $1,000 · +3.9% YoY. Source: county tax records.
Cash-flow waterfall
monthlySold comps — $/sqft
last 12 mo · ≤1 miLoading sold comps…