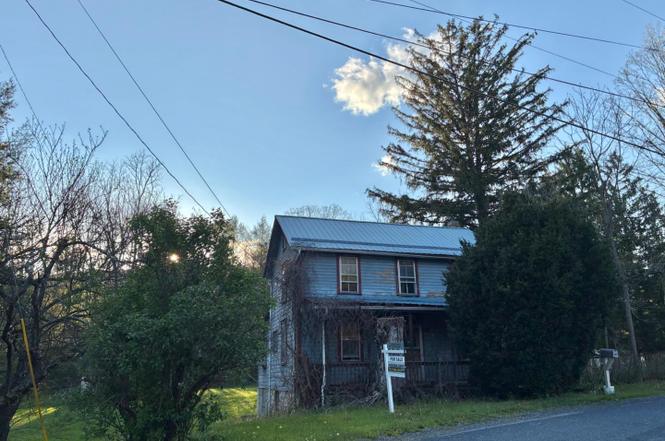
201 Hoover Rd · Wells, PA
Flood risk 10/10 · Severe
- FEMA flood zone
- X (unshaded)
- Chance of flooding over 30 yrs
- 0.99%
- Est. flood insurance / yr
- $473 – $860
Fire risk 2/10 · Minimal
- Est. fire insurance / yr
- $511 – $949
Heat risk 4/10 · Minor
- Hot days now (above 96°F)
- 7 days/yr
- Hot days in 30 yrs
- 17 days/yr
Wind risk 2/10 · Minimal
- Chance of severe wind over 30 yrs
- 1.0%
Air-quality risk 2/10 · Minimal
- Unhealthy air days now
- 1 days/yr
- Unhealthy air days in 30 yrs
- 2 days/yr
Risk factors via First Street. Map © Google.
Why this score? — see what drove the B+ grade
The composite is a weighted blend of 9 inputs, each scored 0–100. Each bar is that input's sub-score; the figure is the points it added to the 100-point composite (weight × sub-score).
- Cash flow +26.0/30.0
- ARV discount +15.0/15.0
- DSCR +8.8/10.0
- 1% rule +6.4/10.0
- Appreciation +6.2/10.0
- Schools +5.8/10.0
- Rent growth +2.5/5.0
- Livability +2.5/5.0
- Condition / age +2.5/5.0
$110,000
🖨 Deal sheet (PDF) 📄 Offer letter ✓ Due diligence
Listing remarks
Vacation property or make it your home?! This 4-bedroom, 1-bathroom traditional home, offers a unique investment opportunity on a spacious 1-acre lot in Wells Township. The main level of the home provides a bedroom with access to the full bath. Then you have the living room, kitchen with a side door and porch, formal dining room and a full bath with laundry hookups. Upstairs there are 3 bedrooms and walk-up steps to a large attic, great for storage! The property features a serene backdrop, a level yard backing to trees and a picturesque creek, providing both privacy and natural beauty. With about 300 feet of creek frontage, this property not only enhances its aesthetic appeal but also prese
Key facts
- 1 acre lot
- 2 parking spots
- Built 1900
Property features AI
Exterior
- Parking: Off-street parking for 2 vehicles (total 2 garage/parking spaces)
- Utilities: Well water; On-site septic; Electric hot water; Propane (owned) for heating
- Home design: Detached structure; Building winterized
- Construction: Wood siding exterior; Metal roof; Stone and block foundation; Year built estimated
- Exterior features: Backs to trees; Rural setting; Stream/creek on the property; Water access with approximately 300 feet of water frontage; Waterfront on a creek; Has a water view
Interior
- Bedrooms: One bedroom on the main level; Three bedrooms on the first upper level
- Flooring: Wood flooring
- Bathrooms: One full bathroom on the main level; One full bathroom total
- Heating & cooling: Forced air heating; Propane (owned) heating fuel
- Interior features: Plaster walls; Unfinished basement; Federal flood zone (Zone A)
- Laundry & utility: Laundry on the main floor; Electric hot water
Neighborhood map
What this means for you Summary
Snapshot
- This is a 4-bed/1.0-bath other listed at $110k.
Deal economics
- At list price, monthly cash flow is $219 ($3k/yr) — positive.
- The deal already cash-flows at list — no discount required.
- Meets the 1% rule at list price ($1k rent vs $110k).
- Recommended offer: $107k (3.0% below list) — sets the bar for market timing.
Location & tenants
- Location reads: area grade B — affects rentability + tenant quality, not the cash-flow math above.
- Forbes Road SD (rural): math 70% / reading 65% proficiency, ranked #109 of 658 in PA (top 17%) — acceptable for families but not a draw, mixed tenant base, ~2y average lease.
- Zoned schools: Forbes Road El Sch (math 37% / reading 57%, grade D-, #737 of 1,518 statewide, top 52%, 213 students, 57% FRL); Forbes Road Jshs (math 44% / reading 44%, grade F, #196 of 437 statewide, top 47%, 141 students, 36% FRL).
- Zoned-school proficiency averages 46% at this address vs 68% district-wide (-22 pts) — the specific schools serving this property underperform the Forbes Road SD average; the district grade overstates school quality for this exact location.
- Market conditions: 1 active listings in the ZIP; 18 units permitted in Fulton County in 2024 (0 in 5+ unit buildings).
Forward outlook
- In year one you build about $3k of equity ($761 loan paydown + $3k appreciation (2.4% local appreciation)).
- Fulton County population projected at -25% by 2050 — secular population decline; favor cash flow + early exit over multi-decade hold.
- At projected returns (2.4% appreciation + 3.0% rent growth), your $31k cash investment doubles in ~5 years — after that, you're playing with house money.
- By year 10, paydown + projected appreciation supports a ~$33k cash-out refi (75% LTV) — recoverable capital for the next deal without selling this one.
Negotiation context
- It's been on market 48 days — a 3% lower offer ($107k) is reasonable based on typical stale-listing flexibility.
- Current owner paid $26k; list at $110k implies a 317% gain — meaningful room to come down on a strong offer.
Risks & watch-outs
- Watch-outs: flood insurance adds $56/mo; built in 1900 — expect roof / HVAC / electrical / plumbing capex.
- Climate carrying-cost: severe flood risk — expect insurance premiums to compound above CPI over the hold.
Questions for the listing agent
- It's been on market 48 days. Have you received any prior offers? Is the seller open to a 3% concession, seller financing, or rate buy-down credit?
- Built in 1900 — when were the roof, HVAC, electrical panel, plumbing, and water heater last replaced?
- What's the actual annual flood-insurance premium (NFIP or private), and is the property in a SFHA with mandatory coverage?
- Is there a deadline driving the sale (1031 exchange, divorce, estate, relocation)? That informs how much negotiation room exists.
- What's the average days-on-market for RENTAL listings here right now (not sales)? A rising rental-DOM trend means longer vacancies and softer asking-rent achievability than the comps imply.
- What's the recent tenant-quality profile in this submarket — average credit score on applications, eviction rate, late-payment / NSF rate, and stable-employment percentage? A property-management company in the area should have these aggregated.
- How much new for-sale + rental construction is in the pipeline within 1–3 miles? Heavy new supply typically softens prices + rents 12–24 months out; constrained supply supports both.
Investment metrics
- 1% rule
- 1.14% ✓
- Cap rate
- 9.29%
- Cash-on-cash
- 10.71%
- DSCR
- 1.48
- GRM
- 7.3
CMA / ARV
- ARV (median comp)
- $211,188
- List price
- $110,000
- Delta
- -47.91%
- Verdict
- UNDERPRICED
- Comps
- 4 within 2.0 mi
Projected returns pro-forma
2.39% appreciation · 3.0% rent growth · sell at horizon
- IRR
- 14.0%
- Equity multiple
- 1.77×
- Total profit
- $23,744
- Equity at exit
- $45,738
- IRR
- 16.3%
- Equity multiple
- 3.26×
- Total profit
- $69,463
- Equity at exit
- $67,719
Cash invested: $30,800 (down + closing). Projections, not guarantees.
Landlord ↔ Tenant lean methodology
- Overall (STATE)
- 62 Landlord-Friendly
- State Pennsylvania
- 62 Landlord-Friendly · EVEN
- County
- — inherits STATE
- City
- — inherits STATE
ZIP-level market 16689
- Home prices YoY
- 2.4%
- Active inventory
- 1
- Price-to-rent
- 7.3×
Monthly cashflow live
- Estimated rent
- $1,250 medium interval (Pro) →
- Mortgage (P&I)
- −$577
- Tax from tax record
- −$90 /mo · $1,084/yr
- Insurance
- −$46
- Flood insurance flood zone
- −$56 /mo · $666/yr
- HOA
- −$0
- Vacancy / Maint / Mgmt
- −$263
- Net cashflow
- $219
Break-even live
Sensitivity live
| Price | -10% $282 | -5% $250 | +0% $219 | +5% $188 | +10% $157 |
|---|---|---|---|---|---|
| Rent | -10% $121 | -5% $170 | +0% $219 | +5% $269 | +10% $318 |
| Rate | -1.0pp $275 | -0.5pp $247 | base $219 | +0.5pp $191 | +1.0pp $162 |
UW: 25.0% down · 7.5% · 30yr · 1.5% tax · 5.0% vac · 8.0% maint · 8.0% mgmt
Financing live
Cash to close
- Down payment
- $27,500
- Closing costs
- $3,300
- Reserves months
- —
- Total cash needed
- —
Loan-product check · same deal, 3 products live
Conventional
25% down · 7.5% · 30yr
- Down + closing
- —
- Monthly P&I
- —
- Monthly cashflow
- —
- DSCR
- —
- Eligible?
- —
Personal DTI + credit; lowest rate.
DSCR
20% down · 8.5% · 30yr
- Down + closing
- —
- Monthly P&I
- —
- Monthly cashflow
- —
- DSCR
- —
- Eligible?
- —
No personal income docs; deal must DSCR.
Hard money
10% down · 12.0% · 12mo
- Down + closing
- —
- Monthly P&I
- —
- Monthly cashflow
- —
- DSCR
- —
- Eligible?
- —
Short-term bridge; refi at stabilization.
Listing history 18 events
-
2026-06-21days on market $110,000 Active 48 DOM
-
2026-06-18days on market $110,000 Active 46 DOM
-
2026-06-17days on market $110,000 Active 45 DOM
-
2026-06-16pricedays on market $110,000 Active 44 DOM
-
2026-06-15days on market $120,000 Active 43 DOM
-
2026-06-13days on market $120,000 Active 41 DOM
-
2026-06-12days on market $120,000 Active 40 DOM
-
2026-06-09days on market $120,000 Active 37 DOM
-
2026-06-08days on market $120,000 Active 36 DOM
-
2026-06-08days on market $120,000 Active 35 DOM
-
2026-06-07days on market $120,000 Active 34 DOM
-
2026-06-04days on market $120,000 Active 31 DOM
-
2026-06-02days on market $120,000 Active 30 DOM
-
2026-06-01days on market $120,000 Active 29 DOM
-
2026-05-31days on market $120,000 Active 28 DOM
-
2026-05-04$125,000 Active 1093-char remark
-
2026-04-29historical $125,000 1093-char remark
-
2009-01-12soldstatus $26,400
ⓘ Source: listings_history table (triggers on properties + properties_extension) + one-shot
backfill from property_details.listing_events for pre-trigger history.
Tax reassessment forecast PA · Partial reset (capped growth)
- Current annual tax
- $1,084 · $90/mo
- Projected year-2 tax
- $1,411 · $118/mo
- Expected delta
- +$327/yr (+$27/mo · 30.2%)
ⓘ Screening estimate from a state-policy table — verify with the county assessor before closing.
Climate risk First Street
- Flood 10/10 Extreme FEMA zone X (unshaded) · 99% chance over 30 yrs
- Wildfire 2/10 Low
- Heat 4/10 Moderate 7 d/yr ≥96°F today · 17 d/yr by 30 yrs out
- Wind 2/10 Low 100% chance of damaging wind over 30 yrs
- Air quality 2/10 Low 1 unhealthy d/yr today · 2 by 30 yrs out
Nearby sold comps map
Loading sold comps map…
Walkable amenities ~0.75 mi
Loading nearby amenities…
Taxation est. · year 1
- Rental income
- $15,006
- − Mortgage interest
- −$6,162
- − Property taxes
- −$1,084
- − Insurance
- −$1,216
- − Repairs & maintenance
- −$1,200
- − Management
- −$1,200
- − Depreciation
- −$3,200
- Taxable income
- $943
- Est. tax owed @ 24.0%
- −$226
- After-tax cash flow
- $2,406/yr
For passive investors: Depreciation is non-cash, so a rental often shows a tax loss while cash-flowing — sheltering income. Rental losses are passive: they offset passive income freely, and up to $25,000/yr can offset ordinary (W-2) income if you actively participate and your MAGI is under $100k (phasing out to $0 by $150k); unused losses carry forward. On sale, claimed depreciation is recaptured at up to 25%, and gains may owe capital-gains tax (a 1031 exchange can defer both). Figures are a year-1 estimate at your 24.0% rate — not tax advice; consult a CPA.
Schools (NCES district)
- District
- Forbes Road SD
- NCES district ID
- 4209870
- Math proficiency
- 70% ▲ 5.00%
- Reading proficiency
- 65% ▼ -5.00%
- Median HH income
- $45,382
- Composite
- 58.17/100
- National rank
- #2127
- State rank
- #109 of 658 in PA
Livability — Wells
No livability data for this city. (Only ~50 U.S. cities are tracked.)
Census & demographics
- Population (ZIP)
- 331
Population outlook (Fulton County) Hauer SSP2
- Today (2025)
- 13,762 people
- By 2030
- 13,167 · -4.3%
- By 2040
- 11,836 · -14.0%
- By 2050
- 10,342 · -24.9%
- By 2075
- 7,170 · -47.9%
- By 2100
- 4,581 · -66.7%
Race, ethnicity, and origin ACS 2023
- Neighborhood character
- Predominantly White (100%)
- Race & ethnicity
- White 100%
- Common ancestry
- Slovak 5% Italian 2% Lithuanian 2%
- Foreign-born
- 1%
- Languages at home
- 93% English-only · Other Indo-European 7%
Political lean MEDSL · Fulton
- 2024 margin
- Solid R (+72.6) · D 13.5% · R 86.1%
- 2008→2024 swing
- -24.0pp toward R · 2008: -48.6pp · 2024: -72.6pp
- All cycles
- 2024: R+72.6 2020: R+72.0 2016: R+70.8 2012: R+56.6 2008: R+48.6
Not yet ingested
- Civics
- —
Market trends
- HPI YoY
- ▲ 2.39%
- Current HPI
- 101.862
- Rent YoY
- —
- Metro
- —
- State GDP YoY
- ▲ 1.68%
- F500 in state
- 34
Industry mix (Fortune 500 HQ in PA)
| Industry | F500 HQs | Revenue |
|---|---|---|
| Healthcare | 2 | $309B |
|
||
| Insurance | 2 | $27B |
|
||
| Telecommunications / Media | 1 | $124B |
|
||
| Industrial Distribution | 1 | $22B |
|
||
| Financial Services | 1 | $20B |
|
||
| Chemicals / Materials | 1 | $18B |
|
||
Price history
+316.7% since first listed5 events — show timeline
- 2026-06-15 Price Changed $110,000 BRIGHT MLS
- 2026-05-27 Price Changed $120,000 BRIGHT MLS
- 2026-05-04 Listed $125,000 BRIGHT MLS
- 2026-04-29 Coming Soon $125,000 BRIGHT MLS
- 2009-01-12 Sold (Public Records) $26,400 Public Records
Property tax history
+0.4%/yrLatest (2026): $1,084 · +0.0% YoY. Source: county tax records.
Cash-flow waterfall
monthlySold comps — $/sqft
last 12 mo · ≤1 miLoading sold comps…