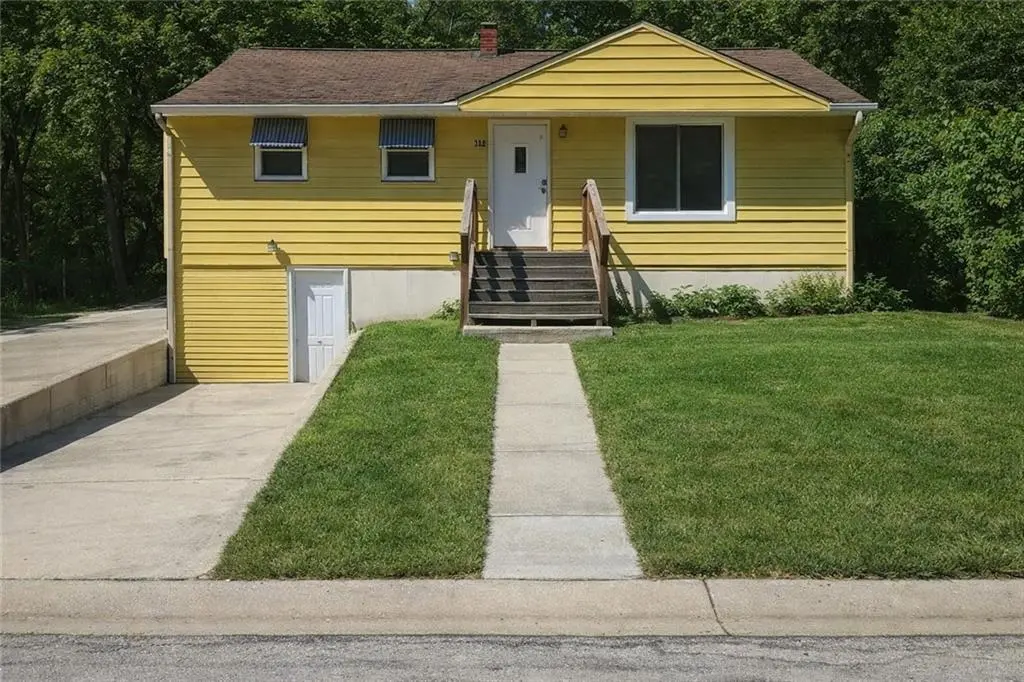
3422 E 54th St · Kansas City, MO
Flood risk 1/10 · Minimal
- FEMA flood zone
- X (unshaded)
- Chance of flooding over 30 yrs
- 0.0%
- Est. flood insurance / yr
- $473 – $860
Fire risk 1/10 · Minimal
- Est. fire insurance / yr
- $1,054 – $1,958
Heat risk 4/10 · Minor
- Hot days now (above 107°F)
- 7 days/yr
- Hot days in 30 yrs
- 17 days/yr
Wind risk 2/10 · Minimal
- Chance of severe wind over 30 yrs
- —
Air-quality risk 3/10 · Minor
- Unhealthy air days now
- 3 days/yr
- Unhealthy air days in 30 yrs
- 5 days/yr
Risk factors via First Street. Map © Google.
Why this score? — see what drove the D- grade
The composite is a weighted blend of 9 inputs, each scored 0–100. Each bar is that input's sub-score; the figure is the points it added to the 100-point composite (weight × sub-score).
- Cash flow +11.2/30.0
- ARV discount +10.7/15.0
- Livability +3.9/5.0
- Rent growth +3.6/5.0
- DSCR +3.3/10.0
- Condition / age +2.5/5.0
- 1% rule +2.0/10.0
- Schools +1.5/10.0
- Appreciation +0.0/10.0
$170,000
🖨 Deal sheet (PDF) 📄 Offer letter ✓ Due diligence
Listing remarks MLS
True duplex property offering two separate units with individual entrances, ideal for investor or house-hack buyer. Property provides opportunity for rental income from both units or owner-occupancy with income from the second unit. Unit mix: 3 bed / 1 bath and 2 bed / 1 bath (see MLS fields for details). Current rents: Unit A $750, Unit B Vacant. Room to grow rents significantly - Rentometer has median rents for this neighborhood at $1,190/mo. Total projected monthly income: $2,380. The property was fully renovated in 2022. New electrical, plumbing, and flooring. Zero deferred maintenance. Easy to lease in this area. Strong rental demand location with long-term income potential. Property may be suitable for value-add or stabilization strategy depending on buyer’s plan. Seller is offering a portfolio of 7 properties for sale. The portfolio offers a 9.6% cap rate and 18% COCR, producing approximately $37,000 in annual income after debt service. A T12 for the portfolio is attached to this listing. Please do not disturb tenants. Showings by appointment only. No owner financing. No creative financing. No wholesalers or assignable contracts. End buyers only
Key facts
- 6,527 sq ft lot
- Built 1956
- Listed 299 days
Neighborhood map
What this means for you Summary
Snapshot
- This is a 2-bed/1.0-bath single-family listed at $170k.
Deal economics
- At list price, monthly cash flow is $-64 ($-771/yr) — negative.
- To cash-flow at today's rent, offer at most $159k (6.7% below list).
- To meet the 1% rule (rent ≥ 1% of price), the offer needs to be $119k (30.3% below list).
- Recommended offer: $119k (30.3% below list) — sets the bar for 1% rule.
- Cap rate 5.8% vs local median 3.9% in Kansas City — top-decile yield for the area; either an underpriced asset or a hidden risk that comps aren't pricing in. Stress-test before assuming the spread holds.
Location & tenants
- Location reads 78/100 on livability (#28 in MO, #2,671 nationally) — a middle-class / working-renter tenant base. Strengths: amenities A+, commute A+, cost of living A+; Watch: schools C-, crime F.
- Kansas City 33 (urban): math 12% / reading 24% proficiency, ranked #308 of 324 in MO (top 95%) — low school quality limits family demand, transient renter base, plan for 1-2y turnover; 75% free/reduced lunch — lower-income household profile, screen leases tightly.
- Market conditions: Rents rising fast (+4.4%/yr); 185 active listings in the ZIP; 36 comparable units currently listed for rent nearby; rentals at typical pace (median 25d on market — plan ~3-4 weeks tenant-placement turnaround); lower-income renter base — watch delinquency; 4,002 units permitted in Jackson County in 2024 (2,271 in 5+ unit buildings).
- This rent runs 34% of the median local income ($42k/yr) — at the standard rent-burdened threshold; future hikes will face affordability resistance.
Forward outlook
- Local home prices are declining (-3.0%/yr); year-one equity from $1k of loan paydown is wiped out by about $5k of value loss. Plan a longer hold.
- Jackson County population projected at +4% by 2050 — modest demand growth; plan on rents tracking national, not racing it.
Negotiation context
- It's been on market 300 days — a 12% lower offer ($150k) is reasonable based on typical stale-listing flexibility.
- 5 sale attempts since 17y ago; this cycle's ask has dropped $45k (21%) from the opening price — seller is motivated, your offer sets the floor, not the list.
Risks & watch-outs
- Watch-outs: built in 1956 — expect roof / HVAC / electrical / plumbing capex.
Questions for the listing agent
- What do current leases actually rent for vs. the listed asking? Can we see a recent rent roll and the last 12 months of T-12 income?
- It's been on market 300 days. Have you received any prior offers? Is the seller open to a 30% concession, seller financing, or rate buy-down credit?
- Built in 1956 — when were the roof, HVAC, electrical panel, plumbing, and water heater last replaced?
- Why hasn't it sold? Are there any deal-killer items the seller is aware of (foundation, flood, title, zoning, code violations)?
- Is there a deadline driving the sale (1031 exchange, divorce, estate, relocation)? That informs how much negotiation room exists.
- Crime grade is F in this area — have there been break-ins, vandalism, or insurance claims at this property in the last 3 years? What carrier currently insures it and at what premium?
- The area grade is low — what's the realistic commute time and amenity access for the typical tenant pool here? Any planned neighborhood developments (good or bad) we should know about?
- What's the average days-on-market for RENTAL listings here right now (not sales)? A rising rental-DOM trend means longer vacancies and softer asking-rent achievability than the comps imply.
- What's the recent tenant-quality profile in this submarket — average credit score on applications, eviction rate, late-payment / NSF rate, and stable-employment percentage? A property-management company in the area should have these aggregated.
- How much new for-sale + rental construction is in the pipeline within 1–3 miles? Heavy new supply typically softens prices + rents 12–24 months out; constrained supply supports both.
Investment metrics
- 1% rule
- 0.70% ✗
- Cap rate
- 5.84%
- Cash-on-cash
- -1.62%
- DSCR
- 0.93
- GRM
- 11.9
CMA / ARV
- ARV (median comp)
- $183,224
- List price
- $170,000
- Delta
- -7.22%
- Verdict
- FAIR
- Comps
- 13 within 1.0 mi
Show comp detail 12 sales within ~0.75 mi
| Address | Dist | Beds/Ba | Sqft | Sold | Price | $/sf | Match |
|---|---|---|---|---|---|---|---|
| 3451 E 54th St | 0.06mi | 3/2.0 (+1) | 869 (+1%) | 7mo | $115,000 | $132 | 81 |
| 5140 Norton Ave | 0.45mi | 2/1.0 | 884 (+2%) | 4mo | $75,000 | $85 | 71 |
| 5424 College Ave | 0.13mi | 2/1.0 | 744 (-14%) | 3mo | $70,000 | $94 | 68 |
| 5842 Bellefontaine Ave | 0.64mi | 3/1.0 (+1) | 864 (0%) | 1mo | $89,900 | $104 | 64 |
| 5507 Park Ave | 0.75mi | 2/1.0 | 874 (+1%) | 5mo | $94,900 | $109 | 59 |
| 5030 Walrond Ave | 0.47mi | 2/1.0 | 770 (-11%) | 2mo | $64,900 | $84 | 59 |
| 4909 S Benton Ave | 0.70mi | 2/1.0 | 821 (-5%) | 5mo | $75,000 | $91 | 55 |
| 3821 E 59th Ter | 0.73mi | 2/1.0 | 900 (+4%) | 8mo | $107,000 | $119 | 53 |
| 5923 Walrond Ave | 0.71mi | 2/1.0 | 812 (-6%) | 5mo | $125,000 | $154 | 52 |
| 5306 Olive St | 0.71mi | 2/1.0 | 946 (+10%) | 0mo | $154,900 | $164 | 51 |
| 5132 Wabash Ave | 0.71mi | 2/1.0 | 783 (-9%) | 2mo | $139,000 | $178 | 50 |
| 4824 Agnes Ave | 0.72mi | 2/1.0 | 792 (-8%) | 4mo | $79,000 | $100 | 48 |
Match score weights: distance 35% · size 25% · config 20% · recency 20%. Top-matched comps best support the ARV.
Projected returns pro-forma
-3.0% appreciation · 4.42% rent growth · sell at horizon
- IRR
- -17.7%
- Equity multiple
- 0.37×
- Total profit
- $-30,010
- Equity at exit
- $25,348
- IRR
- -7.8%
- Equity multiple
- 0.49×
- Total profit
- $-24,506
- Equity at exit
- $14,698
Cash invested: $47,600 (down + closing). Projections, not guarantees.
Landlord ↔ Tenant lean methodology
- Overall (STATE)
- 81 Strongly Landlord-Friendly
- State Missouri
- 81 Strongly Landlord-Friendly · R+10
- County
- — inherits STATE
- City
- — inherits STATE
ZIP-level market 64130
- Home prices YoY
- -21.5%
- Rents YoY
- 4.4%
- Active inventory
- 185
- Price-to-rent
- 11.9×
Monthly cashflow live
- Estimated rent
- $1,186 high interval (Pro) →
- Mortgage (P&I)
- −$891
- Tax from tax record
- −$39 /mo · $464/yr
- Insurance
- −$71
- HOA
- −$0
- Vacancy / Maint / Mgmt
- −$249
- Net cashflow
- $-64
Break-even live
Sensitivity live
| Price | -10% $32 | -5% $-16 | +0% $-64 | +5% $-112 | +10% $-160 |
|---|---|---|---|---|---|
| Rent | -10% $-158 | -5% $-111 | +0% $-64 | +5% $-17 | +10% $29 |
| Rate | -1.0pp $21 | -0.5pp $-21 | base $-64 | +0.5pp $-108 | +1.0pp $-153 |
UW: 25.0% down · 7.5% · 30yr · 1.5% tax · 5.0% vac · 8.0% maint · 8.0% mgmt
Financing live
Cash to close
- Down payment
- $42,500
- Closing costs
- $5,100
- Reserves months
- —
- Total cash needed
- —
Loan-product check · same deal, 3 products live
Conventional
25% down · 7.5% · 30yr
- Down + closing
- —
- Monthly P&I
- —
- Monthly cashflow
- —
- DSCR
- —
- Eligible?
- —
Personal DTI + credit; lowest rate.
DSCR
20% down · 8.5% · 30yr
- Down + closing
- —
- Monthly P&I
- —
- Monthly cashflow
- —
- DSCR
- —
- Eligible?
- —
No personal income docs; deal must DSCR.
Hard money
10% down · 12.0% · 12mo
- Down + closing
- —
- Monthly P&I
- —
- Monthly cashflow
- —
- DSCR
- —
- Eligible?
- —
Short-term bridge; refi at stabilization.
Rent comps 36 comps
| Address | Beds | Baths | Sqft | Rent | $/sqft | DOM | Units | Dist |
|---|---|---|---|---|---|---|---|---|
| 3315 E 52nd St Kansas City, MO | 2.0 | 1.0 | 662 | $1,125 | $1.70 | 24d | 1 | 0.24mi |
| 5614 Indiana Ave Kansas City, MO | 3.0 | 1.0 | 900 | $1,175 | $1.31 | 44d | 1 | 0.30mi |
| 3600 E 57th St Kansas City, MO | 3.0 | 1.0 | 1037 | $1,250 | $1.21 | 44d | 1 | 0.39mi |
| 5709 Bales Ave Kansas City, MO | 2.0 | 1.0 | 782 | $1,095 | $1.40 | 24d | 1 | 0.42mi |
| 3017 E 51st St Kansas City, MO | 2.0 | 1.0 | 621 | $1,303 | $2.10 | 8d | 1 | 0.44mi |
| 3617 E 58th St Unit 2 Kansas City, MO | 2.0 | 1.0 | 936 | $875 | $0.93 | 44d | 1 | 0.50mi |
| 3615 E 58th St Unit 1 Kansas City, MO | 2.0 | 1.0 | 936 | $875 | $0.93 | 44d | 1 | 0.50mi |
| 3949 Doctor Martin Luther King Junior Blvd Kansas City, MO | 1.0–2.0 | 1.0–2.0 | 945 | $1,565 | $1.66 | 3d | 3 | 0.57mi |
| 5013 S Benton Ave Kansas City, MO | 3.0 | 1.0 | 978 | $1,225 | $1.25 | 24d | 1 | 0.57mi |
| 4917 S Benton Ave Kansas City, MO | 2.0 | 1.0 | 1000 | $1,100 | $1.10 | 24d | 1 | 0.67mi |
| 4911 S Benton Ave Kansas City, MO | 2.0 | 1.0 | 1000 | $1,100 | $1.10 | 18d | 1 | 0.68mi |
| 6029 Indiana Ave Kansas City, MO | 2.0 | 1.0 | 832 | $1,150 | $1.38 | 44d | 1 | 0.82mi |
| 2512 E 59th St Kansas City, MO | 2.0 | 1.0 | 750 | $1,150 | $1.53 | 44d | 1 | 0.84mi |
| 3604 E 61st St Unit 3604 Kansas City, MO | 3.0 | 1.0 | 875 | $1,300 | $1.49 | 44d | 1 | 0.85mi |
| 5114 Brooklyn Ave Kansas City, MO | 3.0 | 1.5 | 1116 | $1,300 | $1.16 | 8d | 1 | 0.88mi |
| 5713 Brooklyn Ave Kansas City, MO | 2.0 | 1.0 | 600 | $1,200 | $2.00 | 8d | 1 | 0.89mi |
| 4930 Park Ave Kansas City, MO | 3.0 | 1.0 | 900 | $1,300 | $1.44 | 17d | 1 | 0.92mi |
| 5410 Euclid Ave Kansas City, MO | 3.0 | 2.0 | 1119 | $1,395 | $1.25 | 44d | 1 | 0.93mi |
| 2100 E 58th St Kansas City, MO | 2.0 | 1.0 | 1030 | $1,500 | $1.46 | 44d | 1 | 0.98mi |
| 4250 E 60 Ter Unit 4250 Kansas City, MO | 2.0 | 1.0 | 783 | $895 | $1.14 | 24d | 1 | 0.98mi |
| 5529 Michigan Ave Kansas City, MO | 2.0 | 1.0 | 847 | $995 | $1.17 | 44d | 1 | 0.99mi |
| 5730 Garfield Ave Kansas City, MO | 3.0 | 1.0 | 866 | $1,195 | $1.38 | 17d | 1 | 0.99mi |
| 2205 E 59th St Kansas City, MO | 2.0 | 1.0 | 724 | $1,025 | $1.42 | 17d | 1 | 1.01mi |
| 5702 Euclid Ave Kansas City, MO | 2.0 | 1.0 | 683 | $1,000 | $1.46 | 44d | 1 | 1.01mi |
| 4534 S Benton Ave Kansas City, MO | 2.0 | 1.0 | 912 | $1,045 | $1.15 | 17d | 1 | 1.10mi |
| 5332 Highland Ave Kansas City, MO | 3.0 | 1.0 | 1022 | $1,350 | $1.32 | 8d | 1 | 1.12mi |
| 4427 Agnes Ave Kansas City, MO | 3.0 | 1.0 | 1100 | $1,350 | $1.23 | 17d | 1 | 1.21mi |
| 4309 College Ave Kansas City, MO | 3.0 | 2.0 | 1040 | $1,550 | $1.49 | 17d | 1 | 1.35mi |
| 1702 Bushman Dr Kansas City, MO | 1.0–2.0 | 1.0–2.0 | 895 | $1,065 | $1.19 | 44d | 1 | 1.42mi |
| 4216 Cleveland Ave Kansas City, MO | 2.0 | 1.0 | 780 | $1,125 | $1.44 | 17d | 1 | 1.47mi |
| 4818 Paseo Blvd Unit 1W Kansas City, MO | 1.0 | 1.0 | 526 | $945 | $1.80 | 24d | 1 | 1.47mi |
| 4818 Paseo Blvd Kansas City, MO | 1.0 | 1.0 | 526 | $945 | $1.80 | 12d | 10 | 1.48mi |
| 4818 Paseo Blvd Kansas City, MO | 1.0 | 1.0 | 526 | $945 | $1.80 | 4d | 8 | 1.48mi |
| 4818 The Paseo Unit 3S Kansas City, MO | 1.0 | 1.0 | 526 | $895 | $1.70 | 24d | 1 | 1.48mi |
| 4818 The Paseo Unit 2N Kansas City, MO | 1.0 | 1.0 | 526 | $995 | $1.89 | 24d | 1 | 1.48mi |
| 4818 The Paseo Unit 2N Kansas City, MO | 1.0 | 1.0 | 526 | $945 | $1.80 | 17d | 1 | 1.48mi |
Listing history 32 events
-
2026-06-21days on market $170,000 Active 300 DOM
-
2026-06-18days on market $170,000 Active 297 DOM
-
2026-06-17days on market $170,000 Active 296 DOM
-
2026-06-16days on market $170,000 Active 295 DOM
-
2026-06-15days on market $170,000 Active 294 DOM
-
2026-06-13days on market $170,000 Active 292 DOM
-
2026-06-09days on market $170,000 Active 288 DOM
-
2026-06-08days on market $170,000 Active 287 DOM
-
2026-06-07days on market $170,000 Active 286 DOM
-
2026-06-05days on market $170,000 Active 283 DOM
-
2026-06-03days on market $170,000 Active 282 DOM
-
2026-06-02days on market $170,000 Active 281 DOM
-
2026-06-01days on market $170,000 Active 280 DOM
-
2026-05-31days on market $170,000 Active 279 DOM
-
2026-05-15price $170,000 1182-char remark
Show marketing remark (1182 chars)
True duplex property offering two separate units with individual entrances, ideal for investor or house-hack buyer. Property provides opportunity for rental income from both units or owner-occupancy with income from the second unit. Unit mix: 3 bed / 1 bath and 2 bed / 1 bath (see MLS fields for details). Current rents: Unit A $750, Unit B Vacant. Room to grow rents significantly - Rentometer has median rents for this neighborhood at $1,190/mo. Total projected monthly income: $2,380. The property was fully renovated in 2022. New electrical, plumbing, and flooring. Zero deferred maintenance. Easy to lease in this area. Strong rental demand location with long-term income potential. Property may be suitable for value-add or stabilization strategy depending on buyer’s plan. Seller is offering a portfolio of 7 properties for sale. The portfolio offers a 9.6% cap rate and 18% COCR, producing approximately $37,000 in annual income after debt service. A T12 for the portfolio is attached to this listing. Please do not disturb tenants. Showings by appointment only. No owner financing. No creative financing. No wholesalers or assignable contracts. End buyers only
-
2026-05-12status Active 1182-char remark
Show marketing remark (1182 chars)
True duplex property offering two separate units with individual entrances, ideal for investor or house-hack buyer. Property provides opportunity for rental income from both units or owner-occupancy with income from the second unit. Unit mix: 3 bed / 1 bath and 2 bed / 1 bath (see MLS fields for details). Current rents: Unit A $750, Unit B Vacant. Room to grow rents significantly - Rentometer has median rents for this neighborhood at $1,190/mo. Total projected monthly income: $2,380. The property was fully renovated in 2022. New electrical, plumbing, and flooring. Zero deferred maintenance. Easy to lease in this area. Strong rental demand location with long-term income potential. Property may be suitable for value-add or stabilization strategy depending on buyer’s plan. Seller is offering a portfolio of 7 properties for sale. The portfolio offers a 9.6% cap rate and 18% COCR, producing approximately $37,000 in annual income after debt service. A T12 for the portfolio is attached to this listing. Please do not disturb tenants. Showings by appointment only. No owner financing. No creative financing. No wholesalers or assignable contracts. End buyers only
-
2026-04-15historical Active Under Contract 1182-char remark
Show marketing remark (1182 chars)
True duplex property offering two separate units with individual entrances, ideal for investor or house-hack buyer. Property provides opportunity for rental income from both units or owner-occupancy with income from the second unit. Unit mix: 3 bed / 1 bath and 2 bed / 1 bath (see MLS fields for details). Current rents: Unit A $750, Unit B Vacant. Room to grow rents significantly - Rentometer has median rents for this neighborhood at $1,190/mo. Total projected monthly income: $2,380. The property was fully renovated in 2022. New electrical, plumbing, and flooring. Zero deferred maintenance. Easy to lease in this area. Strong rental demand location with long-term income potential. Property may be suitable for value-add or stabilization strategy depending on buyer’s plan. Seller is offering a portfolio of 7 properties for sale. The portfolio offers a 9.6% cap rate and 18% COCR, producing approximately $37,000 in annual income after debt service. A T12 for the portfolio is attached to this listing. Please do not disturb tenants. Showings by appointment only. No owner financing. No creative financing. No wholesalers or assignable contracts. End buyers only
-
2026-02-26price $184,950 1182-char remark
Show marketing remark (1182 chars)
True duplex property offering two separate units with individual entrances, ideal for investor or house-hack buyer. Property provides opportunity for rental income from both units or owner-occupancy with income from the second unit. Unit mix: 3 bed / 1 bath and 2 bed / 1 bath (see MLS fields for details). Current rents: Unit A $750, Unit B Vacant. Room to grow rents significantly - Rentometer has median rents for this neighborhood at $1,190/mo. Total projected monthly income: $2,380. The property was fully renovated in 2022. New electrical, plumbing, and flooring. Zero deferred maintenance. Easy to lease in this area. Strong rental demand location with long-term income potential. Property may be suitable for value-add or stabilization strategy depending on buyer’s plan. Seller is offering a portfolio of 7 properties for sale. The portfolio offers a 9.6% cap rate and 18% COCR, producing approximately $37,000 in annual income after debt service. A T12 for the portfolio is attached to this listing. Please do not disturb tenants. Showings by appointment only. No owner financing. No creative financing. No wholesalers or assignable contracts. End buyers only
-
2026-02-23price $193,900 1182-char remark
Show marketing remark (1182 chars)
True duplex property offering two separate units with individual entrances, ideal for investor or house-hack buyer. Property provides opportunity for rental income from both units or owner-occupancy with income from the second unit. Unit mix: 3 bed / 1 bath and 2 bed / 1 bath (see MLS fields for details). Current rents: Unit A $750, Unit B Vacant. Room to grow rents significantly - Rentometer has median rents for this neighborhood at $1,190/mo. Total projected monthly income: $2,380. The property was fully renovated in 2022. New electrical, plumbing, and flooring. Zero deferred maintenance. Easy to lease in this area. Strong rental demand location with long-term income potential. Property may be suitable for value-add or stabilization strategy depending on buyer’s plan. Seller is offering a portfolio of 7 properties for sale. The portfolio offers a 9.6% cap rate and 18% COCR, producing approximately $37,000 in annual income after debt service. A T12 for the portfolio is attached to this listing. Please do not disturb tenants. Showings by appointment only. No owner financing. No creative financing. No wholesalers or assignable contracts. End buyers only
-
2025-11-10price $194,900 1182-char remark
Show marketing remark (1182 chars)
True duplex property offering two separate units with individual entrances, ideal for investor or house-hack buyer. Property provides opportunity for rental income from both units or owner-occupancy with income from the second unit. Unit mix: 3 bed / 1 bath and 2 bed / 1 bath (see MLS fields for details). Current rents: Unit A $750, Unit B Vacant. Room to grow rents significantly - Rentometer has median rents for this neighborhood at $1,190/mo. Total projected monthly income: $2,380. The property was fully renovated in 2022. New electrical, plumbing, and flooring. Zero deferred maintenance. Easy to lease in this area. Strong rental demand location with long-term income potential. Property may be suitable for value-add or stabilization strategy depending on buyer’s plan. Seller is offering a portfolio of 7 properties for sale. The portfolio offers a 9.6% cap rate and 18% COCR, producing approximately $37,000 in annual income after debt service. A T12 for the portfolio is attached to this listing. Please do not disturb tenants. Showings by appointment only. No owner financing. No creative financing. No wholesalers or assignable contracts. End buyers only
-
2025-11-10price $194,900
Show marketing remark (1182 chars)
True duplex property offering two separate units with individual entrances, ideal for investor or house-hack buyer. Property provides opportunity for rental income from both units or owner-occupancy with income from the second unit. Unit mix: 3 bed / 1 bath and 2 bed / 1 bath (see MLS fields for details). Current rents: Unit A $750, Unit B Vacant. Room to grow rents significantly - Rentometer has median rents for this neighborhood at $1,190/mo. Total projected monthly income: $2,380. The property was fully renovated in 2022. New electrical, plumbing, and flooring. Zero deferred maintenance. Easy to lease in this area. Strong rental demand location with long-term income potential. Property may be suitable for value-add or stabilization strategy depending on buyer’s plan. Seller is offering a portfolio of 7 properties for sale. The portfolio offers a 9.6% cap rate and 18% COCR, producing approximately $37,000 in annual income after debt service. A T12 for the portfolio is attached to this listing. Please do not disturb tenants. Showings by appointment only. No owner financing. No creative financing. No wholesalers or assignable contracts. End buyers only
-
2025-10-01price $199,900 1182-char remark
Show marketing remark (1182 chars)
True duplex property offering two separate units with individual entrances, ideal for investor or house-hack buyer. Property provides opportunity for rental income from both units or owner-occupancy with income from the second unit. Unit mix: 3 bed / 1 bath and 2 bed / 1 bath (see MLS fields for details). Current rents: Unit A $750, Unit B Vacant. Room to grow rents significantly - Rentometer has median rents for this neighborhood at $1,190/mo. Total projected monthly income: $2,380. The property was fully renovated in 2022. New electrical, plumbing, and flooring. Zero deferred maintenance. Easy to lease in this area. Strong rental demand location with long-term income potential. Property may be suitable for value-add or stabilization strategy depending on buyer’s plan. Seller is offering a portfolio of 7 properties for sale. The portfolio offers a 9.6% cap rate and 18% COCR, producing approximately $37,000 in annual income after debt service. A T12 for the portfolio is attached to this listing. Please do not disturb tenants. Showings by appointment only. No owner financing. No creative financing. No wholesalers or assignable contracts. End buyers only
-
2025-09-23price $199,900
-
2025-08-25$214,900 Active 1182-char remark
Show marketing remark (1182 chars)
True duplex property offering two separate units with individual entrances, ideal for investor or house-hack buyer. Property provides opportunity for rental income from both units or owner-occupancy with income from the second unit. Unit mix: 3 bed / 1 bath and 2 bed / 1 bath (see MLS fields for details). Current rents: Unit A $750, Unit B Vacant. Room to grow rents significantly - Rentometer has median rents for this neighborhood at $1,190/mo. Total projected monthly income: $2,380. The property was fully renovated in 2022. New electrical, plumbing, and flooring. Zero deferred maintenance. Easy to lease in this area. Strong rental demand location with long-term income potential. Property may be suitable for value-add or stabilization strategy depending on buyer’s plan. Seller is offering a portfolio of 7 properties for sale. The portfolio offers a 9.6% cap rate and 18% COCR, producing approximately $37,000 in annual income after debt service. A T12 for the portfolio is attached to this listing. Please do not disturb tenants. Showings by appointment only. No owner financing. No creative financing. No wholesalers or assignable contracts. End buyers only
-
2021-03-11soldstatus
-
2021-03-08soldstatus
-
2014-05-16$44,900
-
2010-06-23soldstatus
-
2010-05-21$12,300
-
2009-11-22historical
-
2009-06-22$75,000
-
2006-11-03soldstatus
ⓘ Source: listings_history table (triggers on properties + properties_extension) + one-shot
backfill from property_details.listing_events for pre-trigger history.
Tax reassessment forecast MO · Resets to sale price
- Current annual tax
- $464 · $39/mo
- Projected year-2 tax
- $1,649 · $137/mo
- Expected delta
- +$1,185/yr (+$99/mo · 255.8%)
ⓘ Screening estimate from a state-policy table — verify with the county assessor before closing.
Climate risk First Street
- Flood 1/10 Low FEMA zone X (unshaded) · 0% chance over 30 yrs
- Wildfire 1/10 Low
- Heat 4/10 Moderate 7 d/yr ≥107°F today · 17 d/yr by 30 yrs out
- Wind 2/10 Low
- Air quality 3/10 Moderate 3 unhealthy d/yr today · 5 by 30 yrs out
Nearby sold comps map
Loading sold comps map…
Walkable amenities ~0.75 mi
Loading nearby amenities…
Taxation est. · year 1
- Rental income
- $14,229
- − Mortgage interest
- −$9,523
- − Property taxes
- −$464
- − Insurance
- −$850
- − Repairs & maintenance
- −$1,138
- − Management
- −$1,138
- − Depreciation
- −$4,945
- Taxable loss
- −$3,830
- Est. tax savings @ 24.0%
- +$919
- After-tax cash flow
- $148/yr
For passive investors: Depreciation is non-cash, so a rental often shows a tax loss while cash-flowing — sheltering income. Rental losses are passive: they offset passive income freely, and up to $25,000/yr can offset ordinary (W-2) income if you actively participate and your MAGI is under $100k (phasing out to $0 by $150k); unused losses carry forward. On sale, claimed depreciation is recaptured at up to 25%, and gains may owe capital-gains tax (a 1031 exchange can defer both). Figures are a year-1 estimate at your 24.0% rate — not tax advice; consult a CPA.
Schools (NCES district)
- District
- Kansas City 33
- NCES district ID
- 2916400
- Math proficiency
- 12% ▼ -8.00%
- Reading proficiency
- 24% ▬ 0.00%
- Median HH income
- $35,227
- Composite
- 14.8/100
- National rank
- #9387
- State rank
- #308 of 324 in MO
Livability — Kansas City
- Score
- 78/100
- State rank
- #28
- US rank
- #2671
Category grades
Schools grade is shown separately in the Schools card above.
Census & demographics
- Census place
- Kansas City, MO
- County
- Jackson County · 687,798 people
- City population
- 439,467
- Metro
- Kansas City, MO-KS
- Population (ZIP)
- 19,644
- Household income
- $42,221
- Rent vs Own
- Severe rent burden
- 1132.0
Population outlook (Jackson County) Hauer SSP2
- Today (2025)
- 719,589 people
- By 2030
- 731,456 · +1.6%
- By 2040
- 746,689 · +3.8%
- By 2050
- 749,289 · +4.1%
- By 2075
- 736,227 · +2.3%
- By 2100
- 668,210 · -7.1%
Race, ethnicity, and origin ACS 2023
- Neighborhood character
- Predominantly Black (80%)
- Race & ethnicity
- Black 80% White 9% Hispanic / Latino 8% Two or more races 6%
- Hispanic origin (detail)
- Mexican 5%
- Common ancestry
- Lithuanian 1% Swedish 0%
- Foreign-born
- 6% · Canada
- Languages at home
- 92% English-only · Spanish 7%
Political lean MEDSL · Jackson
- 2024 margin
- D (+19.3) · D 58.9% · R 39.5% · Other 1.6%
- 2008→2024 swing
- -6.1pp toward R · 2008: 25.4pp · 2024: 19.3pp
- All cycles
- 2024: D+19.3 2020: D+22.0 2016: D+16.6 2012: D+19.0 2008: D+25.4
Not yet ingested
- Civics
- —
Market trends
- HPI YoY
- ▼ -73.32%
- Current HPI
- 267.491
- Rent YoY
- ▲ 4.42%
- Metro
- Kansas City, MO-KS
- State GDP YoY
- ▲ 1.84%
- F500 in state
- 20
Industry mix (Fortune 500 HQ in MO)
| Industry | F500 HQs | Revenue |
|---|---|---|
| Healthcare | 1 | $163B |
|
||
| Insurance | 1 | $21B |
|
||
| Industrial Technology | 1 | $17B |
|
||
| Retail | 1 | $16B |
|
||
| Industrial Distribution | 1 | $10B |
|
||
| Utilities | 1 | $9B |
|
||
Price history
+126.7% since first listed18 events — show timeline
- 2026-05-15 Price Changed $170,000 Heartland MLS as Distributed by MLS Grid
- 2026-05-12 Relisted — Heartland MLS as Distributed by MLS Grid
- 2026-04-15 Contingent — Heartland MLS as Distributed by MLS Grid
- 2026-02-26 Price Changed $184,950 Heartland MLS as Distributed by MLS Grid
- 2026-02-23 Price Changed $193,900 Heartland MLS as Distributed by MLS Grid
- 2025-11-10 Price Changed $194,900 Heartland MLS as Distributed by MLS Grid
- 2025-11-10 Price Changed $194,900 Heartland MLS as Distributed by MLS Grid
- 2025-10-01 Price Changed $199,900 Heartland MLS as Distributed by MLS Grid
- 2025-09-23 Price Changed $199,900 Heartland MLS as Distributed by MLS Grid
- 2025-08-25 Listed $214,900 Heartland MLS as Distributed by MLS Grid
- 2021-03-11 Sold (Public Records) — Public Records
- 2021-03-08 Sold (Public Records) — Public Records
- 2014-05-16 Listed $44,900 Heartland MLS as Distributed by MLS Grid
- 2010-06-23 Sold (MLS) — Heartland MLS as Distributed by MLS Grid
- 2010-05-21 Listed $12,300 Heartland MLS as Distributed by MLS Grid
- 2009-11-22 Listing Removed — Heartland MLS as Distributed by MLS Grid
- 2009-06-22 Listed $75,000 Heartland MLS as Distributed by MLS Grid
- 2006-11-03 Sold (Public Records) — Public Records
Property tax history
+0.9%/yrLatest (2025): $464 · -25.0% YoY. Source: county tax records.
Cash-flow waterfall
monthlySold comps — $/sqft
last 12 mo · ≤1 miLoading sold comps…