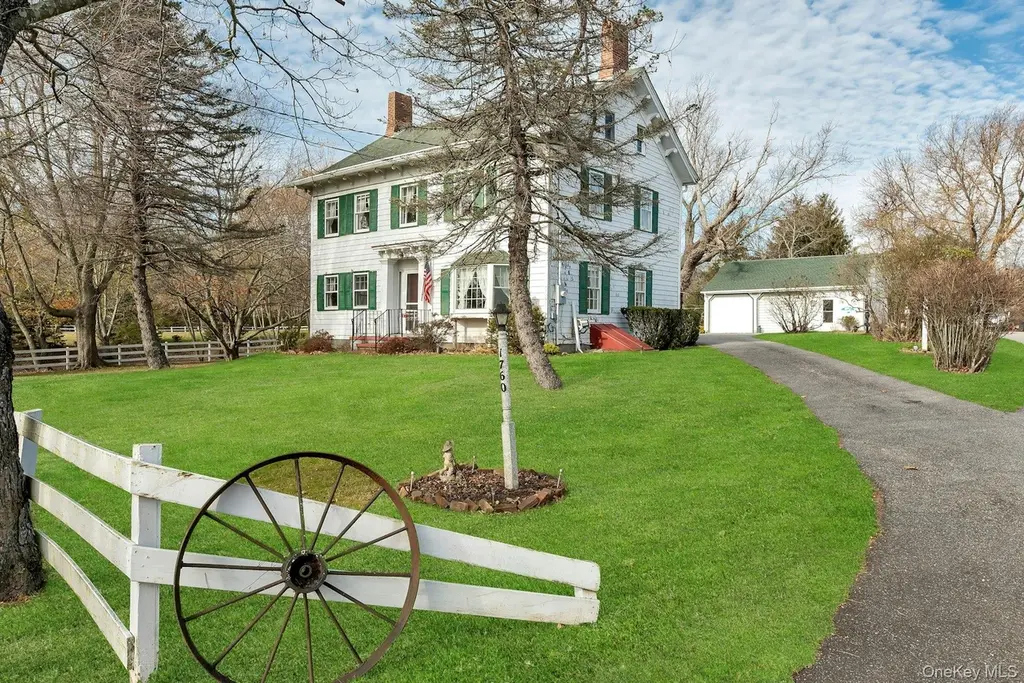
1760 Albertson Ln · Greenport West, NY
Flood risk 6/10 · Moderate
- FEMA flood zone
- X (shaded)
- Chance of flooding over 30 yrs
- 0.55%
- Est. flood insurance / yr
- $473 – $860
Fire risk 1/10 · Minimal
- Est. fire insurance / yr
- $691 – $1,283
Heat risk 5/10 · Moderate
- Hot days now (above 90°F)
- 7 days/yr
- Hot days in 30 yrs
- 20 days/yr
Wind risk 8/10 · Major
- Chance of severe wind over 30 yrs
- 80.0%
Air-quality risk 3/10 · Minor
- Unhealthy air days now
- 3 days/yr
- Unhealthy air days in 30 yrs
- 4 days/yr
Risk factors via First Street. Map © Google.
Why this score? — see what drove the D grade
The composite is a weighted blend of 9 inputs, each scored 0–100. Each bar is that input's sub-score; the figure is the points it added to the 100-point composite (weight × sub-score).
- Cash flow +19.4/30.0
- DSCR +6.1/10.0
- Schools +4.5/10.0
- 1% rule +4.2/10.0
- Livability +2.9/5.0
- Rent growth +2.5/5.0
- Condition / age +2.5/5.0
- ARV discount +0.0/15.0
- Appreciation +0.0/10.0
$1,499,000
🖨 Deal sheet 📄 Offer letter ✓ Due diligence
Listing remarks MLS
Scenic and bucolic, this 3+ acre country farm is steeped in classic North Fork charm. The property features an authentic 1800s four-bedroom, one and a half bath, farmhouse, a 2+ car garage (1976) with a workshop, office and mechanics pit, and a 1985 barn equipped with three horse stalls and ample space for tractors. Additional structures include a cinderblock chicken coop and a pig sty, offering true farmstead character. A large, established two thirds of an acre vegetable garden and an active farm stand highlight the property’s agricultural potential, while the watering hole rises and falls with the rains. This less than one-mile pastoral Greenport lane has over 130 acres of preserve land with another 50 plus acres of land on this lane soon to be preserved. Whether you choose to reimagine, repurpose, or simply enjoy this unique homestead as it is, the possibilities are abundant. A memorable bay beach just under one mile away. Please do not walk the grounds unattended.
Key facts
- Mechanics pit
- 2 car garage
- Workshop
Tags
Neighborhood map
What this means for you Summary
Snapshot
- This is a 4-bed/1.5-bath single-family listed at $1.50M.
Deal economics
- At list price, monthly cash flow is $2k ($20k/yr) — positive.
- The deal already cash-flows at list — no discount required.
- To meet the 1% rule (rent ≥ 1% of price), the offer needs to be $1.37M (8.3% below list).
- Recommended offer: $1.32M (12.0% below list) — sets the bar for market timing.
Location & tenants
- Location reads 58/100 on livability (#1,073 in NY) — a working-class tenant base; expect higher turnover. Strengths: crime A+, employment A+; Watch: schools D+, amenities F, commute F.
- Greenport Union Free School District (town): math 55% / reading 45% proficiency, ranked #450 of 755 in NY (top 60%) — acceptable for families but not a draw, mixed tenant base, ~2y average lease.
- Market conditions: 67 active listings in the ZIP; 3 comparable units currently listed for rent nearby; rentals at typical pace (median 24d on market — plan ~3-4 weeks tenant-placement turnaround); 1,366 units permitted in Suffolk County in 2024 (216 in 5+ unit buildings).
Forward outlook
- Local home prices are declining (-3.0%/yr); year-one equity from $10k of loan paydown is wiped out by about $45k of value loss. Plan a longer hold.
- Suffolk County population projected to shrink 5% by 2050 — rents likely to lag national; underwrite the cash flow, not the appreciation.
Negotiation context
- It's been on market 205 days — a 12% lower offer ($1.32M) is reasonable based on typical stale-listing flexibility.
Risks & watch-outs
- Watch-outs: built in 1800 — expect roof / HVAC / electrical / plumbing capex.
- Climate carrying-cost: major flood risk; severe wind risk, 80% chance of damaging wind over 30y; extreme-heat days projected 7→20/yr by 2055 (HVAC capex compounding) — expect insurance premiums to compound above CPI over the hold.
Questions for the listing agent
- It's been on market 205 days. Have you received any prior offers? Is the seller open to a 12% concession, seller financing, or rate buy-down credit?
- Built in 1800 — when were the roof, HVAC, electrical panel, plumbing, and water heater last replaced?
- Why hasn't it sold? Are there any deal-killer items the seller is aware of (foundation, flood, title, zoning, code violations)?
- Is there a deadline driving the sale (1031 exchange, divorce, estate, relocation)? That informs how much negotiation room exists.
- Schools are D-rated, which usually means shorter tenancies and higher turnover. Who's the typical renter profile here, and what's been the actual vacancy rate?
- The area grade is low — what's the realistic commute time and amenity access for the typical tenant pool here? Any planned neighborhood developments (good or bad) we should know about?
- What's the average days-on-market for RENTAL listings here right now (not sales)? A rising rental-DOM trend means longer vacancies and softer asking-rent achievability than the comps imply.
- What's the recent tenant-quality profile in this submarket — average credit score on applications, eviction rate, late-payment / NSF rate, and stable-employment percentage? A property-management company in the area should have these aggregated.
- How much new for-sale + rental construction is in the pipeline within 1–3 miles? Heavy new supply typically softens prices + rents 12–24 months out; constrained supply supports both.
Investment metrics
- 1% rule
- 0.92% ✗
- Cap rate
- 7.62%
- Cash-on-cash
- 4.75%
- DSCR
- 1.21
- GRM
- 9.1
CMA / ARV
- ARV (median comp)
- $1,172,582
- List price
- $1,499,000
- Delta
- 27.84%
- Verdict
- OVERPRICED
- Comps
- 6 within 1.0 mi
Show comp detail 2 sales within ~0.75 mi
| Address | Dist | Beds/Ba | Sqft | Sold | Price | $/sf | Match |
|---|---|---|---|---|---|---|---|
| 700 Bayview Ave | 0.25mi | 3/2.0 (-1) | 1,600 (-15%) | 14mo | $660,000 | $413 | 45 |
| 630 Tarpon Dr | 0.66mi | 3/2.5 (-1) | 2,100 (+12%) | 2mo | $1,943,000 | $925 | 39 |
Match score weights: distance 35% · size 25% · config 20% · recency 20%. Top-matched comps best support the ARV.
Projected returns pro-forma
-3.0% appreciation · 3.0% rent growth · sell at horizon
- IRR
- -8.9%
- Equity multiple
- 0.67×
- Total profit
- $-137,686
- Equity at exit
- $223,506
- IRR
- 0.5%
- Equity multiple
- 1.03×
- Total profit
- $14,181
- Equity at exit
- $129,606
Cash invested: $419,720 (down + closing). Projections, not guarantees.
Landlord ↔ Tenant lean methodology
- Overall (STATE)
- 15 Strongly Tenant-Friendly
- State New York
- 15 Strongly Tenant-Friendly · D+10
- County
- — inherits STATE
- City
- — inherits STATE
ZIP-level market 11944
- Home prices YoY
- -23.7%
- Active inventory
- 67
- Price-to-rent
- 9.1×
Monthly cashflow live
- Estimated rent
- $13,743 medium interval (Pro) →
- Mortgage (P&I)
- −$7,861
- Tax from tax record
- −$712 /mo · $8,538/yr
- Insurance
- −$625
- HOA
- −$0
- Vacancy / Maint / Mgmt
- −$2,886
- Net cashflow
- $1,660
Break-even live
UW: 25.0% down · 7.5% · 30yr · 1.5% tax · 5.0% vac · 8.0% maint · 8.0% mgmt
Financing live
Cash to close
- Down payment
- $374,750
- Closing costs
- $44,970
- Reserves months
- —
- Total cash needed
- —
Loan-product check · same deal, 3 products live
Conventional
25% down · 7.5% · 30yr
- Down + closing
- —
- Monthly P&I
- —
- Monthly cashflow
- —
- DSCR
- —
- Eligible?
- —
Personal DTI + credit; lowest rate.
DSCR
20% down · 8.5% · 30yr
- Down + closing
- —
- Monthly P&I
- —
- Monthly cashflow
- —
- DSCR
- —
- Eligible?
- —
No personal income docs; deal must DSCR.
Hard money
10% down · 12.0% · 12mo
- Down + closing
- —
- Monthly P&I
- —
- Monthly cashflow
- —
- DSCR
- —
- Eligible?
- —
Short-term bridge; refi at stabilization.
Rent comps 3 comps
| Address | Beds | Baths | Sqft | Rent | $/sqft | DOM | Units | Dist |
|---|---|---|---|---|---|---|---|---|
| 465 Tarpon Dr Southold, NY | 3.0 | 2.5 | 1572 | $20,000 | $12.72 | 24d | 1 | 0.59mi |
| 215 Leon Rd Southold, NY | 4.0 | 4.0 | 1800 | $6,000 | $3.33 | 43d | 1 | 1.17mi |
| 3650 Bay Shore Rd Greenport, NY | 3.0 | 3.0 | 2400 | $10,000 | $4.17 | 24d | 1 | 1.18mi |
Listing history 15 events
-
2026-06-18days on market $1,499,000 Active 205 DOM
-
2026-06-17days on market $1,499,000 Active 204 DOM
-
2026-06-16days on market $1,499,000 Active 203 DOM
-
2026-06-15days on market $1,499,000 Active 202 DOM
-
2026-06-13days on market $1,499,000 Active 200 DOM
-
2026-06-12days on market $1,499,000 Active 199 DOM
-
2026-06-09days on market $1,499,000 Active 196 DOM
-
2026-06-08days on market $1,499,000 Active 195 DOM
-
2026-06-07days on market $1,499,000 Active 194 DOM
-
2026-06-05days on market $1,499,000 Active 192 DOM
-
2026-06-04days on market $1,499,000 Active 190 DOM
-
2026-06-02days on market $1,499,000 Active 189 DOM
-
2026-06-01days on market $1,499,000 Active 188 DOM
-
2026-05-31days on market $1,499,000 Active 187 DOM
-
2025-11-10$1,499,000 Active 989-char remark
Show marketing remark (989 chars)
Scenic and bucolic, this 3+ acre country farm is steeped in classic North Fork charm. The property features an authentic 1800s four-bedroom, one and a half bath, farmhouse, a 2+ car garage (1976) with a workshop, office and mechanics pit, and a 1985 barn equipped with three horse stalls and ample space for tractors. Additional structures include a cinderblock chicken coop and a pig sty, offering true farmstead character. A large, established two thirds of an acre vegetable garden and an active farm stand highlight the property’s agricultural potential, while the watering hole rises and falls with the rains. This less than one-mile pastoral Greenport lane has over 130 acres of preserve land with another 50 plus acres of land on this lane soon to be preserved. Whether you choose to reimagine, repurpose, or simply enjoy this unique homestead as it is, the possibilities are abundant. A memorable bay beach just under one mile away. Please do not walk the grounds unattended.
ⓘ Source: listings_history table (triggers on properties + properties_extension) + one-shot
backfill from property_details.listing_events for pre-trigger history.
Tax reassessment forecast NY · Partial reset (capped growth)
- Current annual tax
- $8,538 · $712/mo
- Projected year-2 tax
- $16,936 · $1,411/mo
- Expected delta
- +$8,397/yr (+$700/mo · 98.3%)
ⓘ Screening estimate from a state-policy table — verify with the county assessor before closing.
Climate risk First Street
- Flood 6/10 Major FEMA zone X (shaded) · 55% chance over 30 yrs
- Wildfire 1/10 Low
- Heat 5/10 Major 7 d/yr ≥90°F today · 20 d/yr by 30 yrs out
- Wind 8/10 Severe 80% chance of damaging wind over 30 yrs
- Air quality 3/10 Moderate 3 unhealthy d/yr today · 4 by 30 yrs out
Nearby sold comps map
Loading sold comps map…
Walkable amenities ~0.75 mi
Loading nearby amenities…
Taxation est. · year 1
- Rental income
- $164,916
- − Mortgage interest
- −$83,967
- − Property taxes
- −$8,538
- − Insurance
- −$7,495
- − Repairs & maintenance
- −$13,193
- − Management
- −$13,193
- − Depreciation
- −$43,607
- Taxable loss
- −$5,078
- Est. tax savings @ 24.0%
- +$1,219
- After-tax cash flow
- $21,138/yr
For passive investors: Depreciation is non-cash, so a rental often shows a tax loss while cash-flowing — sheltering income. Rental losses are passive: they offset passive income freely, and up to $25,000/yr can offset ordinary (W-2) income if you actively participate and your MAGI is under $100k (phasing out to $0 by $150k); unused losses carry forward. On sale, claimed depreciation is recaptured at up to 25%, and gains may owe capital-gains tax (a 1031 exchange can defer both). Figures are a year-1 estimate at your 24.0% rate — not tax advice; consult a CPA.
Schools (NCES district)
- District
- Greenport Union Free School District
- NCES district ID
- 3612840
- Math proficiency
- 55% ▲ 5.00%
- Reading proficiency
- 45% ▼ -5.00%
- Median HH income
- $54,490
- Composite
- 45.25/100
- National rank
- #5759
- State rank
- #450 of 755 in NY
Livability — Greenport West
- Score
- 58/100
- State rank
- #1073
- US rank
- #21520
Category grades
Schools grade is shown separately in the Schools card above.
Census & demographics
- Census place
- Greenport West, NY
- Population (ZIP)
- 4,744
Population outlook (Suffolk County) Hauer SSP2
- Today (2025)
- 1,505,262 people
- By 2030
- 1,498,318 · -0.5%
- By 2040
- 1,471,101 · -2.3%
- By 2050
- 1,424,848 · -5.3%
- By 2075
- 1,337,157 · -11.2%
- By 2100
- 1,217,720 · -19.1%
Race, ethnicity, and origin ACS 2023
- Neighborhood character
- Predominantly White (69%)
- Race & ethnicity
- White 69% Hispanic / Latino 23% Two or more races 6% Black 4% Asian 2%
- Hispanic origin (detail)
- Mexican 5% Puerto Rican 2%
- Common ancestry
- Romanian 6% Lithuanian 2% Subsaharan African 2%
- Foreign-born
- 19% · Canada, China
- Languages at home
- 69% English-only · Spanish 22% German/W. Germanic 3% Russian/Polish/Slavic 2%
Political lean MEDSL · Suffolk
- 2024 margin
- Lean R (+10.0) · D 45.0% · R 55.0%
- 2008→2024 swing
- -16.0pp toward R · 2008: 6.0pp · 2024: -10.0pp
- All cycles
- 2024: R+10.0 2020: R+0.0 2016: R+8.2 2012: D+2.9 2008: D+6.0
Not yet ingested
- Civics
- —
Market trends
- HPI YoY
- ▼ -143.97%
- Current HPI
- 462.3431
- Rent YoY
- —
- Metro
- —
- State GDP YoY
- ▲ 2.60%
- F500 in state
- 92
Industry mix (Fortune 500 HQ in NY)
| Industry | F500 HQs | Revenue |
|---|---|---|
| Financial Services | 10 | $950B |
|
||
| Consumer Goods | 9 | $162B |
|
||
| Insurance | 4 | $225B |
|
||
| Telecommunications | 2 | $144B |
|
||
| Pharmaceuticals | 2 | $112B |
|
||
| Media / Entertainment | 2 | $69B |
|
||
Price history
1 event — show timeline
- 2025-11-10 Listed $1,499,000 OneKey® MLS as Distributed by MLS Grid
Property tax history
+3.5%/yrLatest (2025): $8,538 · +0.0% YoY. Source: county tax records.
Cash-flow waterfall
monthlySold comps — $/sqft
last 12 mo · ≤1 miLoading sold comps…