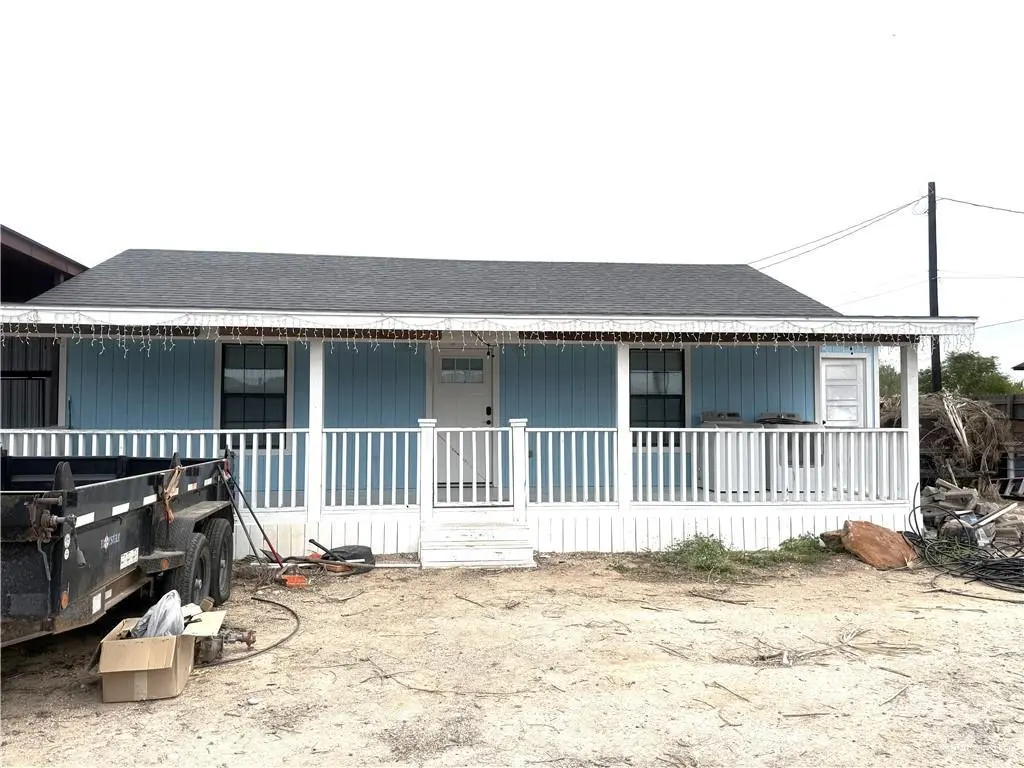
600 New Mexico St · Alton, TX
Flood risk 1/10 · Minimal
- FEMA flood zone
- X
- Chance of flooding over 30 yrs
- 0.0%
- Est. flood insurance / yr
- $507 – $1,088
Fire risk 4/10 · Minor
- Est. fire insurance / yr
- $1,222 – $2,270
Heat risk 9/10 · Severe
- Hot days now (above 111°F)
- 7 days/yr
- Hot days in 30 yrs
- 20 days/yr
Wind risk 8/10 · Major
- Chance of severe wind over 30 yrs
- 99.0%
Air-quality risk 2/10 · Minimal
- Unhealthy air days now
- 0 days/yr
- Unhealthy air days in 30 yrs
- 1 days/yr
Risk factors via First Street. Map © Google.
Why this score? — see what drove the D grade
The composite is a weighted blend of 9 inputs, each scored 0–100. Each bar is that input's sub-score; the figure is the points it added to the 100-point composite (weight × sub-score).
- Cash flow +11.8/30.0
- Appreciation +10.0/10.0
- 1% rule +4.3/10.0
- ARV discount +4.2/15.0
- DSCR +3.5/10.0
- Rent growth +3.1/5.0
- Livability +2.9/5.0
- Condition / age +2.5/5.0
- Schools +1.7/10.0
$120,000
🖨 Deal sheet (PDF) 📄 Offer letter ✓ Due diligence
Listing remarks MLS
*Motivated seller ready to make a deal happen! BRING YOUR OFFER! Take a look at this unique home, offering 2 bedrooms with 1 full bath plus an outdoor half-bathroom. The property offers an ample kitchen, living area, and bedroom. An 8-foot gated fence allows you privacy from the main road. A steel-framed covered workspace with 4 bays provides a great space for the outdoor projects. Don't wait to see this home. CALL TODAY!
Key facts
- Ample kitchen
- 8-foot gated fence
- Living area
Tags
Neighborhood map
What this means for you Summary
Snapshot
- This is a 3-bed/2.0-bath single-family listed at $120k.
Deal economics
- At list price, monthly cash flow is $-34 ($-403/yr) — negative.
- To cash-flow at today's rent, offer at most $114k (4.9% below list).
- To meet the 1% rule (rent ≥ 1% of price), the offer needs to be $111k (7.3% below list).
- Recommended offer: $106k (12.0% below list) — sets the bar for market timing.
- Cap rate 6.0% vs local median 2.5% in Alton — top-decile yield for the area; either an underpriced asset or a hidden risk that comps aren't pricing in. Stress-test before assuming the spread holds.
Location & tenants
- Location reads 58/100 on livability (#1,230 in TX) — a working-class tenant base; expect higher turnover. Strengths: cost of living A+, housing A; Watch: crime F, amenities F, commute F.
- Mission CISD (urban): math 15% / reading 28% proficiency, ranked #775 of 826 in TX (top 94%) — low school quality limits family demand, transient renter base, plan for 1-2y turnover; 78% free/reduced lunch — lower-income household profile, screen leases tightly.
- Zoned schools: Carl C Waitz El (math 8% / reading 22%, grade F, #4,021 of 4,322 statewide, top 94%, 396 students, 98% FRL); Alton Memorial J H (math 10% / reading 21%, grade F, #1,556 of 1,662 statewide, top 94%, 819 students, 91% FRL); Mission H S (math 18% / reading 28%, grade F, #1,348 of 1,632 statewide, top 83%, 2,218 students, 91% FRL) — zoned schools average 93% FRL vs 78% district-wide (15 pts higher); higher-poverty schools than district average — tighter screening recommended.
- Market conditions: Rents rising (+2.5%/yr); 625 active listings in the ZIP; 40 comparable units currently listed for rent nearby; rentals at typical pace (median 25d on market — plan ~3-4 weeks tenant-placement turnaround); 48% of comp listings sitting > 30 days — soft ceiling on asking rent; 7,378 units permitted in Hidalgo County in 2024 (641 in 5+ unit buildings).
Forward outlook
- In year one you build about $13k of equity ($830 loan paydown + $12k appreciation (10.0% local appreciation)).
- Hidalgo County population projected at +28% by 2050 — long-run rental-demand tailwind backs the buy-and-hold thesis.
- At projected returns (10.0% appreciation + 2.5% rent growth), your $34k cash investment doubles in ~3 years — after that, you're playing with house money.
- By year 3, paydown + projected appreciation supports a ~$32k cash-out refi (75% LTV) — recoverable capital for the next deal without selling this one.
Negotiation context
- It's been on market 159 days — a 12% lower offer ($106k) is reasonable based on typical stale-listing flexibility.
Risks & watch-outs
- Climate carrying-cost: severe wind risk, 99% chance of damaging wind over 30y; extreme-heat days projected 7→20/yr by 2055 (HVAC capex compounding) — expect insurance premiums to compound above CPI over the hold.
Questions for the listing agent
- What do current leases actually rent for vs. the listed asking? Can we see a recent rent roll and the last 12 months of T-12 income?
- It's been on market 159 days. Have you received any prior offers? Is the seller open to a 12% concession, seller financing, or rate buy-down credit?
- Why hasn't it sold? Are there any deal-killer items the seller is aware of (foundation, flood, title, zoning, code violations)?
- Is there a deadline driving the sale (1031 exchange, divorce, estate, relocation)? That informs how much negotiation room exists.
- Schools are F-rated, which usually means shorter tenancies and higher turnover. Who's the typical renter profile here, and what's been the actual vacancy rate?
- Crime grade is F in this area — have there been break-ins, vandalism, or insurance claims at this property in the last 3 years? What carrier currently insures it and at what premium?
- The area grade is low — what's the realistic commute time and amenity access for the typical tenant pool here? Any planned neighborhood developments (good or bad) we should know about?
- What's the average days-on-market for RENTAL listings here right now (not sales)? A rising rental-DOM trend means longer vacancies and softer asking-rent achievability than the comps imply.
- What's the recent tenant-quality profile in this submarket — average credit score on applications, eviction rate, late-payment / NSF rate, and stable-employment percentage? A property-management company in the area should have these aggregated.
- How much new for-sale + rental construction is in the pipeline within 1–3 miles? Heavy new supply typically softens prices + rents 12–24 months out; constrained supply supports both.
Investment metrics
- 1% rule
- 0.93% ✗
- Cap rate
- 5.96%
- Cash-on-cash
- -1.20%
- DSCR
- 0.95
- GRM
- 9.0
CMA / ARV
- ARV (median comp)
- $111,814
- List price
- $120,000
- Delta
- 7.32%
- Verdict
- FAIR
- Comps
- 7 within 1.0 mi
Show comp detail 1 sale within ~0.75 mi
| Address | Dist | Beds/Ba | Sqft | Sold | Price | $/sf | Match |
|---|---|---|---|---|---|---|---|
| 418 Nora Ln | 0.44mi | 2/2.0 (-1) | 972 (+14%) | 5mo | $105,000 | $108 | 46 |
Match score weights: distance 35% · size 25% · config 20% · recency 20%. Top-matched comps best support the ARV.
Projected returns pro-forma
10.0% appreciation · 2.45% rent growth · sell at horizon
- IRR
- 23.2%
- Equity multiple
- 2.87×
- Total profit
- $62,671
- Equity at exit
- $108,106
- IRR
- 20.6%
- Equity multiple
- 6.51×
- Total profit
- $185,159
- Equity at exit
- $233,134
Cash invested: $33,600 (down + closing). Projections, not guarantees.
Landlord ↔ Tenant lean methodology
- Overall (STATE)
- 87 Strongly Landlord-Friendly
- State Texas
- 87 Strongly Landlord-Friendly · R+5
- County
- — inherits STATE
- City
- — inherits STATE
ZIP-level market 78573
- Home prices YoY
- 8.0%
- Rents YoY
- 2.5%
- Active inventory
- 625
- Price-to-rent
- 9.0×
Monthly cashflow live
- Estimated rent
- $1,112 high interval (Pro) →
- Mortgage (P&I)
- −$629
- Tax from tax record
- −$233 /mo · $2,795/yr
- Insurance
- −$50
- HOA
- −$0
- Vacancy / Maint / Mgmt
- −$234
- Net cashflow
- $-34
Break-even live
Sensitivity live
| Price | -10% $34 | -5% $0 | +0% $-34 | +5% $-68 | +10% $-102 |
|---|---|---|---|---|---|
| Rent | -10% $-121 | -5% $-78 | +0% $-34 | +5% $10 | +10% $54 |
| Rate | -1.0pp $27 | -0.5pp $-3 | base $-34 | +0.5pp $-65 | +1.0pp $-96 |
UW: 25.0% down · 7.5% · 30yr · 1.5% tax · 5.0% vac · 8.0% maint · 8.0% mgmt
Financing live
Cash to close
- Down payment
- $30,000
- Closing costs
- $3,600
- Reserves months
- —
- Total cash needed
- —
Loan-product check · same deal, 3 products live
Conventional
25% down · 7.5% · 30yr
- Down + closing
- —
- Monthly P&I
- —
- Monthly cashflow
- —
- DSCR
- —
- Eligible?
- —
Personal DTI + credit; lowest rate.
DSCR
20% down · 8.5% · 30yr
- Down + closing
- —
- Monthly P&I
- —
- Monthly cashflow
- —
- DSCR
- —
- Eligible?
- —
No personal income docs; deal must DSCR.
Hard money
10% down · 12.0% · 12mo
- Down + closing
- —
- Monthly P&I
- —
- Monthly cashflow
- —
- DSCR
- —
- Eligible?
- —
Short-term bridge; refi at stabilization.
Rent comps 40 comps
| Address | Beds | Baths | Sqft | Rent | $/sqft | DOM | Units | Dist |
|---|---|---|---|---|---|---|---|---|
| 1410 S Michigan St Unit 4 Alton, TX | 3.0 | 2.0 | 1054 | $1,175 | $1.11 | 45d | 1 | 0.43mi |
| 1409 S Michigan St Unit 1/3 Alton, TX | 2.0 | 2.0 | 1005 | $1,175 | $1.17 | 21d | 1 | 0.55mi |
| 1409 S Michigan St Unit 1 Alton, TX | 2.0 | 2.0 | 1100 | $1,175 | $1.07 | 16d | 1 | 0.55mi |
| 1503 W Saint Francis Ave Unit 3 Alton, TX | 2.0 | 2.0 | 950 | $885 | $0.93 | 25d | 1 | 0.66mi |
| 1503 W Saint Francis Ave Apt 10 Alton, TX | 2.0 | 2.0 | 950 | $875 | $0.92 | 45d | 1 | 0.66mi |
| 1302 W Harrison Ave Unit 1 Alton, TX | 2.0 | 2.0 | 1050 | $890 | $0.85 | 45d | 1 | 0.72mi |
| 1310 W Harrison Ave Unit 3 Alton, TX | 3.0 | 2.0 | 1050 | $1,325 | $1.26 | 25d | 1 | 0.73mi |
| 1310 W Harrison Ave Unit 2 Alton, TX | 3.0 | 2.0 | 1050 | $1,325 | $1.26 | 45d | 1 | 0.73mi |
| 809 S Michigan St Unit 4 Alton, TX | 2.0 | 1.5 | 1000 | $875 | $0.88 | 45d | 1 | 0.75mi |
| 825 S Mississippi St Unit C Alton, TX | 2.0 | 2.0 | 912 | $800 | $0.88 | 21d | 1 | 0.77mi |
| 818 S Missouri St Unit 2 Alton, TX | 2.0 | 2.0 | 869 | $960 | $1.10 | 45d | 1 | 0.80mi |
| 1309 W Garfield Ave Unit 3 Alton, TX | 2.0 | 2.0 | 957 | $900 | $0.94 | 25d | 1 | 0.80mi |
| 1428 W Harrison Ave Unit 3 Alton, TX | 2.0 | 2.0 | 1000 | $975 | $0.97 | 25d | 1 | 0.82mi |
| 810 S Missouri St Apt 2 Alton, TX | 2.0 | 2.0 | 990 | $925 | $0.93 | 23d | 1 | 0.82mi |
| 1327 W Garfield Ave Unit 3 Alton, TX | 2.0 | 2.0 | 995 | $925 | $0.93 | 25d | 1 | 0.82mi |
| 1421 W Harrison Ave Unit 6 Alton, TX | 3.0 | 2.0 | 1008 | $750 | $0.74 | 25d | 1 | 0.82mi |
| 1327 W Garfield Ave Unit 2 Alton, TX | 2.0 | 2.0 | 900 | $1,000 | $1.11 | 16d | 1 | 0.83mi |
| 1421 W Harrison Ave Alton, TX | 3.0 | 2.0 | 1008 | $925 | $0.92 | 45d | 1 | 0.83mi |
| 1421 W Harrison Ave Alton, TX | 3.0 | 2.0 | 1008 | $750 | $0.74 | 21d | 1 | 0.83mi |
| 1429 W Harrison Ave Unit 3 Alton, TX | 2.0 | 1.0 | 562 | $900 | $1.60 | 25d | 1 | 0.84mi |
| 2708 W Harrison Ave Unit 3 Alton, TX | 2.0 | 2.0 | 908 | $1,075 | $1.18 | 25d | 1 | 0.99mi |
| 2816 W Harrison Ave Unit 1 Alton, TX | 2.0 | 2.0 | 908 | $1,075 | $1.18 | 45d | 1 | 0.99mi |
| 2904 W Harrison Ave Apt 3 Alton, TX | 2.0 | 2.0 | 908 | $1,075 | $1.18 | 45d | 1 | 0.99mi |
| 2708 W Harrison Ave Unit 4 Alton, TX | 3.0 | 2.0 | 1118 | $1,225 | $1.10 | 25d | 1 | 0.99mi |
| 2704 W Harrison Ave Unit 2 Alton, TX | 3.0 | 2.0 | 1119 | $1,225 | $1.09 | 25d | 1 | 0.99mi |
| 2712 W Harrison Ave Unit 4 Alton, TX | 3.0 | 2.0 | 1118 | $1,225 | $1.10 | 45d | 1 | 0.99mi |
| 2704 W Harrison Ave Unit 3 Alton, TX | 2.0 | 2.0 | 908 | $1,075 | $1.18 | 25d | 1 | 0.99mi |
| 2816 W Harrison Ave Apt 3 Alton, TX | 2.0 | 2.0 | 908 | $1,075 | $1.18 | 25d | 1 | 0.99mi |
| 2612 W Harrison Ave Apt 3 Alton, TX | 2.0 | 2.0 | 908 | $1,075 | $1.18 | 45d | 1 | 0.99mi |
| 2808 W Harrison Ave Unit 1 Alton, TX | 2.0 | 2.0 | 908 | $1,075 | $1.18 | 45d | 1 | 0.99mi |
| 2904 W Harrison Ave Apt 2 Alton, TX | 3.0 | 2.0 | 1118 | $1,225 | $1.10 | 45d | 1 | 0.99mi |
| 2812 W Harrison Ave Unit 3 Alton, TX | 2.0 | 2.0 | 908 | $1,075 | $1.18 | 45d | 1 | 0.99mi |
| 2712 W Harrison Ave Unit 3 Alton, TX | 2.0 | 2.0 | 908 | $1,075 | $1.18 | 45d | 1 | 0.99mi |
| 2809 W Harrison Ave Apt 1 Alton, TX | 2.0 | 2.0 | 908 | $1,075 | $1.18 | 45d | 1 | 1.01mi |
| 2805 W Harrison Ave Apt 2 Alton, TX | 3.0 | 2.0 | 1118 | $1,225 | $1.10 | 45d | 1 | 1.01mi |
| 2809 W Harrison Ave Apt 3 Alton, TX | 2.0 | 2.0 | 908 | $1,075 | $1.18 | 25d | 1 | 1.01mi |
| 2809 W Harrison Ave Unit 2 Alton, TX | 3.0 | 2.0 | 1118 | $1,225 | $1.10 | 45d | 1 | 1.01mi |
| 2813 W Harrison Ave Apt 1 Alton, TX | 2.0 | 2.0 | 908 | $1,075 | $1.18 | 45d | 1 | 1.01mi |
| 2813 W Harrison Ave Apt 2 Alton, TX | 3.0 | 2.0 | 1118 | $1,225 | $1.10 | 25d | 1 | 1.01mi |
| 2805 W Harrison Ave Apt 2 Alton, TX | 3.0 | 2.0 | 1118 | $1,225 | $1.10 | 25d | 1 | 1.01mi |
Listing history 18 events
-
2026-06-21days on market $120,000 Active 159 DOM
-
2026-06-18days on market $120,000 Active 156 DOM
-
2026-06-17days on market $120,000 Active 155 DOM
-
2026-06-16days on market $120,000 Active 154 DOM
-
2026-06-15days on market $120,000 Active 153 DOM
-
2026-06-14days on market $120,000 Active 151 DOM
-
2026-06-10days on market $120,000 Active 148 DOM
-
2026-06-09days on market $120,000 Active 147 DOM
-
2026-06-08days on market $120,000 Active 146 DOM
-
2026-06-07days on market $120,000 Active 145 DOM
-
2026-06-03days on market $120,000 Active 141 DOM
-
2026-06-02days on market $120,000 Active 140 DOM
-
2026-06-01days on market $120,000 Active 139 DOM
-
2026-05-31days on market $120,000 Active 138 DOM
-
2026-05-31days on market $120,000 Active 137 DOM
-
2026-03-11price $120,000 429-char remark
Show marketing remark (429 chars)
*Motivated seller ready to make a deal happen! BRING YOUR OFFER! Take a look at this unique home, offering 2 bedrooms with 1 full bath plus an outdoor half-bathroom. The property offers an ample kitchen, living area, and bedroom. An 8-foot gated fence allows you privacy from the main road. A steel-framed covered workspace with 4 bays provides a great space for the outdoor projects. Don't wait to see this home. CALL TODAY!
-
2026-01-13$125,000 Active 429-char remark
Show marketing remark (429 chars)
*Motivated seller ready to make a deal happen! BRING YOUR OFFER! Take a look at this unique home, offering 2 bedrooms with 1 full bath plus an outdoor half-bathroom. The property offers an ample kitchen, living area, and bedroom. An 8-foot gated fence allows you privacy from the main road. A steel-framed covered workspace with 4 bays provides a great space for the outdoor projects. Don't wait to see this home. CALL TODAY!
-
2025-09-17soldstatus
ⓘ Source: listings_history table (triggers on properties + properties_extension) + one-shot
backfill from property_details.listing_events for pre-trigger history.
Tax reassessment forecast TX · Resets to sale price
- Current annual tax
- $2,795 · $233/mo
- Projected year-2 tax
- $2,795 · $233/mo
- Expected delta
- $0/yr ($0/mo · 0.0%)
ⓘ Screening estimate from a state-policy table — verify with the county assessor before closing.
Climate risk First Street
- Flood 1/10 Low FEMA zone X · 0% chance over 30 yrs
- Wildfire 4/10 Moderate
- Heat 9/10 Extreme 7 d/yr ≥111°F today · 20 d/yr by 30 yrs out
- Wind 8/10 Severe 99% chance of damaging wind over 30 yrs
- Air quality 2/10 Low 0 unhealthy d/yr today · 1 by 30 yrs out
Nearby sold comps map
Loading sold comps map…
Walkable amenities ~0.75 mi
Loading nearby amenities…
Taxation est. · year 1
- Rental income
- $13,346
- − Mortgage interest
- −$6,722
- − Property taxes
- −$2,795
- − Insurance
- −$600
- − Repairs & maintenance
- −$1,068
- − Management
- −$1,068
- − Depreciation
- −$3,491
- Taxable loss
- −$2,397
- Est. tax savings @ 24.0%
- +$575
- After-tax cash flow
- $172/yr
For passive investors: Depreciation is non-cash, so a rental often shows a tax loss while cash-flowing — sheltering income. Rental losses are passive: they offset passive income freely, and up to $25,000/yr can offset ordinary (W-2) income if you actively participate and your MAGI is under $100k (phasing out to $0 by $150k); unused losses carry forward. On sale, claimed depreciation is recaptured at up to 25%, and gains may owe capital-gains tax (a 1031 exchange can defer both). Figures are a year-1 estimate at your 24.0% rate — not tax advice; consult a CPA.
Schools (NCES district)
- District
- Mission CISD
- NCES district ID
- 4831040
- Math proficiency
- 15% ▼ -35.00%
- Reading proficiency
- 28% ▼ -15.00%
- Median HH income
- $32,855
- Composite
- 17.47/100
- National rank
- #9061
- State rank
- #775 of 826 in TX
Livability — Alton
- Score
- 58/100
- State rank
- #1230
- US rank
- #21479
Category grades
Schools grade is shown separately in the Schools card above.
Census & demographics
- County
- Hidalgo County · 623,128 people
- City population
- 44,809
- Metro
- McAllen-Edinburg-Mission, TX
- Population (ZIP)
- 44,809
- Household income
- $55,000
- Rent vs Own
- Severe rent burden
- 855.0
Population outlook (Hidalgo County) Hauer SSP2
- Today (2025)
- 955,232 people
- By 2030
- 1,009,774 · +5.7%
- By 2040
- 1,120,332 · +17.3%
- By 2050
- 1,225,036 · +28.2%
- By 2075
- 1,439,189 · +50.7%
- By 2100
- 1,533,429 · +60.5%
Race, ethnicity, and origin ACS 2023
- Neighborhood character
- Predominantly Hispanic (96%)
- Race & ethnicity
- Hispanic / Latino 96% Two or more races 63% White 3%
- Hispanic origin (detail)
- Mexican 94%
- Foreign-born
- 28% · Canada
- Languages at home
- 12% English-only · Spanish 88%
Political lean MEDSL · Hidalgo
- 2024 margin
- Toss-up / Even · D 48.1% · R 51.0%
- 2008→2024 swing
- -41.6pp toward R · 2008: 38.7pp · 2024: -2.9pp
- All cycles
- 2024: R+2.9 2020: D+17.1 2016: D+40.5 2012: D+41.8 2008: D+38.7
Not yet ingested
- Civics
- —
Market trends
- HPI YoY
- ▲ 17.95%
- Current HPI
- 242.0711
- Rent YoY
- ▲ 2.45%
- Metro
- McAllen-Edinburg-Mission, TX
- State GDP YoY
- ▲ 3.95%
- F500 in state
- 110
Industry mix (Fortune 500 HQ in TX)
| Industry | F500 HQs | Revenue |
|---|---|---|
| Energy | 16 | $1,198B |
|
||
| Technology | 5 | $198B |
|
||
| Engineering / Construction | 4 | $72B |
|
||
| Energy Services | 3 | $60B |
|
||
| Utilities | 3 | $41B |
|
||
| Healthcare | 2 | $330B |
|
||
Price history
-4.0% since first listed3 events — show timeline
- 2026-03-11 Price Changed $120,000 MCALLENMLS
- 2026-01-13 Listed $125,000 MCALLENMLS
- 2025-09-17 Sold (Public Records) — Public Records
Property tax history
+15.1%/yrLatest (2025): $2,795 · +20.0% YoY. Source: county tax records.
Cash-flow waterfall
monthlySold comps — $/sqft
last 12 mo · ≤1 miLoading sold comps…