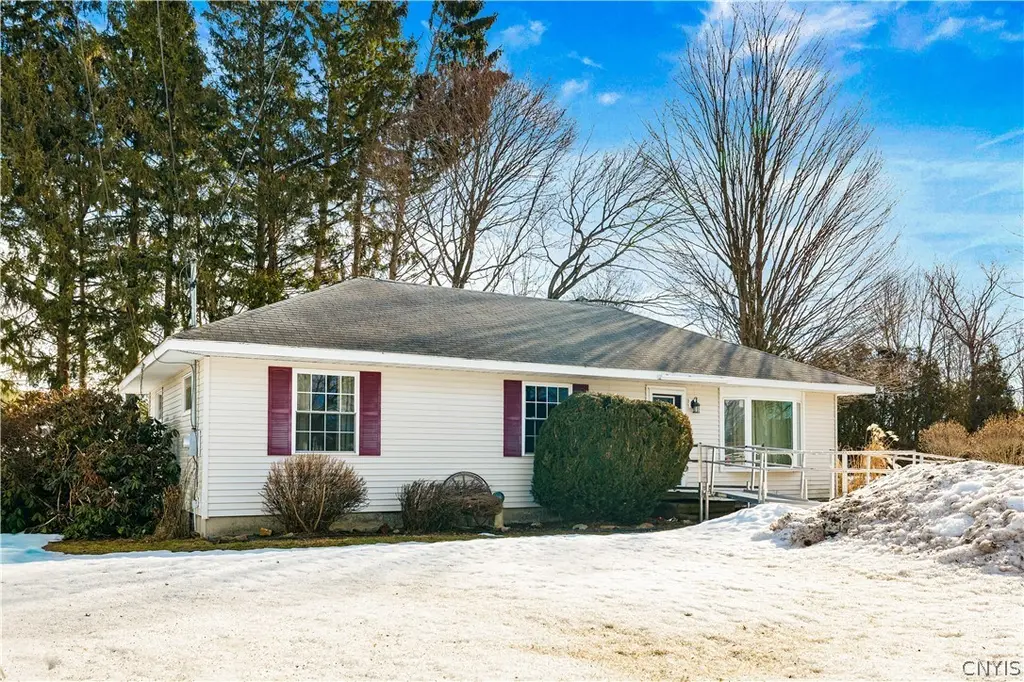
8094 Buena Vista Dr · Rome, NY
Flood risk 1/10 · Minimal
- FEMA flood zone
- X (unshaded)
- Chance of flooding over 30 yrs
- 0.0%
- Est. flood insurance / yr
- $473 – $860
Fire risk 1/10 · Minimal
- Est. fire insurance / yr
- $691 – $1,283
Heat risk 3/10 · Minor
- Hot days now (above 94°F)
- 7 days/yr
- Hot days in 30 yrs
- 16 days/yr
Wind risk 1/10 · Minimal
- Chance of severe wind over 30 yrs
- 1.0%
Air-quality risk 2/10 · Minimal
- Unhealthy air days now
- 0 days/yr
- Unhealthy air days in 30 yrs
- 1 days/yr
Risk factors via First Street. Map © Google.
Why this score? — see what drove the B+ grade
The composite is a weighted blend of 9 inputs, each scored 0–100. Each bar is that input's sub-score; the figure is the points it added to the 100-point composite (weight × sub-score).
- Cash flow +30.0/30.0
- ARV discount +15.0/15.0
- DSCR +10.0/10.0
- 1% rule +9.8/10.0
- Schools +3.5/10.0
- Livability +3.2/5.0
- Rent growth +2.5/5.0
- Condition / age +2.5/5.0
- Appreciation +0.0/10.0
$134,900
🖨 Deal sheet 📄 Offer letter ✓ Due diligence
Listing remarks MLS
3 Bedroom, 1 bath ranch in a nice, quiet Rome neighborhood. This Home is Structurally sound, Vinyl sided and looks great on the outside. The inside needs all new flooring ( currently sub flooring ), new paint throughout and new Kitchen. Handicap ramp conveys. Homes in this area have sold for over $220,000. Do some work and save some money !!
Key facts
- 7,841 sq ft lot
- Built 1954
- Listed 84 days
Neighborhood map
What this means for you Summary
Snapshot
- This is a 3-bed/1.0-bath single-family listed at $135k.
Deal economics
- At list price, monthly cash flow is $592 ($7k/yr) — positive.
- The deal already cash-flows at list — no discount required.
- Meets the 1% rule at list price ($2k rent vs $135k).
- Recommended offer: $127k (6.0% below list) — sets the bar for market timing.
- Cap rate 11.6% vs local median 5.6% in Rome — top-decile yield for the area; either an underpriced asset or a hidden risk that comps aren't pricing in. Stress-test before assuming the spread holds.
Location & tenants
- Location reads 64/100 on livability (#722 in NY) — a middle-class / working-renter tenant base. Strengths: cost of living A+, housing A+; Watch: health & safety C-, schools F, amenities F.
- Rome City School District (town): math 35% / reading 46% proficiency, ranked #516 of 590 in NY (top 88%) — families likely to look elsewhere, expect single-tenant / working-renter base with shorter leases.
- Market conditions: 272 active listings in the ZIP; 2 comparable units currently listed for rent nearby; 204 units permitted in Oneida County in 2024 (68 in 5+ unit buildings).
Forward outlook
- Local home prices are declining (-3.0%/yr); year-one equity from $933 of loan paydown is wiped out by about $4k of value loss. Plan a longer hold.
- Oneida County population projected at -12% by 2050 — secular population decline; favor cash flow + early exit over multi-decade hold.
- At projected returns (-3.0% appreciation + 3.0% rent growth), your $38k cash investment doubles in ~7 years — after that, you're playing with house money.
Negotiation context
- It's been on market 84 days — a 6% lower offer ($127k) is reasonable based on typical stale-listing flexibility.
- 2 sale attempts; this cycle's ask has dropped $14k (9%) from the opening price — seller is motivated, your offer sets the floor, not the list.
Risks & watch-outs
- Watch-outs: built in 1954 — expect roof / HVAC / electrical / plumbing capex.
Questions for the listing agent
- It's been on market 84 days. Have you received any prior offers? Is the seller open to a 6% concession, seller financing, or rate buy-down credit?
- Built in 1954 — when were the roof, HVAC, electrical panel, plumbing, and water heater last replaced?
- Why hasn't it sold? Are there any deal-killer items the seller is aware of (foundation, flood, title, zoning, code violations)?
- Is there a deadline driving the sale (1031 exchange, divorce, estate, relocation)? That informs how much negotiation room exists.
- Schools are F-rated, which usually means shorter tenancies and higher turnover. Who's the typical renter profile here, and what's been the actual vacancy rate?
- What's the average days-on-market for RENTAL listings here right now (not sales)? A rising rental-DOM trend means longer vacancies and softer asking-rent achievability than the comps imply.
- What's the recent tenant-quality profile in this submarket — average credit score on applications, eviction rate, late-payment / NSF rate, and stable-employment percentage? A property-management company in the area should have these aggregated.
- How much new for-sale + rental construction is in the pipeline within 1–3 miles? Heavy new supply typically softens prices + rents 12–24 months out; constrained supply supports both.
Investment metrics
- 1% rule
- 1.48% ✓
- Cap rate
- 11.56%
- Cash-on-cash
- 18.82%
- DSCR
- 1.84
- GRM
- 5.6
CMA / ARV
- ARV (median comp)
- $218,063
- List price
- $134,900
- Delta
- -38.14%
- Verdict
- UNDERPRICED
- Comps
- 20 within 1.0 mi
Show comp detail 12 sales within ~0.75 mi
| Address | Dist | Beds/Ba | Sqft | Sold | Price | $/sf | Match |
|---|---|---|---|---|---|---|---|
| 6612 Bishopp Rd | 0.28mi | 3/1.0 | 1,144 (+1%) | 3mo | $215,000 | $188 | 82 |
| 8147 Coronado Ln | 0.22mi | 3/1.0 | 1,144 (+1%) | 6mo | $245,000 | $214 | 82 |
| 6651 Bishopp Rd | 0.10mi | 3/1.0 | 984 (-13%) | 1mo | $200,000 | $203 | 73 |
| 8137 Rome Westernville Rd | 0.25mi | 3/1.0 | 1,177 (+4%) | 13mo | $164,000 | $139 | 71 |
| 8102 Buena Vista Dr | 0.06mi | 3/2.0 | 1,248 (+11%) | 9mo | $269,900 | $216 | 68 |
| 109 Glen Rd S | 0.66mi | 3/1.0 | 1,114 (-1%) | 4mo | $218,000 | $196 | 64 |
| 111 Glen Rd S | 0.63mi | 3/2.0 | 1,132 (+0%) | 5mo | $186,000 | $164 | 61 |
| 8219 Elmer Hill Rd | 0.43mi | 3/1.0 | 1,040 (-8%) | 15mo | $236,250 | $227 | 55 |
| 8296 Northgate Dr | 0.66mi | 3/1.5 | 1,066 (-6%) | 6mo | $190,000 | $178 | 53 |
| 233 Dale Rd | 0.48mi | 3/1.5 | 1,073 (-5%) | 18mo | $208,500 | $194 | 52 |
| 215 Dale Rd | 0.58mi | 3/1.0 | 977 (-13%) | 8mo | $234,000 | $240 | 44 |
| 8275 Elmer Hill Rd | 0.63mi | 3/1.0 | 1,243 (+10%) | 15mo | $230,000 | $185 | 41 |
Match score weights: distance 35% · size 25% · config 20% · recency 20%. Top-matched comps best support the ARV.
Projected returns pro-forma
-3.0% appreciation · 3.0% rent growth · sell at horizon
- IRR
- 10.7%
- Equity multiple
- 1.42×
- Total profit
- $15,926
- Equity at exit
- $20,114
- IRR
- 19.7%
- Equity multiple
- 2.66×
- Total profit
- $62,701
- Equity at exit
- $11,664
Cash invested: $37,772 (down + closing). Projections, not guarantees.
Landlord ↔ Tenant lean methodology
- Overall (STATE)
- 15 Strongly Tenant-Friendly
- State New York
- 15 Strongly Tenant-Friendly · D+10
- County
- — inherits STATE
- City
- — inherits STATE
ZIP-level market 13440
- Home prices YoY
- -8.0%
- Active inventory
- 272
- Price-to-rent
- 5.6×
Monthly cashflow live
- Estimated rent
- $2,000 medium interval (Pro) →
- Mortgage (P&I)
- −$707
- Tax from tax record
- −$224 /mo · $2,689/yr
- Insurance
- −$56
- HOA
- −$0
- Vacancy / Maint / Mgmt
- −$420
- Net cashflow
- $592
Break-even live
UW: 25.0% down · 7.5% · 30yr · 1.5% tax · 5.0% vac · 8.0% maint · 8.0% mgmt
Financing live
Cash to close
- Down payment
- $33,725
- Closing costs
- $4,047
- Reserves months
- —
- Total cash needed
- —
Loan-product check · same deal, 3 products live
Conventional
25% down · 7.5% · 30yr
- Down + closing
- —
- Monthly P&I
- —
- Monthly cashflow
- —
- DSCR
- —
- Eligible?
- —
Personal DTI + credit; lowest rate.
DSCR
20% down · 8.5% · 30yr
- Down + closing
- —
- Monthly P&I
- —
- Monthly cashflow
- —
- DSCR
- —
- Eligible?
- —
No personal income docs; deal must DSCR.
Hard money
10% down · 12.0% · 12mo
- Down + closing
- —
- Monthly P&I
- —
- Monthly cashflow
- —
- DSCR
- —
- Eligible?
- —
Short-term bridge; refi at stabilization.
Rent comps 2 comps
| Address | Beds | Baths | Sqft | Rent | $/sqft | DOM | Units | Dist |
|---|---|---|---|---|---|---|---|---|
| 7805 Merrick Rd Unit 201 Rome, NY | 2.0 | 2.0 | 1200 | $2,000 | $1.67 | 43d | 1 | 1.24mi |
| 1611 Craig St Rome, NY | 3.0 | 1.0 | 1250 | $2,000 | $1.60 | 43d | 1 | 1.34mi |
Listing history 12 events
-
2026-06-09statusdays on market $134,900 Pending 84 DOM
-
2026-06-08days on market $134,900 Active 83 DOM
-
2026-06-07days on market $134,900 Active 82 DOM
-
2026-06-07days on market $134,900 Active 81 DOM
-
2026-06-04days on market $134,900 Active 78 DOM
-
2026-06-02days on market $134,900 Active 77 DOM
-
2026-06-01days on market $134,900 Active 76 DOM
-
2026-05-31days on market $134,900 Active 75 DOM
-
2026-05-05price $134,900 343-char remark
Show marketing remark (343 chars)
3 Bedroom, 1 bath ranch in a nice, quiet Rome neighborhood. This Home is Structurally sound, Vinyl sided and looks great on the outside. The inside needs all new flooring ( currently sub flooring ), new paint throughout and new Kitchen. Handicap ramp conveys. Homes in this area have sold for over $220,000. Do some work and save some money !!
-
2026-04-09status Active 343-char remark
Show marketing remark (343 chars)
3 Bedroom, 1 bath ranch in a nice, quiet Rome neighborhood. This Home is Structurally sound, Vinyl sided and looks great on the outside. The inside needs all new flooring ( currently sub flooring ), new paint throughout and new Kitchen. Handicap ramp conveys. Homes in this area have sold for over $220,000. Do some work and save some money !!
-
2026-03-23historical Active Under Contract 343-char remark
Show marketing remark (343 chars)
3 Bedroom, 1 bath ranch in a nice, quiet Rome neighborhood. This Home is Structurally sound, Vinyl sided and looks great on the outside. The inside needs all new flooring ( currently sub flooring ), new paint throughout and new Kitchen. Handicap ramp conveys. Homes in this area have sold for over $220,000. Do some work and save some money !!
-
2026-03-17$149,000 Active 343-char remark
Show marketing remark (343 chars)
3 Bedroom, 1 bath ranch in a nice, quiet Rome neighborhood. This Home is Structurally sound, Vinyl sided and looks great on the outside. The inside needs all new flooring ( currently sub flooring ), new paint throughout and new Kitchen. Handicap ramp conveys. Homes in this area have sold for over $220,000. Do some work and save some money !!
ⓘ Source: listings_history table (triggers on properties + properties_extension) + one-shot
backfill from property_details.listing_events for pre-trigger history.
Tax reassessment forecast NY · Partial reset (capped growth)
- Current annual tax
- $2,689 · $224/mo
- Projected year-2 tax
- $2,689 · $224/mo
- Expected delta
- $0/yr ($0/mo · 0.0%)
ⓘ Screening estimate from a state-policy table — verify with the county assessor before closing.
Climate risk First Street
- Flood 1/10 Low FEMA zone X (unshaded) · 0% chance over 30 yrs
- Wildfire 1/10 Low
- Heat 3/10 Moderate 7 d/yr ≥94°F today · 16 d/yr by 30 yrs out
- Wind 1/10 Low 100% chance of damaging wind over 30 yrs
- Air quality 2/10 Low 0 unhealthy d/yr today · 1 by 30 yrs out
Nearby sold comps map
Loading sold comps map…
Walkable amenities ~0.75 mi
Loading nearby amenities…
Taxation est. · year 1
- Rental income
- $24,000
- − Mortgage interest
- −$7,556
- − Property taxes
- −$2,689
- − Insurance
- −$674
- − Repairs & maintenance
- −$1,920
- − Management
- −$1,920
- − Depreciation
- −$3,924
- Taxable income
- $5,315
- Est. tax owed @ 24.0%
- −$1,276
- After-tax cash flow
- $5,831/yr
For passive investors: Depreciation is non-cash, so a rental often shows a tax loss while cash-flowing — sheltering income. Rental losses are passive: they offset passive income freely, and up to $25,000/yr can offset ordinary (W-2) income if you actively participate and your MAGI is under $100k (phasing out to $0 by $150k); unused losses carry forward. On sale, claimed depreciation is recaptured at up to 25%, and gains may owe capital-gains tax (a 1031 exchange can defer both). Figures are a year-1 estimate at your 24.0% rate — not tax advice; consult a CPA.
Schools (NCES district)
- District
- Rome City School District
- NCES district ID
- 3624900
- Math proficiency
- 35% ▼ -4.00%
- Reading proficiency
- 46% ▲ 10.00%
- Median HH income
- $46,406
- Composite
- 34.52/100
- National rank
- #5178
- State rank
- #516 of 590 in NY
Livability — Rome
- Score
- 64/100
- State rank
- #722
- US rank
- #13676
Category grades
Schools grade is shown separately in the Schools card above.
Census & demographics
- Census place
- Rome, NY
- City population
- 41,418
- Population (ZIP)
- 41,273
Population outlook (Oneida County) Hauer SSP2
- Today (2025)
- 225,223 people
- By 2030
- 220,384 · -2.1%
- By 2040
- 209,071 · -7.2%
- By 2050
- 197,920 · -12.1%
- By 2075
- 175,541 · -22.1%
- By 2100
- 148,491 · -34.1%
Race, ethnicity, and origin ACS 2023
- Neighborhood character
- Predominantly White (82%)
- Race & ethnicity
- White 82% Hispanic / Latino 7% Two or more races 6% Black 4% Asian 1%
- Hispanic origin (detail)
- Mexican 1% Puerto Rican 4%
- Common ancestry
- Romanian 9% Lithuanian 4% Slovak 1%
- Foreign-born
- 3% · Canada, China
- Languages at home
- 94% English-only · Spanish 3% Other Indo-European 1%
Political lean MEDSL · Oneida
- 2024 margin
- Strong R (+21.3) · D 39.4% · R 60.6%
- 2008→2024 swing
- -15.2pp toward R · 2008: -6.1pp · 2024: -21.3pp
- All cycles
- 2024: R+21.3 2020: R+15.5 2016: R+21.1 2012: R+5.3 2008: R+6.1
Not yet ingested
- Civics
- —
Market trends
- HPI YoY
- ▼ -29.58%
- Current HPI
- 339.3589
- Rent YoY
- —
- Metro
- —
- State GDP YoY
- ▲ 2.60%
- F500 in state
- 92
Industry mix (Fortune 500 HQ in NY)
| Industry | F500 HQs | Revenue |
|---|---|---|
| Financial Services | 10 | $950B |
|
||
| Consumer Goods | 9 | $162B |
|
||
| Insurance | 4 | $225B |
|
||
| Telecommunications | 2 | $144B |
|
||
| Pharmaceuticals | 2 | $112B |
|
||
| Media / Entertainment | 2 | $69B |
|
||
Price history
-9.5% since first listed4 events — show timeline
- 2026-05-05 Price Changed $134,900 CNYIS
- 2026-04-09 Relisted — CNYIS
- 2026-03-23 Contingent — CNYIS
- 2026-03-17 Listed $149,000 CNYIS
Property tax history
+1.8%/yrLatest (2025): $2,689 · +0.2% YoY. Source: county tax records.
Cash-flow waterfall
monthlySold comps — $/sqft
last 12 mo · ≤1 miLoading sold comps…