14628 Norcross Pl · Horizon City, TX
Flood risk 1/10 · Minimal
- FEMA flood zone
- X
- Chance of flooding over 30 yrs
- 0.0%
- Est. flood insurance / yr
- $507 – $1,088
Fire risk 3/10 · Minor
- Est. fire insurance / yr
- $1,222 – $2,270
Heat risk 6/10 · Moderate
- Hot days now (above 100°F)
- 7 days/yr
- Hot days in 30 yrs
- 22 days/yr
Wind risk 1/10 · Minimal
- Chance of severe wind over 30 yrs
- —
Air-quality risk 3/10 · Minor
- Unhealthy air days now
- 2 days/yr
- Unhealthy air days in 30 yrs
- 2 days/yr
Risk factors via First Street. Map © Google.
Why this score? — see what drove the C- grade
The composite is a weighted blend of 9 inputs, each scored 0–100. Each bar is that input's sub-score; the figure is the points it added to the 100-point composite (weight × sub-score).
- Cash flow +22.2/30.0
- ARV discount +7.5/15.0
- DSCR +7.1/10.0
- 1% rule +4.7/10.0
- Livability +3.3/5.0
- Rent growth +3.2/5.0
- Condition / age +2.5/5.0
- Schools +1.5/10.0
- Appreciation +0.0/10.0
$199,000
🖨 Deal sheet (PDF) 📄 Offer letter ✓ Due diligence
Listing remarks
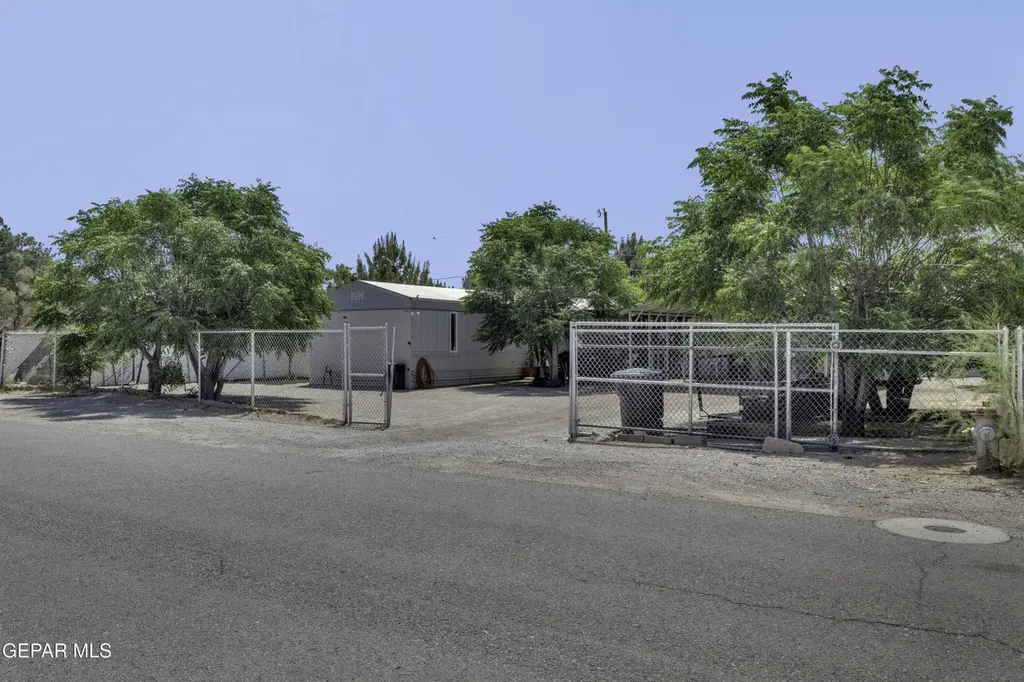
Unique opportunity in Horizon with flexibility, space, and endless potential! Situated on a spacious 10,000+ sq ft lot, this updated manufactured home offers a rare setup perfect for homeowners, entrepreneurs, or multi-generational living. The main home has been well-maintained and features updates, including an improved roof and comfortable living spaces ready for everyday enjoyment. What truly makes this property stand out are the detached bonus structures--one currently being used as a beauty salon, making it an ideal office, studio, workspace, or home business setup, plus a separate detached apartment with its own bathroom offering flexible use for guests, extended family, hobby space,
Key facts
- Ample outdoor space
- 0.23 acre lot
- Garage
Tags
Property features AI
Finance
- HOA & community: No HOA fees
Exterior
- Utilities: Septic tank
- Home design: Manufactured home
- Construction: Wood siding; Shingle roof; Mobile home dimensions approximately 16 ft x 76 ft; Building area about 1,216
- Exterior features: Covered patio/porch; Gazebo; Fenced yard; See remarks for additional exterior details
Interior
- Kitchen: Free-standing electric oven
- Flooring: Vinyl flooring; Carpet
- Bathrooms: 1 full bathroom; 1 half bathroom; 2 three-quarter bathrooms
- Heating & cooling: Forced air heating; Refrigerated cooling
- Interior features: Ceiling fans; Double pane windows; Detached in-law apartment (main level, ~20 x 40 ft)
Neighborhood map
What this means for you Summary
Snapshot
- This is a 4-bed/3.5-bath manufactured listed at $199k.
Deal economics
- At list price, monthly cash flow is $323 ($4k/yr) — positive.
- The deal already cash-flows at list — no discount required.
- To meet the 1% rule (rent ≥ 1% of price), the offer needs to be $193k (3.0% below list).
- Recommended offer: $193k (3.0% below list) — sets the bar for market timing.
Location & tenants
- Location reads 66/100 on livability (#619 in TX) — a middle-class / working-renter tenant base. Strengths: crime A+, cost of living A+, housing A+; Watch: employment D, amenities F, commute F.
- Clint ISD (suburban): math 14% / reading 22% proficiency, ranked #792 of 826 in TX (top 96%) — low school quality limits family demand, transient renter base, plan for 1-2y turnover.
- Zoned schools: Horizon Middle (math 16% / reading 20%, grade F, #1,491 of 1,662 statewide, top 91%, 670 students, 84% FRL); Horizon H S (math 14% / reading 26%, grade F, #1,397 of 1,632 statewide, top 87%, 1,677 students, 85% FRL) — zoned schools average 84% FRL vs 59% district-wide (25 pts higher); higher-poverty schools than district average — tighter screening recommended.
- Market conditions: Rents rising (+2.9%/yr); 2093 active listings in the ZIP; 8 comparable units currently listed for rent nearby; rentals leasing fast (median 12d on market — plan ~1-2 weeks tenant-placement turnaround); solid renter incomes; 2,196 units permitted in El Paso County in 2024 (143 in 5+ unit buildings).
- This rent runs 30% of the median local income ($77k/yr) — at the standard rent-burdened threshold; future hikes will face affordability resistance.
Forward outlook
- Local home prices are declining (-3.0%/yr); year-one equity from $1k of loan paydown is wiped out by about $6k of value loss. Plan a longer hold.
- El Paso County population projected at +10% by 2050 — modest demand growth; plan on rents tracking national, not racing it.
Negotiation context
- It's been on market 36 days — a 3% lower offer ($193k) is reasonable based on typical stale-listing flexibility.
- 2 sale attempts since 18y ago; this cycle's ask has dropped $21k (10%) from the opening price — seller is motivated, your offer sets the floor, not the list.
Risks & watch-outs
- Climate carrying-cost: extreme-heat days projected 7→22/yr by 2055 (HVAC capex compounding) — expect insurance premiums to compound above CPI over the hold.
Questions for the listing agent
- It's been on market 36 days. Have you received any prior offers? Is the seller open to a 3% concession, seller financing, or rate buy-down credit?
- Is there a deadline driving the sale (1031 exchange, divorce, estate, relocation)? That informs how much negotiation room exists.
- Schools are D-rated, which usually means shorter tenancies and higher turnover. Who's the typical renter profile here, and what's been the actual vacancy rate?
- What's the average days-on-market for RENTAL listings here right now (not sales)? A rising rental-DOM trend means longer vacancies and softer asking-rent achievability than the comps imply.
- What's the recent tenant-quality profile in this submarket — average credit score on applications, eviction rate, late-payment / NSF rate, and stable-employment percentage? A property-management company in the area should have these aggregated.
- How much new for-sale + rental construction is in the pipeline within 1–3 miles? Heavy new supply typically softens prices + rents 12–24 months out; constrained supply supports both.
Investment metrics
- 1% rule
- 0.97% ✗
- Cap rate
- 8.24%
- Cash-on-cash
- 6.95%
- DSCR
- 1.31
- GRM
- 8.6
CMA / ARV
No comps found within radius.
Projected returns pro-forma
-3.0% appreciation · 2.93% rent growth · sell at horizon
- IRR
- -5.8%
- Equity multiple
- 0.79×
- Total profit
- $-11,906
- Equity at exit
- $29,672
- IRR
- 3.8%
- Equity multiple
- 1.27×
- Total profit
- $15,229
- Equity at exit
- $17,206
Cash invested: $55,720 (down + closing). Projections, not guarantees.
Landlord ↔ Tenant lean methodology
- Overall (STATE)
- 87 Strongly Landlord-Friendly
- State Texas
- 87 Strongly Landlord-Friendly · R+5
- County
- — inherits STATE
- City
- — inherits STATE
ZIP-level market 79928
- Home prices YoY
- -16.9%
- Rents YoY
- 2.9%
- Active inventory
- 2093
- Price-to-rent
- 8.6×
Monthly cashflow live
- Estimated rent
- $1,931 high interval (Pro) →
- Mortgage (P&I)
- −$1,044
- Tax from tax record
- −$76 /mo · $917/yr
- Insurance
- −$83
- HOA
- −$0
- Vacancy / Maint / Mgmt
- −$406
- Net cashflow
- $323
Break-even live
Sensitivity live
| Price | -10% $435 | -5% $379 | +0% $323 | +5% $266 | +10% $210 |
|---|---|---|---|---|---|
| Rent | -10% $170 | -5% $246 | +0% $323 | +5% $399 | +10% $475 |
| Rate | -1.0pp $423 | -0.5pp $373 | base $323 | +0.5pp $271 | +1.0pp $219 |
UW: 25.0% down · 7.5% · 30yr · 1.5% tax · 5.0% vac · 8.0% maint · 8.0% mgmt
Financing live
Cash to close
- Down payment
- $49,750
- Closing costs
- $5,970
- Reserves months
- —
- Total cash needed
- —
Loan-product check · same deal, 3 products live
Conventional
25% down · 7.5% · 30yr
- Down + closing
- —
- Monthly P&I
- —
- Monthly cashflow
- —
- DSCR
- —
- Eligible?
- —
Personal DTI + credit; lowest rate.
DSCR
20% down · 8.5% · 30yr
- Down + closing
- —
- Monthly P&I
- —
- Monthly cashflow
- —
- DSCR
- —
- Eligible?
- —
No personal income docs; deal must DSCR.
Hard money
10% down · 12.0% · 12mo
- Down + closing
- —
- Monthly P&I
- —
- Monthly cashflow
- —
- DSCR
- —
- Eligible?
- —
Short-term bridge; refi at stabilization.
Rent comps 8 comps
| Address | Beds | Baths | Sqft | Rent | $/sqft | DOM | Units | Dist |
|---|---|---|---|---|---|---|---|---|
| 14624 Achim Dr El Paso, TX | 3.0 | 2.0 | 1422 | $1,500 | $1.05 | 11d | 1 | 0.48mi |
| 14608 Adonis Blue Ct El Paso, TX | 3.0 | 2.5 | 1350 | $1,650 | $1.22 | 11d | 1 | 0.53mi |
| 656 Orchid Dr Horizon City, TX | 3.0 | 2.0 | 1092 | $1,350 | $1.24 | 25d | 1 | 0.68mi |
| 14361 Star Cactus Ave Horizon City, TX | 3.0 | 2.0 | 1170 | $1,600 | $1.37 | 11d | 1 | 0.78mi |
| 14269 Escalera Dr El Paso, TX | 3.0 | 2.0 | 1269 | $1,850 | $1.46 | 4d | 1 | 0.79mi |
| 14333 Paraiso Dr El Paso, TX | 3.0 | 2.0 | 1224 | $2,000 | $1.63 | 4d | 1 | 0.82mi |
| 456 Von Bargen Dr Horizon City, TX | 3.0 | 2.0 | 1120 | $1,300 | $1.16 | 15d | 1 | 1.00mi |
| 14496 Cabana Dr Horizon City, TX | 3.0 | 2.0 | 1120 | $1,475 | $1.32 | 45d | 1 | 1.14mi |
Listing history 19 events
-
2026-06-19price $199,000 Active 36 DOM
-
2026-06-18days on market $200,000 Active 36 DOM
-
2026-06-17days on market $200,000 Active 35 DOM
-
2026-06-16days on market $200,000 Active 34 DOM
-
2026-06-15days on market $200,000 Active 33 DOM
-
2026-06-13pricedays on market $200,000 Active 31 DOM
-
2026-06-10days on market $205,000 Active 28 DOM
-
2026-06-09days on market $205,000 Active 27 DOM
-
2026-06-08pricedays on market $205,000 Active 26 DOM
-
2026-06-07days on market $220,000 Active 25 DOM
-
2026-06-03days on market $220,000 Active 21 DOM
-
2026-06-03days on market $220,000 Active 20 DOM
-
2026-06-01days on market $220,000 Active 19 DOM
-
2026-05-31days on market $220,000 Active 18 DOM
-
2026-05-08$220,000 Active 926-char remark
-
2014-02-11soldstatus
-
2010-09-23soldstatus
-
2008-11-14$30,000
-
2008-11-06soldstatus
ⓘ Source: listings_history table (triggers on properties + properties_extension) + one-shot
backfill from property_details.listing_events for pre-trigger history.
Tax reassessment forecast TX · Resets to sale price
- Current annual tax
- $917 · $76/mo
- Projected year-2 tax
- $3,642 · $303/mo
- Expected delta
- +$2,724/yr (+$227/mo · 296.9%)
ⓘ Screening estimate from a state-policy table — verify with the county assessor before closing.
Climate risk First Street
- Flood 1/10 Low FEMA zone X · 0% chance over 30 yrs
- Wildfire 3/10 Moderate
- Heat 6/10 Major 7 d/yr ≥100°F today · 22 d/yr by 30 yrs out
- Wind 1/10 Low
- Air quality 3/10 Moderate 2 unhealthy d/yr today · 2 by 30 yrs out
Nearby sold comps map
Loading sold comps map…
Walkable amenities ~0.75 mi
Loading nearby amenities…
Taxation est. · year 1
- Rental income
- $23,174
- − Mortgage interest
- −$11,147
- − Property taxes
- −$917
- − Insurance
- −$995
- − Repairs & maintenance
- −$1,854
- − Management
- −$1,854
- − Depreciation
- −$5,789
- Taxable income
- $618
- Est. tax owed @ 24.0%
- −$148
- After-tax cash flow
- $3,724/yr
For passive investors: Depreciation is non-cash, so a rental often shows a tax loss while cash-flowing — sheltering income. Rental losses are passive: they offset passive income freely, and up to $25,000/yr can offset ordinary (W-2) income if you actively participate and your MAGI is under $100k (phasing out to $0 by $150k); unused losses carry forward. On sale, claimed depreciation is recaptured at up to 25%, and gains may owe capital-gains tax (a 1031 exchange can defer both). Figures are a year-1 estimate at your 24.0% rate — not tax advice; consult a CPA.
Schools (NCES district)
- District
- Clint ISD
- NCES district ID
- 4814430
- Math proficiency
- 14% ▼ -32.00%
- Reading proficiency
- 22% ▼ -15.00%
- Median HH income
- $37,490
- Composite
- 15.03/100
- National rank
- #9356
- State rank
- #792 of 826 in TX
Livability — Horizon City
- Score
- 66/100
- State rank
- #619
- US rank
- #11815
Category grades
Schools grade is shown separately in the Schools card above.
Census & demographics
- County
- El Paso County · 761,266 people
- City population
- 86,599
- Metro
- El Paso, TX
- Population (ZIP)
- 86,599
- Household income
- $76,643
- Rent vs Own
- Severe rent burden
- 838.0
Population outlook (El Paso County) Hauer SSP2
- Today (2025)
- 897,899 people
- By 2030
- 922,694 · +2.8%
- By 2040
- 960,492 · +7.0%
- By 2050
- 982,919 · +9.5%
- By 2075
- 997,266 · +11.1%
- By 2100
- 900,630 · +0.3%
Race, ethnicity, and origin ACS 2023
- Neighborhood character
- Predominantly Hispanic (89%)
- Race & ethnicity
- Hispanic / Latino 89% Two or more races 39% White 7% Black 2% Native American 2%
- Hispanic origin (detail)
- Mexican 84%
- Foreign-born
- 23% · Canada
- Languages at home
- 25% English-only · Spanish 74% Other Asian/Pacific 1%
Political lean MEDSL · El Paso
- 2024 margin
- D (+15.1) · D 57.0% · R 41.8% · Other 1.2%
- 2008→2024 swing
- -17.4pp toward R · 2008: 32.5pp · 2024: 15.1pp
- All cycles
- 2024: D+15.1 2020: D+35.1 2016: D+43.2 2012: D+32.6 2008: D+32.5
Not yet ingested
- Civics
- —
Market trends
- HPI YoY
- ▼ -40.72%
- Current HPI
- 200.6454
- Rent YoY
- ▲ 2.93%
- Metro
- El Paso, TX
- State GDP YoY
- ▲ 3.95%
- F500 in state
- 110
Industry mix (Fortune 500 HQ in TX)
| Industry | F500 HQs | Revenue |
|---|---|---|
| Energy | 16 | $1,198B |
|
||
| Technology | 5 | $198B |
|
||
| Engineering / Construction | 4 | $72B |
|
||
| Energy Services | 3 | $60B |
|
||
| Utilities | 3 | $41B |
|
||
| Healthcare | 2 | $330B |
|
||
Price history
+566.7% since first listed7 events — show timeline
- 2026-06-10 Price Changed $200,000 GEPARMLS
- 2026-06-08 Price Changed $205,000 GEPARMLS
- 2026-05-08 Listed $220,000 GEPARMLS
- 2014-02-11 Sold (Public Records) — Public Records
- 2010-09-23 Sold (Public Records) — Public Records
- 2008-11-14 Listed $30,000 GEPARMLS
- 2008-11-06 Sold (Public Records) — Public Records
Property tax history
+8.6%/yrLatest (2025): $917 · +1.4% YoY. Source: county tax records.
Cash-flow waterfall
monthlySold comps — $/sqft
last 12 mo · ≤1 miLoading sold comps…