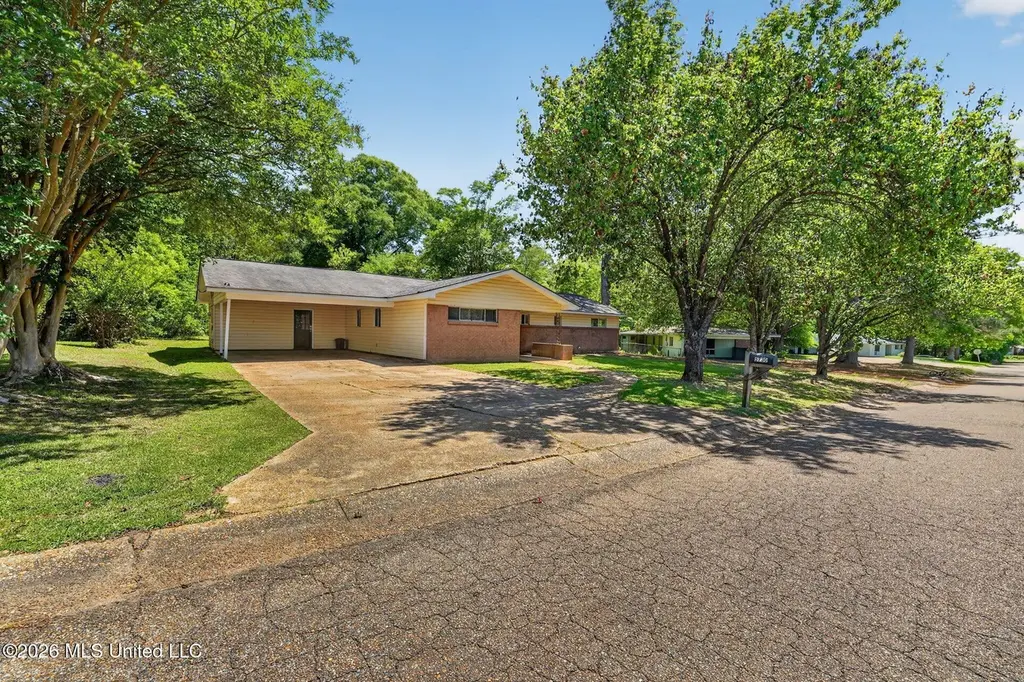
5730 NE Imperial Dr · Jackson, MS
Flood risk 1/10 · Minimal
- FEMA flood zone
- X (unshaded)
- Chance of flooding over 30 yrs
- 0.0%
- Est. flood insurance / yr
- $507 – $1,088
Fire risk 1/10 · Minimal
- Est. fire insurance / yr
- $1,241 – $2,305
Heat risk 7/10 · Major
- Hot days now (above 108°F)
- 7 days/yr
- Hot days in 30 yrs
- 20 days/yr
Wind risk 8/10 · Major
- Chance of severe wind over 30 yrs
- 80.0%
Air-quality risk 2/10 · Minimal
- Unhealthy air days now
- 0 days/yr
- Unhealthy air days in 30 yrs
- 1 days/yr
Risk factors via First Street. Map © Google.
Why this score? — see what drove the B grade
The composite is a weighted blend of 9 inputs, each scored 0–100. Each bar is that input's sub-score; the figure is the points it added to the 100-point composite (weight × sub-score).
- Cash flow +30.0/30.0
- ARV discount +12.4/15.0
- DSCR +10.0/10.0
- 1% rule +9.0/10.0
- Rent growth +4.5/5.0
- Livability +3.4/5.0
- Condition / age +2.5/5.0
- Schools +1.1/10.0
- Appreciation +0.0/10.0
$139,900
🖨 Deal sheet 📄 Offer letter ✓ Due diligence
Listing remarks
Welcome to this charming 4-bedroom, 2-bath home located in a well-established North Jackson neighborhood. This property features a spacious layout with comfortable living areas, abundant natural light, and a functional kitchen perfect for everyday living. Featuring a dedicated 8' x 9' laundry room off a 13' x 24' family room for convenience. The primary suite features a full bath and double closets. A one car attached carport makes parking a breeze! Enjoy a generous yard ideal for relaxing or entertaining. Conveniently located near shopping, dining, and major roadways for easy commuting.
Key facts
- Functional kitchen
- Generous yard
- 0.28 acre lot
Tags
Property features AI
Exterior
- Parking: Attached carport; Driveway (paved); 1 covered carport space, 1 total parking space
- Utilities: Public water; Public sewer; Electricity available; Natural gas available; Sewer connected; Water available
- Home design: Single-family house; One level; Move-in ready
- Construction: Brick construction; Shingle/composition roof; Slab foundation; Built (year from public records)
- Exterior features: Private yard; Patio slab; Chain link fencing; Shed(s); Workshop; See remarks
Interior
- Kitchen: Oven; Refrigerator; Electric water heater
- Bedrooms: Primary bedroom on main level (11x14); Bedroom on main level (12x12); Bedroom on main level (12x11); Bedroom on main level (12x10)
- Flooring: Hardwood
- Bathrooms: 2 full bathrooms (including primary full bath)
- Heating & cooling: Central heating (electric); Central air conditioning
- Interior features: High ceilings; 8 total rooms
- Laundry & utility: Main level laundry room; Common area laundry
Neighborhood map
What this means for you Summary
Snapshot
- This is a 4-bed/2.0-bath single-family listed at $140k.
Deal economics
- At list price, monthly cash flow is $543 ($7k/yr) — positive.
- The deal already cash-flows at list — no discount required.
- Meets the 1% rule at list price ($2k rent vs $140k).
- Recommended offer: $136k (3.0% below list) — sets the bar for market timing.
Location & tenants
- Location reads 68/100 on livability (#66 in MS) — a middle-class / working-renter tenant base. Strengths: commute A+, cost of living A+, housing A+; Watch: amenities F, employment F, health & safety F.
- Jackson Public School District (urban): math 9% / reading 18% proficiency, ranked #112 of 130 in MS (top 86%) — low school quality limits family demand, transient renter base, plan for 1-2y turnover; 88% free/reduced lunch — lower-income household profile, screen leases tightly.
- Zoned schools: Boyd Elementary School (math 0% / reading 9%, grade F, #368 of 375 statewide, top 98%, 405 students, 100% FRL); Murrah High School (math 12% / reading 27%, grade F, #130 of 197 statewide, top 68%, 1,326 students, 100% FRL).
- Market conditions: Rents rising fast (+7.9%/yr); 221 active listings in the ZIP; 18 comparable units currently listed for rent nearby; rentals at typical pace (median 23d on market — plan ~3-4 weeks tenant-placement turnaround); 167 units permitted in Hinds County in 2024 (0 in 5+ unit buildings).
- This rent runs 34% of the median local income ($69k/yr) — at the standard rent-burdened threshold; future hikes will face affordability resistance.
Forward outlook
- Local home prices are declining (-3.0%/yr); year-one equity from $967 of loan paydown is wiped out by about $4k of value loss. Plan a longer hold.
- Hinds County population projected to shrink 6% by 2050 — rents likely to lag national; underwrite the cash flow, not the appreciation.
- At projected returns (-3.0% appreciation + 7.9% rent growth), your $39k cash investment doubles in ~6 years — after that, you're playing with house money.
Negotiation context
- It's been on market 56 days — a 3% lower offer ($136k) is reasonable based on typical stale-listing flexibility.
- 5 sale attempts since 20y ago with the ask held roughly flat each time — persistent listings suggest the price (not the market) is what's stuck; bring a comps-based counter.
Risks & watch-outs
- Watch-outs: built in 1959 — expect roof / HVAC / electrical / plumbing capex.
- Climate carrying-cost: severe wind risk, 80% chance of damaging wind over 30y; extreme-heat days projected 7→20/yr by 2055 (HVAC capex compounding) — expect insurance premiums to compound above CPI over the hold.
Questions for the listing agent
- It's been on market 56 days. Have you received any prior offers? Is the seller open to a 3% concession, seller financing, or rate buy-down credit?
- Built in 1959 — when were the roof, HVAC, electrical panel, plumbing, and water heater last replaced?
- Is there a deadline driving the sale (1031 exchange, divorce, estate, relocation)? That informs how much negotiation room exists.
- Schools are F-rated, which usually means shorter tenancies and higher turnover. Who's the typical renter profile here, and what's been the actual vacancy rate?
- What's the average days-on-market for RENTAL listings here right now (not sales)? A rising rental-DOM trend means longer vacancies and softer asking-rent achievability than the comps imply.
- What's the recent tenant-quality profile in this submarket — average credit score on applications, eviction rate, late-payment / NSF rate, and stable-employment percentage? A property-management company in the area should have these aggregated.
- How much new for-sale + rental construction is in the pipeline within 1–3 miles? Heavy new supply typically softens prices + rents 12–24 months out; constrained supply supports both.
Investment metrics
- 1% rule
- 1.40% ✓
- Cap rate
- 10.95%
- Cash-on-cash
- 16.64%
- DSCR
- 1.74
- GRM
- 6.0
CMA / ARV
- ARV (median comp)
- $156,946
- List price
- $139,900
- Delta
- -10.86%
- Verdict
- UNDERPRICED
- Comps
- 20 within 1.0 mi
Show comp detail 12 sales within ~0.75 mi
| Address | Dist | Beds/Ba | Sqft | Sold | Price | $/sf | Match |
|---|---|---|---|---|---|---|---|
| 5205 Harrow Dr | 0.42mi | 4/2.0 | 1,732 (-4%) | 2mo | $199,900 | $115 | 72 |
| 220 Southbrook Dr | 0.21mi | 3/2.0 (-1) | 1,716 (-5%) | 7mo | $95,000 | $55 | 72 |
| 315 Melrose Dr | 0.28mi | 3/2.0 (-1) | 1,906 (+6%) | 3mo | $130,000 | $68 | 70 |
| 5863 Canton Park Dr | 0.43mi | 4/2.0 | 1,703 (-5%) | 4mo | $84,000 | $49 | 68 |
| 5854 Canton Park Dr | 0.42mi | 3/1.0 (-1) | 1,838 (+2%) | 0mo | $169,000 | $92 | 67 |
| 220 Beechcrest Dr | 0.30mi | 3/2.0 (-1) | 1,930 (+7%) | 2mo | $135,500 | $70 | 67 |
| 5730 Sedgwick Dr | 0.43mi | 4/2.0 | 1,700 (-6%) | 5mo | $150,000 | $88 | 67 |
| 223 S Park Dr | 0.55mi | 4/2.0 | 1,665 (-7%) | 2mo | $160,000 | $96 | 61 |
| 213 S Park Dr | 0.45mi | 3/2.0 (-1) | 1,674 (-7%) | 4mo | $159,900 | $96 | 59 |
| 5828 Clubview Dr | 0.30mi | 3/2.0 (-1) | 1,544 (-14%) | 3mo | $219,000 | $142 | 55 |
| 810 Colonial Cir | 0.60mi | 3/2.5 (-1) | 1,952 (+9%) | 6mo | $197,000 | $101 | 45 |
| 5506 Concord Dr | 0.73mi | 3/2.0 (-1) | 1,540 (-14%) | 1mo | $30,000 | $19 | 36 |
Match score weights: distance 35% · size 25% · config 20% · recency 20%. Top-matched comps best support the ARV.
Projected returns pro-forma
-3.0% appreciation · 7.9% rent growth · sell at horizon
- IRR
- 13.3%
- Equity multiple
- 1.56×
- Total profit
- $22,113
- Equity at exit
- $20,860
- IRR
- 25.8%
- Equity multiple
- 3.81×
- Total profit
- $110,049
- Equity at exit
- $12,096
Cash invested: $39,172 (down + closing). Projections, not guarantees.
Landlord ↔ Tenant lean methodology
- Overall (STATE)
- 90 Strongly Landlord-Friendly
- State Mississippi
- 90 Strongly Landlord-Friendly · R+11
- County
- — inherits STATE
- City
- — inherits STATE
ZIP-level market 39211
- Rents YoY
- 7.9%
- Active inventory
- 221
- Price-to-rent
- 6.0×
Monthly cashflow live
- Estimated rent
- $1,959 high interval (Pro) →
- Mortgage (P&I)
- −$734
- Tax from tax record
- −$212 /mo · $2,549/yr
- Insurance
- −$58
- HOA
- −$0
- Vacancy / Maint / Mgmt
- −$411
- Net cashflow
- $543
Break-even live
UW: 25.0% down · 7.5% · 30yr · 1.5% tax · 5.0% vac · 8.0% maint · 8.0% mgmt
Financing live
Cash to close
- Down payment
- $34,975
- Closing costs
- $4,197
- Reserves months
- —
- Total cash needed
- —
Loan-product check · same deal, 3 products live
Conventional
25% down · 7.5% · 30yr
- Down + closing
- —
- Monthly P&I
- —
- Monthly cashflow
- —
- DSCR
- —
- Eligible?
- —
Personal DTI + credit; lowest rate.
DSCR
20% down · 8.5% · 30yr
- Down + closing
- —
- Monthly P&I
- —
- Monthly cashflow
- —
- DSCR
- —
- Eligible?
- —
No personal income docs; deal must DSCR.
Hard money
10% down · 12.0% · 12mo
- Down + closing
- —
- Monthly P&I
- —
- Monthly cashflow
- —
- DSCR
- —
- Eligible?
- —
Short-term bridge; refi at stabilization.
Rent comps 18 comps
| Address | Beds | Baths | Sqft | Rent | $/sqft | DOM | Units | Dist |
|---|---|---|---|---|---|---|---|---|
| 119 S Canton Club Cir Jackson, MS | 3.0 | 2.0 | 1444 | $1,595 | $1.10 | 23d | 1 | 0.27mi |
| 120 Parkway Dr Jackson, MS | 1.0–3.0 | 1.0–2.0 | 1076 | $2,255 | $2.10 | 13d | 15 | 0.29mi |
| 5855 Canton Park Dr Jackson, MS | 4.0 | 2.0 | 1955 | $1,675 | $0.86 | 23d | 1 | 0.42mi |
| 5855 Canton Park Dr Jackson, MS | 4.0 | 2.0 | 2401 | $1,675 | $0.70 | 13d | 1 | 0.42mi |
| 2009 Lake Trace Dr Jackson, MS | 4.0 | 2.0 | 2028 | $1,950 | $0.96 | 13d | 1 | 0.96mi |
| 51 Northtown Dr Unit 001G Jackson, MS | 3.0 | 2.0 | 1260 | $1,449 | $1.15 | 13d | 1 | 1.11mi |
| 5125 Old Canton Rd Jackson, MS | 3.0 | 3.0 | 2025 | $2,100 | $1.04 | 23d | 1 | 1.15mi |
| 5301 Ridgewood Rd Jackson, MS | 3.0 | 2.0 | 1482 | $1,850 | $1.25 | 43d | 1 | 1.22mi |
| 51 Northtown Dr Unit 001B Jackson, MS | 3.0 | 2.0 | 1260 | $1,499 | $1.19 | 13d | 1 | 1.24mi |
| 51 Northtown Dr Unit 021A Jackson, MS | 3.0 | 2.0 | 1500 | $1,694 | $1.13 | 21d | 1 | 1.24mi |
| 51 Northtown Dr Unit 002G Jackson, MS | 3.0 | 2.0 | 1260 | $1,644 | $1.30 | 43d | 1 | 1.24mi |
| 51 Northtown Dr Unit 001F Jackson, MS | 3.0 | 2.0 | 1260 | $1,644 | $1.30 | 13d | 1 | 1.24mi |
| 117 Rolling Creek Dr Jackson, MS | 4.0 | 2.5 | 2459 | $2,700 | $1.10 | 23d | 1 | 1.25mi |
| 47 Moss Forest Cir Jackson, MS | 4.0 | 3.0 | 2624 | $3,000 | $1.14 | 13d | 1 | 1.29mi |
| 212 Pimlico Pl Jackson, MS | 3.0 | 2.0 | 1600 | $900 | $0.56 | 13d | 1 | 1.30mi |
| 5538 Pine Lane Dr Jackson, MS | 3.0 | 2.0 | 1627 | $1,465 | $0.90 | 43d | 1 | 1.36mi |
| 5544 Wayneland Dr Jackson, MS | 3.0 | 2.0 | 1800 | $1,831 | $1.02 | 43d | 1 | 1.42mi |
| 35 Meadowoods Ter Jackson, MS | 3.0 | 2.0 | 1269 | $1,450 | $1.14 | 23d | 1 | 1.45mi |
Listing history 32 events
-
2026-06-18days on market $139,900 Active 56 DOM
-
2026-06-17days on market $139,900 Active 55 DOM
-
2026-06-16days on market $139,900 Active 54 DOM
-
2026-06-15days on market $139,900 Active 53 DOM
-
2026-06-14days on market $139,900 Active 51 DOM
-
2026-06-13days on market $139,900 Active 50 DOM
-
2026-06-10days on market $139,900 Active 48 DOM
-
2026-06-09days on market $139,900 Active 47 DOM
-
2026-06-08days on market $139,900 Active 46 DOM
-
2026-06-07days on market $139,900 Active 45 DOM
-
2026-06-05days on market $139,900 Active 42 DOM
-
2026-06-03days on market $139,900 Active 41 DOM
-
2026-06-02days on market $139,900 Active 40 DOM
-
2026-06-01days on market $139,900 Active 39 DOM
-
2026-05-31days on market $139,900 Active 38 DOM
-
2026-05-30days on market $139,900 Active 37 DOM
-
2026-04-23$139,900 Active 594-char remark
-
2021-10-08historical
-
2021-10-02historical
-
2020-03-31soldstatus
-
2019-08-21soldstatus
-
2018-03-21soldstatus
-
2018-02-14soldstatus
-
2015-04-28$99,500
-
2009-11-05soldstatus
-
2009-04-28$109,000
-
2009-04-01soldstatus
-
2009-02-23$49,900
-
2006-04-12soldstatus
-
2006-02-02soldstatus
-
2006-01-03$89,900
-
1972-10-09soldstatus
ⓘ Source: listings_history table (triggers on properties + properties_extension) + one-shot
backfill from property_details.listing_events for pre-trigger history.
Tax reassessment forecast MS · Resets to sale price
- Current annual tax
- $2,549 · $212/mo
- Projected year-2 tax
- $2,549 · $212/mo
- Expected delta
- $0/yr ($0/mo · 0.0%)
ⓘ Screening estimate from a state-policy table — verify with the county assessor before closing.
Climate risk First Street
- Flood 1/10 Low FEMA zone X (unshaded) · 0% chance over 30 yrs
- Wildfire 1/10 Low
- Heat 7/10 Severe 7 d/yr ≥108°F today · 20 d/yr by 30 yrs out
- Wind 8/10 Severe 80% chance of damaging wind over 30 yrs
- Air quality 2/10 Low 0 unhealthy d/yr today · 1 by 30 yrs out
Nearby sold comps map
Loading sold comps map…
Walkable amenities ~0.75 mi
Loading nearby amenities…
Taxation est. · year 1
- Rental income
- $23,507
- − Mortgage interest
- −$7,837
- − Property taxes
- −$2,549
- − Insurance
- −$700
- − Repairs & maintenance
- −$1,881
- − Management
- −$1,881
- − Depreciation
- −$4,070
- Taxable income
- $4,591
- Est. tax owed @ 24.0%
- −$1,102
- After-tax cash flow
- $5,416/yr
For passive investors: Depreciation is non-cash, so a rental often shows a tax loss while cash-flowing — sheltering income. Rental losses are passive: they offset passive income freely, and up to $25,000/yr can offset ordinary (W-2) income if you actively participate and your MAGI is under $100k (phasing out to $0 by $150k); unused losses carry forward. On sale, claimed depreciation is recaptured at up to 25%, and gains may owe capital-gains tax (a 1031 exchange can defer both). Figures are a year-1 estimate at your 24.0% rate — not tax advice; consult a CPA.
Schools (NCES district)
- District
- Jackson Public School District
- NCES district ID
- 2802190
- Math proficiency
- 9% ▼ -14.00%
- Reading proficiency
- 18% ▼ -7.00%
- Median HH income
- $33,234
- Composite
- 10.89/100
- National rank
- #9755
- State rank
- #112 of 130 in MS
Livability — Jackson
- Score
- 68/100
- State rank
- #66
- US rank
- #9695
Category grades
Schools grade is shown separately in the Schools card above.
Census & demographics
- Census place
- Jackson, MS
- County
- Hinds County · 167,040 people
- City population
- 140,204
- Metro
- Jackson, MS
- Population (ZIP)
- 23,838
- Household income
- $69,426
- Rent vs Own
- Severe rent burden
- 736.0
Population outlook (Hinds County) Hauer SSP2
- Today (2025)
- 242,528 people
- By 2030
- 241,113 · -0.6%
- By 2040
- 235,557 · -2.9%
- By 2050
- 226,946 · -6.4%
- By 2075
- 199,995 · -17.5%
- By 2100
- 164,165 · -32.3%
Race, ethnicity, and origin ACS 2023
- Neighborhood character
- Majority Black (59%)
- Race & ethnicity
- Black 59% White 36% Hispanic / Latino 3% Two or more races 2%
- Common ancestry
- Serbian 2% Italian 2% Slovak 1%
- Foreign-born
- 2% · Canada, China
- Languages at home
- 96% English-only · Spanish 3% Chinese 1%
Political lean MEDSL · Hinds
- 2024 margin
- Solid D (+46.1) · D 72.4% · R 26.3% · Other 1.4%
- 2008→2024 swing
- +7.1pp toward D · 2008: 39.0pp · 2024: 46.1pp
- All cycles
- 2024: D+46.1 2020: D+48.3 2016: D+43.7 2012: D+45.1 2008: D+39.0
Not yet ingested
- Civics
- —
Market trends
- HPI YoY
- ▼ -135.99%
- Current HPI
- 145.5192
- Rent YoY
- ▲ 7.90%
- Metro
- Jackson, MS
- State GDP YoY
- —
- F500 in state
- 0
Price history
+55.6% since first listed16 events — show timeline
- 2026-04-23 Listed $139,900 MLSU
- 2021-10-08 Listing Removed — MLSU
- 2021-10-02 Listing Removed — MLSU
- 2020-03-31 Sold (Public Records) — Public Records
- 2019-08-21 Sold (Public Records) — Public Records
- 2018-03-21 Sold (Public Records) — Public Records
- 2018-02-14 Sold (Public Records) — Public Records
- 2015-04-28 Listed $99,500 MLSU
- 2009-11-05 Sold (Public Records) — Public Records
- 2009-04-28 Listed $109,000 MLSU
- 2009-04-01 Sold (MLS) — MLSU
- 2009-02-23 Listed $49,900 MLSU
- 2006-04-12 Sold (Public Records) — Public Records
- 2006-02-02 Sold (MLS) — MLSU
- 2006-01-03 Listed $89,900 MLSU
- 1972-10-09 Sold (Public Records) — Public Records
Property tax history
+1.1%/yrLatest (2025): $2,549 · +1.6% YoY. Source: county tax records.
Cash-flow waterfall
monthlySold comps — $/sqft
last 12 mo · ≤1 miLoading sold comps…