 🏗️ New Construction
SKYLINE 123 Cranberry Village Estates Plan · Cranberry, PA
Flood risk 1/10 · Minimal
- FEMA flood zone
- X (unshaded)
- Chance of flooding over 30 yrs
- 0.0%
- Est. flood insurance / yr
- $473 – $860
Fire risk 1/10 · Minimal
- Est. fire insurance / yr
- $511 – $949
Heat risk 4/10 · Minor
- Hot days now (above 96°F)
- 7 days/yr
- Hot days in 30 yrs
- 18 days/yr
Wind risk 1/10 · Minimal
- Chance of severe wind over 30 yrs
- —
Air-quality risk 3/10 · Minor
- Unhealthy air days now
- 3 days/yr
- Unhealthy air days in 30 yrs
- 5 days/yr
Risk factors via First Street. Map © Google.
Why this score? — see what drove the B- grade
The composite is a weighted blend of 9 inputs, each scored 0–100. Each bar is that input's sub-score; the figure is the points it added to the 100-point composite (weight × sub-score).
- Cash flow +30.0/30.0
- 1% rule +10.0/10.0
- DSCR +10.0/10.0
- ARV discount +7.5/15.0
- Schools +5.2/10.0
- Condition / age +2.8/5.0
- Livability +2.5/5.0
- Rent growth +2.0/5.0
- Appreciation +0.0/10.0
$35,500
🖨 Deal sheet 📄 Offer letter ✓ Due diligence
Listing remarks MLS
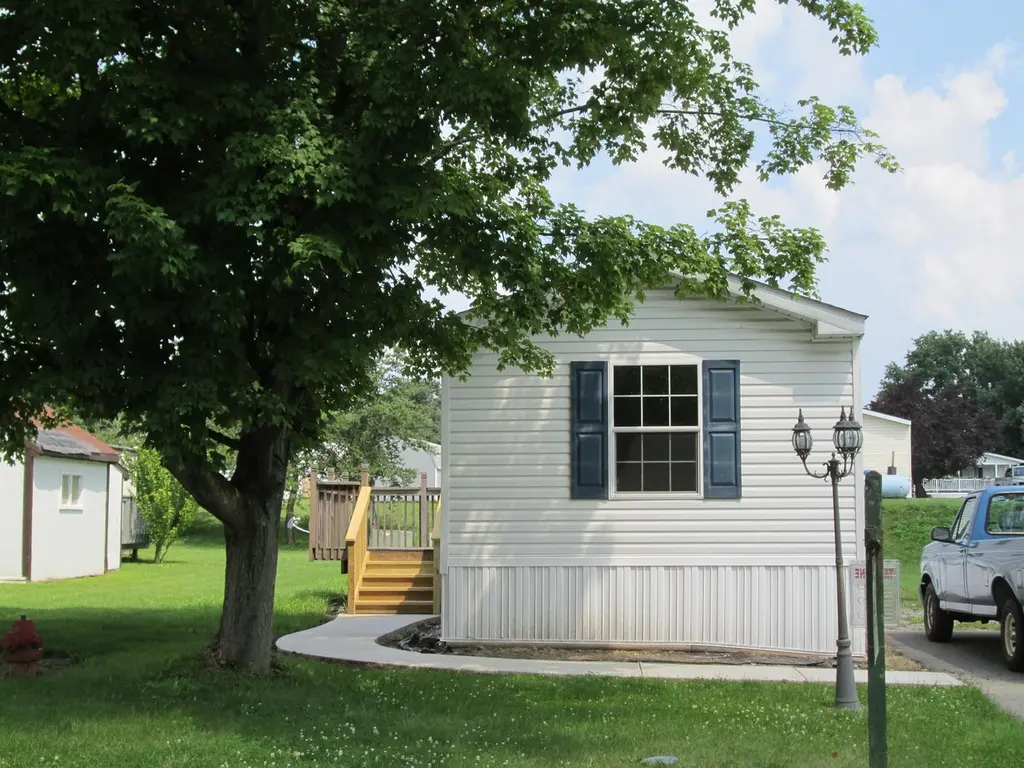
Those looking for a cozy manufactured home will find their perfect one in Cranberry Village. Cranberry Village is a suburban, pet-friendly community with tree-lined streets and tons of amenities, including a clubhouse, basketball court, and playground. All of our energy-efficient, manufactured, 2-3 bedroom houses come in a wide variety of styles, layouts, and sizes to match your needs, in a surrounding community that's sure to feel like home. Cranberry Village is located in Cranberry Township, Pennsylvania - only 20 miles outside of Pittsburgh! This community is tucked between the rolling, green Pennsylvania hills, offering both the convenience of nearby necessities and the peace of rural surroundings at nearby Graham Park or Cranberry Park. The surrounding Cranberry Township features convenient shopping, great dining options, and everything else that metropolitan Pittsburgh area has to offer!
Key facts
- Clubhouse
- Manufactured home
- Basketball court
Tags
Neighborhood map
What this means for you Summary
Snapshot
- This is a 3-bed/2.0-bath manufactured listed at $36k. Condition is rated average.
Deal economics
- At list price, monthly cash flow is $1k ($14k/yr) — positive.
- The deal already cash-flows at list — no discount required.
- Meets the 1% rule at list price ($2k rent vs $36k).
- Recommended offer: $31k (12.0% below list) — sets the bar for market timing.
Location & tenants
- Location reads: area grade B — affects rentability + tenant quality, not the cash-flow math above.
- Seneca Valley SD (rural): math 48% / reading 67% proficiency, ranked #73 of 539 in PA (top 14%) — acceptable for families but not a draw, mixed tenant base, ~2y average lease; only 12% free/reduced lunch — higher-income household profile.
- Market conditions: Rents soft (-1.9%/yr); 288 active listings in the ZIP; 9 comparable units currently listed for rent nearby; rentals leasing fast (median 2d on market — plan ~1-2 weeks tenant-placement turnaround); high-income renter base; 987 units permitted in Butler County in 2024 (0 in 5+ unit buildings).
Forward outlook
- Local home prices are declining (-3.0%/yr); year-one equity from $472 of loan paydown is wiped out by about $2k of value loss. Plan a longer hold.
- Butler County population projected to shrink 5% by 2050 — rents likely to lag national; underwrite the cash flow, not the appreciation.
- At projected returns (-3.0% appreciation + 0.0% rent growth), your $19k cash investment doubles in ~2 years — after that, you're playing with house money.
Negotiation context
- It's been on market 265 days — a 12% lower offer ($31k) is reasonable based on typical stale-listing flexibility.
Risks & watch-outs
- Watch-outs: property tax is 2.9% of price.
Questions for the listing agent
- It's been on market 265 days. Have you received any prior offers? Is the seller open to a 12% concession, seller financing, or rate buy-down credit?
- Property tax is high relative to price — has the assessment been appealed recently, and will the sale trigger a re-assessment?
- Why hasn't it sold? Are there any deal-killer items the seller is aware of (foundation, flood, title, zoning, code violations)?
- Is there a deadline driving the sale (1031 exchange, divorce, estate, relocation)? That informs how much negotiation room exists.
- What's the average days-on-market for RENTAL listings here right now (not sales)? A rising rental-DOM trend means longer vacancies and softer asking-rent achievability than the comps imply.
- What's the recent tenant-quality profile in this submarket — average credit score on applications, eviction rate, late-payment / NSF rate, and stable-employment percentage? A property-management company in the area should have these aggregated.
- How much new for-sale + rental construction is in the pipeline within 1–3 miles? Heavy new supply typically softens prices + rents 12–24 months out; constrained supply supports both.
Investment metrics
- 1% rule
- 3.07% ✓
- Cap rate
- 27.08%
- Cash-on-cash
- 74.23%
- DSCR
- 4.30
- GRM
- 2.7
CMA / ARV
- ARV (median comp)
- $68,198
- List price
- $35,500
- Delta
- -47.95%
- Verdict
- UNDERPRICED
- Comps
- 6 within 1.0 mi
Projected returns pro-forma
-3.0% appreciation · 0.0% rent growth · sell at horizon
- IRR
- 70.6%
- Equity multiple
- 4.04×
- Total profit
- $58,086
- Equity at exit
- $10,169
- IRR
- 73.7%
- Equity multiple
- 7.49×
- Total profit
- $123,894
- Equity at exit
- $5,897
Cash invested: $19,095 (down + closing). Projections, not guarantees.
Landlord ↔ Tenant lean methodology
- Overall (STATE)
- 62 Landlord-Friendly
- State Pennsylvania
- 62 Landlord-Friendly · EVEN
- County
- — inherits STATE
- City
- — inherits STATE
ZIP-level market 16066
- Rents YoY
- -1.9%
- Active inventory
- 288
- Price-to-rent
- 1.4×
Monthly cashflow live
- Estimated rent
- $2,092 high interval (Pro) →
- Mortgage (P&I)
- −$358
- Tax est. 1.5%
- −$85 /mo · $1,023/yr
- Insurance
- −$28
- HOA
- −$0
- Vacancy / Maint / Mgmt
- −$439
- Net cashflow
- $1,181
Break-even live
UW: 25.0% down · 7.5% · 30yr · 1.5% tax · 5.0% vac · 8.0% maint · 8.0% mgmt
Financing live
Cash to close
- Down payment
- $17,050
- Closing costs
- $2,046
- Reserves months
- —
- Total cash needed
- —
Loan-product check · same deal, 3 products live
Conventional
25% down · 7.5% · 30yr
- Down + closing
- —
- Monthly P&I
- —
- Monthly cashflow
- —
- DSCR
- —
- Eligible?
- —
Personal DTI + credit; lowest rate.
DSCR
20% down · 8.5% · 30yr
- Down + closing
- —
- Monthly P&I
- —
- Monthly cashflow
- —
- DSCR
- —
- Eligible?
- —
No personal income docs; deal must DSCR.
Hard money
10% down · 12.0% · 12mo
- Down + closing
- —
- Monthly P&I
- —
- Monthly cashflow
- —
- DSCR
- —
- Eligible?
- —
Short-term bridge; refi at stabilization.
Rent comps 9 comps
| Address | Beds | Baths | Sqft | Rent | $/sqft | DOM | Units | Dist |
|---|---|---|---|---|---|---|---|---|
| 244 E Commons Dr Cranberry Township, PA | 2.0 | 1.5 | 1116 | $1,700 | $1.52 | 12d | 1 | 0.34mi |
| 315 Bellford Ct Cranberry Township, PA | 2.0 | 1.5 | 1116 | $850 | $0.76 | 17d | 1 | 0.35mi |
| 10100 Kettlecreek Dr Cranberry Township, PA | 1.0–2.0 | 1.0–2.0 | 976 | $1,875 | $1.92 | 1d | 21 | 0.81mi |
| 90 Berkley Manor Dr Cranberry Township, PA | 1.0–3.0 | 1.0–2.0 | 1023 | $2,340 | $2.29 | 1d | 16 | 0.83mi |
| 8000 Brandt Dr Cranberry Twp, PA | 1.0–3.0 | 1.0–2.0 | 1193 | $2,776 | $2.33 | 1d | 26 | 1.00mi |
| 401 Collingwood Ct Cranberry Twp, PA | 1.0–3.0 | 1.0–2.0 | 950 | $1,865 | $1.96 | 1d | 1 | 1.06mi |
| 102 Holly Dr Cranberry Township, PA | 3.0 | 1.0–2.0 | 1129 | $1,175 | $1.04 | 1d | 1 | 1.22mi |
| 15000 Metropolitan WAY Cranberry Twp, PA | 2.0 | 2.0 | 1202 | $1,805 | $1.50 | 2d | 4 | 1.23mi |
| 1000 Strand Rd Cranberry Township, PA | 1.0–3.0 | 1.0–2.0 | 1117 | $3,048 | $2.73 | 2d | 13 | 1.34mi |
Listing history 15 events
-
2026-06-18days on market $35,500 Active 265 DOM
-
2026-06-17days on market $35,500 Active 264 DOM
-
2026-06-16days on market $35,500 Active 263 DOM
-
2026-06-15days on market $35,500 Active 262 DOM
-
2026-06-13days on market $35,500 Active 260 DOM
-
2026-06-13days on market $35,500 Active 259 DOM
-
2026-06-09days on market $35,500 Active 256 DOM
-
2026-06-08days on market $35,500 Active 255 DOM
-
2026-06-07days on market $35,500 Active 254 DOM
-
2026-06-05days on market $35,500 Active 251 DOM
-
2026-06-03days on market $35,500 Active 250 DOM
-
2026-06-02days on market $35,500 Active 249 DOM
-
2026-06-01days on market $35,500 Active 248 DOM
-
2026-05-31days on market $35,500 Active 247 DOM
-
2025-09-27$35,500 Active 906-char remark
Show marketing remark (906 chars)
Those looking for a cozy manufactured home will find their perfect one in Cranberry Village. Cranberry Village is a suburban, pet-friendly community with tree-lined streets and tons of amenities, including a clubhouse, basketball court, and playground. All of our energy-efficient, manufactured, 2-3 bedroom houses come in a wide variety of styles, layouts, and sizes to match your needs, in a surrounding community that's sure to feel like home. Cranberry Village is located in Cranberry Township, Pennsylvania - only 20 miles outside of Pittsburgh! This community is tucked between the rolling, green Pennsylvania hills, offering both the convenience of nearby necessities and the peace of rural surroundings at nearby Graham Park or Cranberry Park. The surrounding Cranberry Township features convenient shopping, great dining options, and everything else that metropolitan Pittsburgh area has to offer!
ⓘ Source: listings_history table (triggers on properties + properties_extension) + one-shot
backfill from property_details.listing_events for pre-trigger history.
Climate risk First Street
- Flood 1/10 Low FEMA zone X (unshaded) · 0% chance over 30 yrs
- Wildfire 1/10 Low
- Heat 4/10 Moderate 7 d/yr ≥96°F today · 18 d/yr by 30 yrs out
- Wind 1/10 Low
- Air quality 3/10 Moderate 3 unhealthy d/yr today · 5 by 30 yrs out
Nearby sold comps map
Loading sold comps map…
Walkable amenities ~0.75 mi
Loading nearby amenities…
Taxation est. · year 1
- Rental income
- $25,102
- − Mortgage interest
- −$3,820
- − Property taxes
- −$1,023
- − Insurance
- −$341
- − Repairs & maintenance
- −$2,008
- − Management
- −$2,008
- − Depreciation
- −$1,984
- Taxable income
- $13,918
- Est. tax owed @ 24.0%
- −$3,340
- After-tax cash flow
- $10,835/yr
For passive investors: Depreciation is non-cash, so a rental often shows a tax loss while cash-flowing — sheltering income. Rental losses are passive: they offset passive income freely, and up to $25,000/yr can offset ordinary (W-2) income if you actively participate and your MAGI is under $100k (phasing out to $0 by $150k); unused losses carry forward. On sale, claimed depreciation is recaptured at up to 25%, and gains may owe capital-gains tax (a 1031 exchange can defer both). Figures are a year-1 estimate at your 24.0% rate — not tax advice; consult a CPA.
Condition & rehab AI · 4 photos
This manufactured home requires cosmetic updates to kitchen cabinets, fixtures, and exterior siding to improve its curb appeal and functionality.
Repairs flagged
- Moderate Kitchen cabinets — Worn condition
- Moderate Bathtub and fixtures — Dated appearance
- Moderate Exterior siding — Weathered condition
Value-add opportunities
- Resale Paint interior walls — Fresh paint enhances curb appeal
- Rental Replace carpet in bedrooms — New carpet improves comfort and appeal
- Both Update kitchen countertops — Modern countertops increase functionality and aesthetic
Renovation cost estimate screening
| Repair item | Severity | Est. cost |
|---|---|---|
| Kitchen cabinets · Worn condition | Moderate | $3,000–15,000 |
| Bathtub and fixtures · Dated appearance | Moderate | $3,000–15,000 |
| Exterior siding · Weathered condition | Moderate | $3,000–15,000 |
| Total estimated repair cost · 3 items | $9,000–45,000 |
Value-add ROI direction
- Resale Paint interior walls — Fresh paint enhances curb appeal ↑
- Rental Replace carpet in bedrooms — New carpet improves comfort and appeal ↑
- Both Update kitchen countertops — Modern countertops increase functionality and aesthetic ↑
ⓘ Cost ranges are severity-bucket heuristics (US national rule-of-thumb). Get contractor quotes + a written scope before underwriting a rehab budget.
Schools (NCES district)
- District
- Seneca Valley SD
- NCES district ID
- 4222440
- Math proficiency
- 48% ▼ -15.00%
- Reading proficiency
- 67% ▼ -12.00%
- Median HH income
- $80,381
- Composite
- 51.84/100
- National rank
- #1666
- State rank
- #73 of 539 in PA
Livability — Cranberry
No livability data for this city. (Only ~50 U.S. cities are tracked.)
Census & demographics
- County
- Butler County · 73,107 people
- Metro
- Pittsburgh, PA
- Population (ZIP)
- 33,873
- Household income
- $124,189
- Rent vs Own
- Severe rent burden
- 536.0
Population outlook (Butler County) Hauer SSP2
- Today (2025)
- 190,777 people
- By 2030
- 191,476 · +0.4%
- By 2040
- 189,474 · -0.7%
- By 2050
- 182,050 · -4.6%
- By 2075
- 159,526 · -16.4%
- By 2100
- 129,028 · -32.4%
Race, ethnicity, and origin ACS 2023
- Neighborhood character
- Predominantly White (90%)
- Race & ethnicity
- White 90% Asian 4% Two or more races 3% Hispanic / Latino 2% Black 1%
- Common ancestry
- Romanian 10% Slovak 1% Italian 1%
- Foreign-born
- 5% · Canada, China
- Languages at home
- 93% English-only · Other Indo-European 2% Spanish 1% Other Asian/Pacific 1%
Political lean MEDSL · Butler
- 2024 margin
- Solid R (+32.2) · D 33.5% · R 65.7%
- 2008→2024 swing
- -4.8pp toward R · 2008: -27.4pp · 2024: -32.2pp
- All cycles
- 2024: R+32.2 2020: R+32.5 2016: R+37.5 2012: R+34.9 2008: R+27.4
Not yet ingested
- Civics
- —
Market trends
- HPI YoY
- ▼ -154.35%
- Current HPI
- 276.4597
- Rent YoY
- ▼ -1.93%
- Metro
- Pittsburgh, PA
- State GDP YoY
- ▲ 1.68%
- F500 in state
- 34
Industry mix (Fortune 500 HQ in PA)
| Industry | F500 HQs | Revenue |
|---|---|---|
| Healthcare | 2 | $309B |
|
||
| Insurance | 2 | $27B |
|
||
| Telecommunications / Media | 1 | $124B |
|
||
| Industrial Distribution | 1 | $22B |
|
||
| Financial Services | 1 | $20B |
|
||
| Chemicals / Materials | 1 | $18B |
|
||
Price history
1 event — show timeline
- 2025-09-27 Listed $35,500 Zillow
Cash-flow waterfall
monthlySold comps — $/sqft
last 12 mo · ≤1 miLoading sold comps…