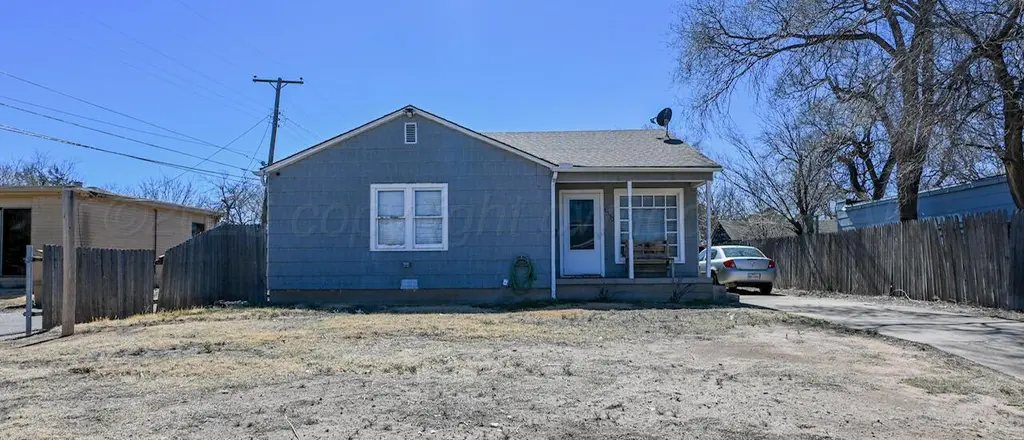
1313 SW 15th Ave · Amarillo, TX
Flood risk 1/10 · Minimal
- FEMA flood zone
- X (unshaded)
- Chance of flooding over 30 yrs
- 0.0%
- Est. flood insurance / yr
- $507 – $1,088
Fire risk 2/10 · Minimal
- Est. fire insurance / yr
- $1,222 – $2,270
Heat risk 4/10 · Minor
- Hot days now (above 97°F)
- 6 days/yr
- Hot days in 30 yrs
- 18 days/yr
Wind risk 2/10 · Minimal
- Chance of severe wind over 30 yrs
- —
Air-quality risk 2/10 · Minimal
- Unhealthy air days now
- 1 days/yr
- Unhealthy air days in 30 yrs
- 1 days/yr
Risk factors via First Street. Map © Google.
Why this score? — see what drove the D grade
The composite is a weighted blend of 9 inputs, each scored 0–100. Each bar is that input's sub-score; the figure is the points it added to the 100-point composite (weight × sub-score).
- ARV discount +14.4/15.0
- Cash flow +10.0/30.0
- Schools +3.6/10.0
- Livability +3.3/5.0
- 1% rule +2.8/10.0
- DSCR +2.8/10.0
- Rent growth +2.5/5.0
- Condition / age +2.5/5.0
- Appreciation +0.0/10.0
$145,000
🖨 Deal sheet (PDF) 📄 Offer letter ✓ Due diligence
Listing remarks
Here's a polished listing description: * * Charming Bivins Home with Shop & Investment Potential! * * Don't miss this fantastic opportunity in the desirable Bivins neighborhood! This 3-bedroom, 1-bath home features beautiful hardwood floors, fresh paint throughout, and new flooring in the kitchen and utility room, creating a clean, move-in-ready space. Outside, you'll find a large rear parking area and a versatile shop complete with its own bathroom--perfect for hobbies, storage, a workspace, or additional functionality. Whether you're searching for a comfortable starter home or the next addition to your real estate investment portfolio, this property offers outstanding valu
Key facts
- Fresh paint
- New flooring
- 7,405 sq ft lot
Tags
Property features AI
Finance
- Other: Zoning: 0100 - NW Amarillo in City Limits
Exterior
- Parking: Additional parking
- Utilities: Public water; Public sewer
- Home design: Single-family residence; One story; North-facing
- Construction: Frame construction
- Exterior features: Workshop; Lot approximately 0.17 acres (50 x 150)
Interior
- Kitchen: Range
- Bathrooms: 1 full bathroom
- Heating & cooling: Has cooling; Ceiling fan(s)
- Interior features: Ceiling fan(s); Range
Neighborhood map
What this means for you Summary
Snapshot
- This is a 2-bed/1.0-bath single-family listed at $145k.
Deal economics
- At list price, monthly cash flow is $-89 ($-1k/yr) — negative.
- To cash-flow at today's rent, offer at most $129k (10.8% below list).
- To meet the 1% rule (rent ≥ 1% of price), the offer needs to be $114k (21.5% below list).
- Recommended offer: $114k (21.5% below list) — sets the bar for 1% rule.
Location & tenants
- Location reads 66/100 on livability (#624 in TX) — a middle-class / working-renter tenant base. Strengths: cost of living A+, housing A+; Watch: amenities C-, schools D, crime F.
- Amarillo ISD (urban): math 44% / reading 41% proficiency, ranked #336 of 826 in TX (top 41%) — families likely to look elsewhere, expect single-tenant / working-renter base with shorter leases.
- Market conditions: 37 active listings in the ZIP; 17 comparable units currently listed for rent nearby; rentals at typical pace (median 22d on market — plan ~3-4 weeks tenant-placement turnaround); 1,214 units permitted in Potter County in 2024 (650 in 5+ unit buildings).
Forward outlook
- Local home prices are declining (-3.0%/yr); year-one equity from $1k of loan paydown is wiped out by about $4k of value loss. Plan a longer hold.
Negotiation context
- Only 14 days on market — expect competitive offers; lowballing is unlikely to land.
Risks & watch-outs
- Watch-outs: built in 1948 — expect roof / HVAC / electrical / plumbing capex.
Questions for the listing agent
- What do current leases actually rent for vs. the listed asking? Can we see a recent rent roll and the last 12 months of T-12 income?
- Built in 1948 — when were the roof, HVAC, electrical panel, plumbing, and water heater last replaced?
- Is there a deadline driving the sale (1031 exchange, divorce, estate, relocation)? That informs how much negotiation room exists.
- Schools are D-rated, which usually means shorter tenancies and higher turnover. Who's the typical renter profile here, and what's been the actual vacancy rate?
- Crime grade is F in this area — have there been break-ins, vandalism, or insurance claims at this property in the last 3 years? What carrier currently insures it and at what premium?
- The area grade is low — what's the realistic commute time and amenity access for the typical tenant pool here? Any planned neighborhood developments (good or bad) we should know about?
- What's the average days-on-market for RENTAL listings here right now (not sales)? A rising rental-DOM trend means longer vacancies and softer asking-rent achievability than the comps imply.
- What's the recent tenant-quality profile in this submarket — average credit score on applications, eviction rate, late-payment / NSF rate, and stable-employment percentage? A property-management company in the area should have these aggregated.
- How much new for-sale + rental construction is in the pipeline within 1–3 miles? Heavy new supply typically softens prices + rents 12–24 months out; constrained supply supports both.
Investment metrics
- 1% rule
- 0.78% ✗
- Cap rate
- 5.56%
- Cash-on-cash
- -2.62%
- DSCR
- 0.88
- GRM
- 10.6
CMA / ARV
- ARV (median comp)
- $171,083
- List price
- $145,000
- Delta
- -26.94%
- Verdict
- UNDERPRICED
- Comps
- 3 within 2.0 mi
Projected returns pro-forma
-3.0% appreciation · 3.0% rent growth · sell at horizon
- IRR
- -20.7%
- Equity multiple
- 0.28×
- Total profit
- $-29,144
- Equity at exit
- $21,620
- IRR
- -13.9%
- Equity multiple
- 0.20×
- Total profit
- $-32,629
- Equity at exit
- $12,537
Cash invested: $40,600 (down + closing). Projections, not guarantees.
Landlord ↔ Tenant lean methodology
- Overall (STATE)
- 87 Strongly Landlord-Friendly
- State Texas
- 87 Strongly Landlord-Friendly · R+5
- County
- — inherits STATE
- City
- — inherits STATE
ZIP-level market 79102
- Home prices YoY
- -33.0%
- Active inventory
- 37
- Price-to-rent
- 10.6×
Monthly cashflow live
- Estimated rent
- $1,138 high interval (Pro) →
- Mortgage (P&I)
- −$760
- Tax from tax record
- −$167 /mo · $2,000/yr
- Insurance
- −$60
- HOA
- −$0
- Vacancy / Maint / Mgmt
- −$239
- Net cashflow
- $-89
Break-even live
Sensitivity live
| Price | -10% $-7 | -5% $-48 | +0% $-89 | +5% $-130 | +10% $-171 |
|---|---|---|---|---|---|
| Rent | -10% $-179 | -5% $-134 | +0% $-89 | +5% $-44 | +10% $1 |
| Rate | -1.0pp $-16 | -0.5pp $-52 | base $-89 | +0.5pp $-126 | +1.0pp $-165 |
UW: 25.0% down · 7.5% · 30yr · 1.5% tax · 5.0% vac · 8.0% maint · 8.0% mgmt
Financing live
Cash to close
- Down payment
- $36,250
- Closing costs
- $4,350
- Reserves months
- —
- Total cash needed
- —
Loan-product check · same deal, 3 products live
Conventional
25% down · 7.5% · 30yr
- Down + closing
- —
- Monthly P&I
- —
- Monthly cashflow
- —
- DSCR
- —
- Eligible?
- —
Personal DTI + credit; lowest rate.
DSCR
20% down · 8.5% · 30yr
- Down + closing
- —
- Monthly P&I
- —
- Monthly cashflow
- —
- DSCR
- —
- Eligible?
- —
No personal income docs; deal must DSCR.
Hard money
10% down · 12.0% · 12mo
- Down + closing
- —
- Monthly P&I
- —
- Monthly cashflow
- —
- DSCR
- —
- Eligible?
- —
Short-term bridge; refi at stabilization.
Rent comps 17 comps
| Address | Beds | Baths | Sqft | Rent | $/sqft | DOM | Units | Dist |
|---|---|---|---|---|---|---|---|---|
| 1501 Clover Dr Amarillo, TX | 1.0 | 1.0 | 1358 | $980 | $0.72 | 44d | 1 | 0.22mi |
| 709 SW 14th Ave Unit 4 Amarillo, TX | 1.0 | 1.0 | 700 | $695 | $0.99 | 22d | 1 | 0.37mi |
| 612 SW 17th Ave Amarillo, TX | 1.0 | 1.0 | 1008 | $650 | $0.64 | 22d | 1 | 0.41mi |
| 2103 Parker St Amarillo, TX | 3.0 | 2.0 | 1306 | $2,300 | $1.76 | 22d | 1 | 0.58mi |
| 2104 S Travis St Amarillo, TX | 3.0 | 1.0 | 1236 | $1,700 | $1.38 | 22d | 1 | 0.61mi |
| 2030 Crockett St Amarillo, TX | 3.0 | 1.5 | 1307 | $1,750 | $1.34 | 14d | 1 | 0.67mi |
| 913 S Rusk St Amarillo, TX | 3.0 | 2.0 | 1450 | $1,450 | $1.00 | 14d | 1 | 0.75mi |
| 2306 SW 8th Ave Unit 2 Amarillo, TX | 2.0 | 1.0 | 700 | $950 | $1.36 | 44d | 1 | 0.93mi |
| 3118 SW 15th Ave Amarillo, TX | 2.0–3.0 | 1.0–2.0 | 1015 | $640 | $0.63 | 14d | 17 | 1.03mi |
| 705 S Florida St Amarillo, TX | 2.0 | 1.0 | 1014 | $850 | $0.84 | 22d | 1 | 1.11mi |
| 802 S Kentucky St Amarillo, TX | 2.0 | 1.0 | 970 | $899 | $0.93 | 44d | 1 | 1.14mi |
| 1008 S Mississippi St Amarillo, TX | 3.0 | 2.0 | 1061 | $1,275 | $1.20 | 22d | 1 | 1.22mi |
| 701 Sunset Ter Amarillo, TX | 3.0 | 1.0 | 1444 | $1,350 | $0.93 | 44d | 1 | 1.43mi |
| 701 Sunset Ter Amarillo, TX | 3.0 | 1.0 | 1444 | $1,350 | $0.93 | 22d | 1 | 1.43mi |
| 3003 SW 27th Ave Amarillo, TX | 2.0 | 1.5 | 808 | $895 | $1.11 | 14d | 1 | 1.44mi |
| 3205 S Tyler St Amarillo, TX | 3.0 | 1.0 | 1381 | $1,475 | $1.07 | 14d | 1 | 1.46mi |
| 3005 SW 28th Ave Unit C Amarillo, TX | 3.0 | 2.0 | 1480 | $1,700 | $1.15 | 14d | 1 | 1.48mi |
Listing history 18 events
-
2026-06-18days on market $145,000 Active 14 DOM
-
2026-06-17days on market $145,000 Active 13 DOM
-
2026-06-16days on market $145,000 Active 12 DOM
-
2026-06-15days on market $145,000 Active 11 DOM
-
2026-06-14days on market $145,000 Active 9 DOM
-
2026-06-13days on market $145,000 Active 8 DOM
-
2026-06-10days on market $145,000 Active 6 DOM
-
2026-06-09days on market $145,000 Active 5 DOM
-
2026-06-08days on market $145,000 Active 4 DOM
-
2026-06-07remarks 695-char remark
-
2026-06-07pricedays on market $145,000 Active 3 DOM
-
2026-06-01days on market $125,000 Active 68 DOM
-
2026-05-31days on market $125,000 Active 67 DOM
-
2026-05-30days on market $125,000 Active 66 DOM
-
2026-03-26price $125,000 496-char remark
-
2026-03-25$118,000 Active 496-char remark
-
2020-08-11soldstatus
-
2015-10-20soldstatus
ⓘ Source: listings_history table (triggers on properties + properties_extension) + one-shot
backfill from property_details.listing_events for pre-trigger history.
Tax reassessment forecast TX · Resets to sale price
- Current annual tax
- $2,000 · $167/mo
- Projected year-2 tax
- $2,654 · $221/mo
- Expected delta
- +$653/yr (+$54/mo · 32.7%)
ⓘ Screening estimate from a state-policy table — verify with the county assessor before closing.
Climate risk First Street
- Flood 1/10 Low FEMA zone X (unshaded) · 0% chance over 30 yrs
- Wildfire 2/10 Low
- Heat 4/10 Moderate 6 d/yr ≥97°F today · 18 d/yr by 30 yrs out
- Wind 2/10 Low
- Air quality 2/10 Low 1 unhealthy d/yr today · 1 by 30 yrs out
Nearby sold comps map
Loading sold comps map…
Walkable amenities ~0.75 mi
Loading nearby amenities…
Taxation est. · year 1
- Rental income
- $13,651
- − Mortgage interest
- −$8,122
- − Property taxes
- −$2,000
- − Insurance
- −$725
- − Repairs & maintenance
- −$1,092
- − Management
- −$1,092
- − Depreciation
- −$4,218
- Taxable loss
- −$3,599
- Est. tax savings @ 24.0%
- +$864
- After-tax cash flow
- $-202/yr
For passive investors: Depreciation is non-cash, so a rental often shows a tax loss while cash-flowing — sheltering income. Rental losses are passive: they offset passive income freely, and up to $25,000/yr can offset ordinary (W-2) income if you actively participate and your MAGI is under $100k (phasing out to $0 by $150k); unused losses carry forward. On sale, claimed depreciation is recaptured at up to 25%, and gains may owe capital-gains tax (a 1031 exchange can defer both). Figures are a year-1 estimate at your 24.0% rate — not tax advice; consult a CPA.
Schools (NCES district)
- District
- Amarillo ISD
- NCES district ID
- 4808130
- Math proficiency
- 44% ▼ -9.00%
- Reading proficiency
- 41% ▼ -3.00%
- Median HH income
- $43,478
- Composite
- 35.96/100
- National rank
- #4798
- State rank
- #336 of 826 in TX
Livability — Amarillo
- Score
- 66/100
- State rank
- #624
- US rank
- #11876
Category grades
Schools grade is shown separately in the Schools card above.
Census & demographics
- Census place
- Amarillo, TX
- County
- Potter County · 72,216 people
- City population
- 185,802
- Metro
- Amarillo, TX
- Population (ZIP)
- 9,393
- Household income
- $51,125
- Rent vs Own
- Severe rent burden
- 487.0
Population outlook (Potter County) Hauer SSP2
- Today (2025)
- 121,296 people
- By 2030
- 120,883 · -0.3%
- By 2040
- 119,668 · -1.3%
- By 2050
- 117,788 · -2.9%
- By 2075
- 110,250 · -9.1%
- By 2100
- 92,923 · -23.4%
Race, ethnicity, and origin ACS 2023
- Neighborhood character
- Diverse neighborhood (Simpson 0.58)
- Race & ethnicity
- White 50% Hispanic / Latino 40% Two or more races 15% Asian 4% Black 3% Native American 1%
- Hispanic origin (detail)
- Mexican 31%
- Common ancestry
- Italian 3% Slovak 1% Lithuanian 1%
- Foreign-born
- 10% · Canada, Philippines
- Languages at home
- 77% English-only · Spanish 21% Other Asian/Pacific 2%
Political lean MEDSL · Potter
- 2024 margin
- Solid R (+44.4) · D 27.3% · R 71.7% · Other 1.1%
- 2008→2024 swing
- -5.0pp toward R · 2008: -39.4pp · 2024: -44.4pp
- All cycles
- 2024: R+44.4 2020: R+38.7 2016: R+41.9 2012: R+44.6 2008: R+39.4
Not yet ingested
- Civics
- —
Market trends
- HPI YoY
- ▼ -86.43%
- Current HPI
- 175.582
- Rent YoY
- —
- Metro
- Amarillo, TX
- State GDP YoY
- ▲ 3.95%
- F500 in state
- 110
Industry mix (Fortune 500 HQ in TX)
| Industry | F500 HQs | Revenue |
|---|---|---|
| Energy | 16 | $1,198B |
|
||
| Technology | 5 | $198B |
|
||
| Engineering / Construction | 4 | $72B |
|
||
| Energy Services | 3 | $60B |
|
||
| Utilities | 3 | $41B |
|
||
| Healthcare | 2 | $330B |
|
||
Price history
+16.0% since first listed4 events — show timeline
- 2026-06-03 Listed $145,000 AARMLS
- 2026-03-26 Price Changed $125,000 AARMLS
- 2020-08-11 Sold (Public Records) — Public Records
- 2015-10-20 Sold (Public Records) — Public Records
Property tax history
+1.2%/yrLatest (2025): $2,000 · +22.4% YoY. Source: county tax records.
Cash-flow waterfall
monthlySold comps — $/sqft
last 12 mo · ≤1 miLoading sold comps…