7833 Kiely Rd · Vinton, TX
Flood risk 1/10 · Minimal
- FEMA flood zone
- X
- Chance of flooding over 30 yrs
- 0.0%
- Est. flood insurance / yr
- $507 – $1,088
Fire risk 4/10 · Minor
- Est. fire insurance / yr
- $1,222 – $2,270
Heat risk 6/10 · Moderate
- Hot days now (above 100°F)
- 7 days/yr
- Hot days in 30 yrs
- 26 days/yr
Wind risk 1/10 · Minimal
- Chance of severe wind over 30 yrs
- —
Air-quality risk 2/10 · Minimal
- Unhealthy air days now
- 1 days/yr
- Unhealthy air days in 30 yrs
- 1 days/yr
Risk factors via First Street. Map © Google.
Why this score? — see what drove the C grade
The composite is a weighted blend of 9 inputs, each scored 0–100. Each bar is that input's sub-score; the figure is the points it added to the 100-point composite (weight × sub-score).
- Cash flow +19.6/30.0
- ARV discount +7.5/15.0
- 1% rule +6.7/10.0
- Appreciation +6.3/10.0
- DSCR +6.2/10.0
- Livability +3.0/5.0
- Schools +2.9/10.0
- Rent growth +2.5/5.0
- Condition / age +2.5/5.0
$179,999
🖨 Deal sheet (PDF) 📄 Offer letter ✓ Due diligence
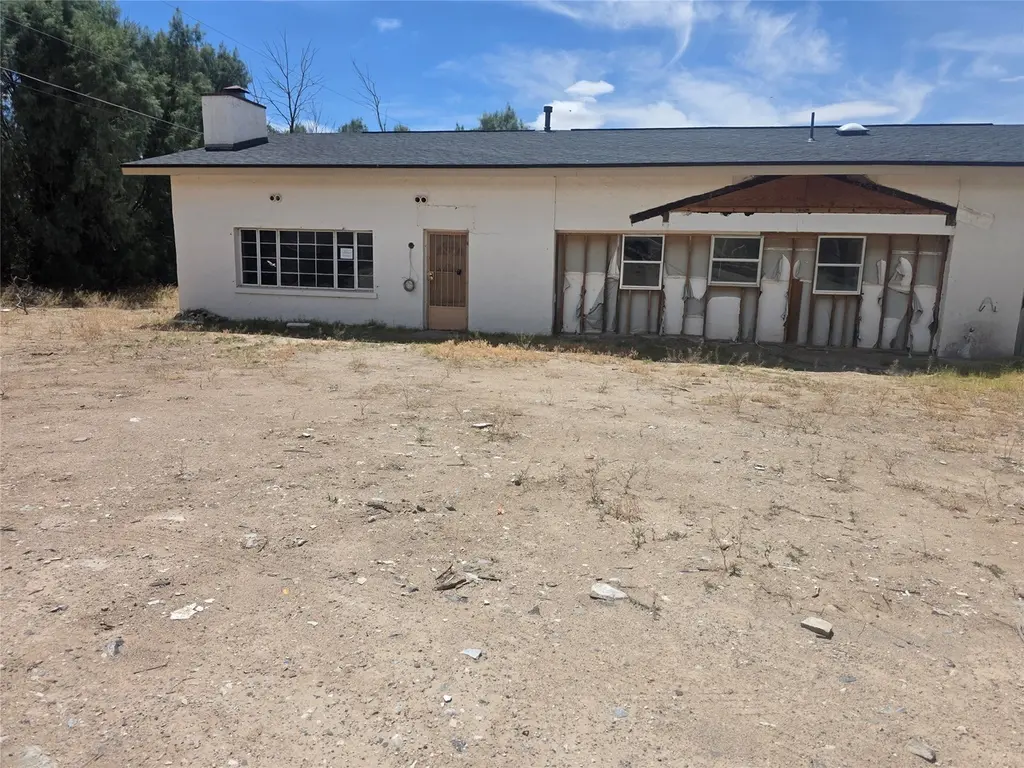
Listing remarks MLS
LARGE FOUR BEDROOM HOME! We just listed this large home that features 4 bedrooms and 2 baths. This location has easy access to I-10 and is close to New Mexico. This hoe needs some work and is being sold AS IS, but it does have a new roof and a lot of potential. WE MAKE IT EASY TO OWN. This is a great opportunity! Don't wait, call us today to get more information on the owner's easy terms and smooth process that may be able to put the deed in your name and make this your dream home.
Key facts
- A lot of potential
- Easy access to i-10
- New roof
Tags
Neighborhood map
What this means for you Summary
Snapshot
- This is a 4-bed/1.0-bath single-family listed at $180k.
Deal economics
- At list price, monthly cash flow is $207 ($2k/yr) — positive.
- The deal already cash-flows at list — no discount required.
- Meets the 1% rule at list price ($2k rent vs $180k).
- Recommended offer: $158k (12.0% below list) — sets the bar for market timing.
Location & tenants
- Location reads 59/100 on livability (#1,135 in TX) — a working-class tenant base; expect higher turnover. Strengths: cost of living A+, housing A+, crime A-; Watch: amenities F, commute F, employment D-.
- Canutillo ISD (other): math 28% / reading 39% proficiency, ranked #542 of 826 in TX (top 66%) — families likely to look elsewhere, expect single-tenant / working-renter base with shorter leases; 71% free/reduced lunch — lower-income household profile, screen leases tightly.
- Zoned schools: Bill Childress El (math 22% / reading 32%, grade F, #2,791 of 4,322 statewide, top 68%, 401 students, 77% FRL); Canutillo Middle (math 21% / reading 34%, grade F, #1,156 of 1,662 statewide, top 71%, 700 students, 64% FRL); Canutillo H S (math 36% / reading 41%, grade F, #866 of 1,632 statewide, top 54%, 1,642 students, 65% FRL) — zoned schools at 69% FRL track the district average.
- Market conditions: 32 active listings in the ZIP; 2 comparable units currently listed for rent nearby; 2,196 units permitted in El Paso County in 2024 (143 in 5+ unit buildings).
Forward outlook
- In year one you build about $6k of equity ($1k loan paydown + $5k appreciation (2.7% local appreciation)).
- El Paso County population projected at +10% by 2050 — modest demand growth; plan on rents tracking national, not racing it.
- At projected returns (2.7% appreciation + 3.0% rent growth), your $50k cash investment doubles in ~6 years — after that, you're playing with house money.
- By year 6, paydown + projected appreciation supports a ~$32k cash-out refi (75% LTV) — recoverable capital for the next deal without selling this one.
Negotiation context
- It's been on market 347 days — a 12% lower offer ($158k) is reasonable based on typical stale-listing flexibility.
- 3 sale attempts since 4y ago with the ask held roughly flat each time — persistent listings suggest the price (not the market) is what's stuck; bring a comps-based counter.
- Current owner paid $66k; list at $180k implies a 173% gain — meaningful room to come down on a strong offer.
Risks & watch-outs
- Watch-outs: property tax is 2.9% of price.
- Climate carrying-cost: extreme-heat days projected 7→26/yr by 2055 (HVAC capex compounding) — expect insurance premiums to compound above CPI over the hold.
Questions for the listing agent
- It's been on market 347 days. Have you received any prior offers? Is the seller open to a 12% concession, seller financing, or rate buy-down credit?
- Property tax is high relative to price — has the assessment been appealed recently, and will the sale trigger a re-assessment?
- Why hasn't it sold? Are there any deal-killer items the seller is aware of (foundation, flood, title, zoning, code violations)?
- Is there a deadline driving the sale (1031 exchange, divorce, estate, relocation)? That informs how much negotiation room exists.
- Schools are F-rated, which usually means shorter tenancies and higher turnover. Who's the typical renter profile here, and what's been the actual vacancy rate?
- What's the average days-on-market for RENTAL listings here right now (not sales)? A rising rental-DOM trend means longer vacancies and softer asking-rent achievability than the comps imply.
- What's the recent tenant-quality profile in this submarket — average credit score on applications, eviction rate, late-payment / NSF rate, and stable-employment percentage? A property-management company in the area should have these aggregated.
- How much new for-sale + rental construction is in the pipeline within 1–3 miles? Heavy new supply typically softens prices + rents 12–24 months out; constrained supply supports both.
Investment metrics
- 1% rule
- 1.17% ✓
- Cap rate
- 7.67%
- Cash-on-cash
- 4.92%
- DSCR
- 1.22
- GRM
- 7.1
CMA / ARV
No comps found within radius.
Projected returns pro-forma
2.69% appreciation · 3.0% rent growth · sell at horizon
- IRR
- 11.3%
- Equity multiple
- 1.64×
- Total profit
- $32,052
- Equity at exit
- $77,793
- IRR
- 13.7%
- Equity multiple
- 2.98×
- Total profit
- $99,632
- Equity at exit
- $117,500
Cash invested: $50,400 (down + closing). Projections, not guarantees.
Landlord ↔ Tenant lean methodology
- Overall (STATE)
- 87 Strongly Landlord-Friendly
- State Texas
- 87 Strongly Landlord-Friendly · R+5
- County
- — inherits STATE
- City
- — inherits STATE
ZIP-level market 79821
- Home prices YoY
- 1.3%
- Active inventory
- 32
- Price-to-rent
- 7.1×
Monthly cashflow live
- Estimated rent
- $2,108 medium interval (Pro) →
- Mortgage (P&I)
- −$944
- Tax from tax record
- −$439 /mo · $5,274/yr
- Insurance
- −$75
- HOA
- −$0
- Vacancy / Maint / Mgmt
- −$443
- Net cashflow
- $207
Break-even live
Sensitivity live
| Price | -10% $308 | -5% $258 | +0% $207 | +5% $156 | +10% $105 |
|---|---|---|---|---|---|
| Rent | -10% $40 | -5% $123 | +0% $207 | +5% $290 | +10% $373 |
| Rate | -1.0pp $297 | -0.5pp $252 | base $207 | +0.5pp $160 | +1.0pp $113 |
UW: 25.0% down · 7.5% · 30yr · 1.5% tax · 5.0% vac · 8.0% maint · 8.0% mgmt
Financing live
Cash to close
- Down payment
- $45,000
- Closing costs
- $5,400
- Reserves months
- —
- Total cash needed
- —
Loan-product check · same deal, 3 products live
Conventional
25% down · 7.5% · 30yr
- Down + closing
- —
- Monthly P&I
- —
- Monthly cashflow
- —
- DSCR
- —
- Eligible?
- —
Personal DTI + credit; lowest rate.
DSCR
20% down · 8.5% · 30yr
- Down + closing
- —
- Monthly P&I
- —
- Monthly cashflow
- —
- DSCR
- —
- Eligible?
- —
No personal income docs; deal must DSCR.
Hard money
10% down · 12.0% · 12mo
- Down + closing
- —
- Monthly P&I
- —
- Monthly cashflow
- —
- DSCR
- —
- Eligible?
- —
Short-term bridge; refi at stabilization.
Rent comps 2 comps
| Address | Beds | Baths | Sqft | Rent | $/sqft | DOM | Units | Dist |
|---|---|---|---|---|---|---|---|---|
| 355 Sol Ct Vinton, TX | 4.0 | 3.0 | 1932 | $2,100 | $1.09 | 25d | 1 | 0.09mi |
| 7409 Scarlet Oak Pl Canutillo, TX | 4.0 | 3.0 | 1920 | $2,200 | $1.15 | 45d | 1 | 1.21mi |
Listing history 14 events
-
2025-06-09$179,999 Active 486-char remark
Show marketing remark (486 chars)
LARGE FOUR BEDROOM HOME! We just listed this large home that features 4 bedrooms and 2 baths. This location has easy access to I-10 and is close to New Mexico. This hoe needs some work and is being sold AS IS, but it does have a new roof and a lot of potential. WE MAKE IT EASY TO OWN. This is a great opportunity! Don't wait, call us today to get more information on the owner's easy terms and smooth process that may be able to put the deed in your name and make this your dream home.
-
2022-12-21historical
-
2022-11-26price $140,000
-
2022-09-14price $155,000
-
2022-07-08price $165,000
-
2022-06-28price $168,800
-
2022-06-09$170,000 Active
-
2022-05-02historical
-
2022-02-28$180,000 Active
-
2022-02-23soldstatus
-
2020-09-25soldstatus
-
2002-04-02soldstatus
-
1994-12-13soldstatus
-
1991-03-06soldstatus $65,900
ⓘ Source: listings_history table (triggers on properties + properties_extension) + one-shot
backfill from property_details.listing_events for pre-trigger history.
Tax reassessment forecast TX · Resets to sale price
- Current annual tax
- $5,274 · $439/mo
- Projected year-2 tax
- $5,274 · $439/mo
- Expected delta
- $0/yr ($0/mo · 0.0%)
ⓘ Screening estimate from a state-policy table — verify with the county assessor before closing.
Climate risk First Street
- Flood 1/10 Low FEMA zone X · 0% chance over 30 yrs
- Wildfire 4/10 Moderate
- Heat 6/10 Major 7 d/yr ≥100°F today · 26 d/yr by 30 yrs out
- Wind 1/10 Low
- Air quality 2/10 Low 1 unhealthy d/yr today · 1 by 30 yrs out
Nearby sold comps map
Loading sold comps map…
Walkable amenities ~0.75 mi
Loading nearby amenities…
Taxation est. · year 1
- Rental income
- $25,291
- − Mortgage interest
- −$10,083
- − Property taxes
- −$5,274
- − Insurance
- −$900
- − Repairs & maintenance
- −$2,023
- − Management
- −$2,023
- − Depreciation
- −$5,236
- Taxable loss
- −$248
- Est. tax savings @ 24.0%
- +$60
- After-tax cash flow
- $2,539/yr
For passive investors: Depreciation is non-cash, so a rental often shows a tax loss while cash-flowing — sheltering income. Rental losses are passive: they offset passive income freely, and up to $25,000/yr can offset ordinary (W-2) income if you actively participate and your MAGI is under $100k (phasing out to $0 by $150k); unused losses carry forward. On sale, claimed depreciation is recaptured at up to 25%, and gains may owe capital-gains tax (a 1031 exchange can defer both). Figures are a year-1 estimate at your 24.0% rate — not tax advice; consult a CPA.
Schools (NCES district)
- District
- Canutillo ISD
- NCES district ID
- 4812780
- Math proficiency
- 28% ▼ -23.00%
- Reading proficiency
- 39% ▼ -7.00%
- Median HH income
- $48,327
- Composite
- 28.91/100
- National rank
- #6636
- State rank
- #542 of 826 in TX
Livability — Vinton
- Score
- 59/100
- State rank
- #1135
- US rank
- #20035
Category grades
Schools grade is shown separately in the Schools card above.
Census & demographics
- Census place
- Vinton, TX
- Population (ZIP)
- 6,550
Population outlook (El Paso County) Hauer SSP2
- Today (2025)
- 897,899 people
- By 2030
- 922,694 · +2.8%
- By 2040
- 960,492 · +7.0%
- By 2050
- 982,919 · +9.5%
- By 2075
- 997,266 · +11.1%
- By 2100
- 900,630 · +0.3%
Race, ethnicity, and origin ACS 2023
- Neighborhood character
- Predominantly Hispanic (88%)
- Race & ethnicity
- Hispanic / Latino 88% Two or more races 28% White 8% Black 1%
- Hispanic origin (detail)
- Mexican 78%
- Foreign-born
- 26% · Canada
- Languages at home
- 25% English-only · Spanish 74%
Political lean MEDSL · El Paso
- 2024 margin
- D (+15.1) · D 57.0% · R 41.8% · Other 1.2%
- 2008→2024 swing
- -17.4pp toward R · 2008: 32.5pp · 2024: 15.1pp
- All cycles
- 2024: D+15.1 2020: D+35.1 2016: D+43.2 2012: D+32.6 2008: D+32.5
Not yet ingested
- Civics
- —
Market trends
- HPI YoY
- ▲ 2.69%
- Current HPI
- 207.1199
- Rent YoY
- —
- Metro
- —
- State GDP YoY
- ▲ 3.95%
- F500 in state
- 110
Industry mix (Fortune 500 HQ in TX)
| Industry | F500 HQs | Revenue |
|---|---|---|
| Energy | 16 | $1,198B |
|
||
| Technology | 5 | $198B |
|
||
| Engineering / Construction | 4 | $72B |
|
||
| Energy Services | 3 | $60B |
|
||
| Utilities | 3 | $41B |
|
||
| Healthcare | 2 | $330B |
|
||
Price history
+173.1% since first listed14 events — show timeline
- 2025-06-09 Listed $179,999 HARMLS
- 2022-12-21 Listing Removed — GEPARMLS
- 2022-11-26 Price Changed $140,000 GEPARMLS
- 2022-09-14 Price Changed $155,000 GEPARMLS
- 2022-07-08 Price Changed $165,000 GEPARMLS
- 2022-06-28 Price Changed $168,800 GEPARMLS
- 2022-06-09 Listed $170,000 GEPARMLS
- 2022-05-02 Listing Removed — GEPARMLS
- 2022-02-28 Listed $180,000 GEPARMLS
- 2022-02-23 Sold (Public Records) — Public Records
- 2020-09-25 Sold (Public Records) — Public Records
- 2002-04-02 Sold (Public Records) — Public Records
- 1994-12-13 Sold (Public Records) — Public Records
- 1991-03-06 Sold (Public Records) $65,900 Public Records
Property tax history
+4.1%/yrLatest (2025): $5,274 · -19.7% YoY. Source: county tax records.
Cash-flow waterfall
monthlySold comps — $/sqft
last 12 mo · ≤1 miLoading sold comps…