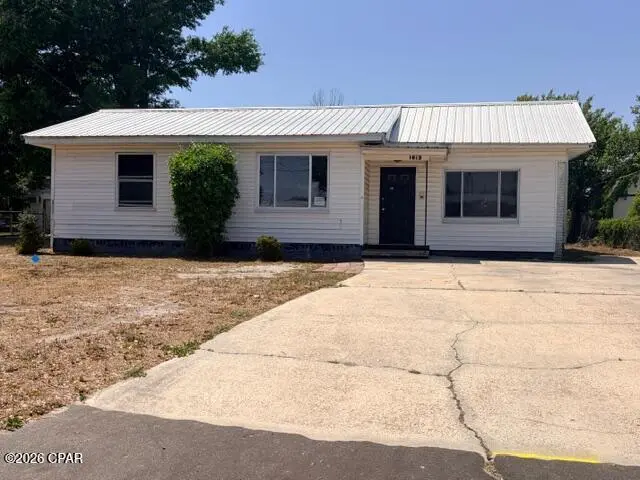
1613 Arthur Ave · Panama City, FL
Flood risk 1/10 · Minimal
- FEMA flood zone
- X (unshaded)
- Chance of flooding over 30 yrs
- 0.0%
- Est. flood insurance / yr
- $507 – $1,088
Fire risk 1/10 · Minimal
- Est. fire insurance / yr
- $947 – $1,759
Heat risk 10/10 · Severe
- Hot days now (above 106°F)
- 7 days/yr
- Hot days in 30 yrs
- 21 days/yr
Wind risk 9/10 · Severe
- Chance of severe wind over 30 yrs
- 99.0%
Air-quality risk 1/10 · Minimal
- Unhealthy air days now
- 0 days/yr
- Unhealthy air days in 30 yrs
- 0 days/yr
Risk factors via First Street. Map © Google.
Why this score? — see what drove the B+ grade
The composite is a weighted blend of 9 inputs, each scored 0–100. Each bar is that input's sub-score; the figure is the points it added to the 100-point composite (weight × sub-score).
- Cash flow +30.0/30.0
- ARV discount +15.0/15.0
- DSCR +10.0/10.0
- 1% rule +8.4/10.0
- Schools +4.3/10.0
- Livability +3.6/5.0
- Rent growth +2.8/5.0
- Condition / age +2.5/5.0
- Appreciation +0.0/10.0
$165,000
🖨 Deal sheet (PDF) 📄 Offer letter ✓ Due diligence
Listing remarks MLS
Don't miss this opportunity to own right in the middle of Panama City, in St Andrews area, and only 13 minutes to the beaches. St. Andrews is vibrant with restaurants, businesses, marina, etc and this home is just as convenient to downtown and all that is offered. There are 4 bedrooms and 2 full baths, with a 3rd bath that has been gutted and is ready for remodel. The back yard is partially fenced and a great place for enjoying get-togethers, cookouts, ballgames, with the large screened porch across the rear of the home.
Key facts
- Large screened porch
- 0.23 acre lot
- Built 1953
Tags
Neighborhood map
What this means for you Summary
Snapshot
- This is a 4-bed/3.0-bath single-family listed at $165k.
Deal economics
- At list price, monthly cash flow is $727 ($9k/yr) — positive.
- The deal already cash-flows at list — no discount required.
- Meets the 1% rule at list price ($2k rent vs $165k).
- Recommended offer: $160k (3.0% below list) — sets the bar for market timing.
- Cap rate 11.6% vs local median 4.7% in Panama City — top-decile yield for the area; either an underpriced asset or a hidden risk that comps aren't pricing in. Stress-test before assuming the spread holds.
Location & tenants
- Location reads 72/100 on livability (#350 in FL) — a middle-class / working-renter tenant base. Strengths: cost of living A+, housing A+, health & safety A+; Watch: crime F, amenities F, commute F.
- Bay (suburban): math 51% / reading 51% proficiency, ranked #29 of 73 in FL (top 40%) — acceptable for families but not a draw, mixed tenant base, ~2y average lease.
- Market conditions: Rents rising (+1.2%/yr); 381 active listings in the ZIP; 5 comparable units currently listed for rent nearby; rentals at typical pace (median 14d on market — plan ~3-4 weeks tenant-placement turnaround); 2,473 units permitted in Bay County in 2024 (559 in 5+ unit buildings).
- This rent runs 36% of the median local income ($73k/yr) — at the standard rent-burdened threshold; future hikes will face affordability resistance.
Forward outlook
- Local home prices are declining (-3.0%/yr); year-one equity from $1k of loan paydown is wiped out by about $5k of value loss. Plan a longer hold.
- Bay County population projected at +24% by 2050 — long-run rental-demand tailwind backs the buy-and-hold thesis.
- At projected returns (-3.0% appreciation + 1.2% rent growth), your $46k cash investment doubles in ~8 years — after that, you're playing with house money.
Negotiation context
- It's been on market 42 days — a 3% lower offer ($160k) is reasonable based on typical stale-listing flexibility.
- Current owner paid $63k; list at $165k implies a 162% gain — meaningful room to come down on a strong offer.
Risks & watch-outs
- Watch-outs: built in 1953 — expect roof / HVAC / electrical / plumbing capex.
- Climate carrying-cost: severe wind risk, 99% chance of damaging wind over 30y; extreme-heat days projected 7→21/yr by 2055 (HVAC capex compounding) — expect insurance premiums to compound above CPI over the hold.
Questions for the listing agent
- It's been on market 42 days. Have you received any prior offers? Is the seller open to a 3% concession, seller financing, or rate buy-down credit?
- Built in 1953 — when were the roof, HVAC, electrical panel, plumbing, and water heater last replaced?
- Is there a deadline driving the sale (1031 exchange, divorce, estate, relocation)? That informs how much negotiation room exists.
- Schools are B-rated — typically a magnet for longer-tenancy family renters. What's the average tenant stay here, and is there a school-zone premium baked into asking?
- Crime grade is F in this area — have there been break-ins, vandalism, or insurance claims at this property in the last 3 years? What carrier currently insures it and at what premium?
- What's the average days-on-market for RENTAL listings here right now (not sales)? A rising rental-DOM trend means longer vacancies and softer asking-rent achievability than the comps imply.
- What's the recent tenant-quality profile in this submarket — average credit score on applications, eviction rate, late-payment / NSF rate, and stable-employment percentage? A property-management company in the area should have these aggregated.
- How much new for-sale + rental construction is in the pipeline within 1–3 miles? Heavy new supply typically softens prices + rents 12–24 months out; constrained supply supports both.
Investment metrics
- 1% rule
- 1.34% ✓
- Cap rate
- 11.58%
- Cash-on-cash
- 18.88%
- DSCR
- 1.84
- GRM
- 6.2
CMA / ARV
- ARV (median comp)
- $274,794
- List price
- $165,000
- Delta
- -39.96%
- Verdict
- UNDERPRICED
- Comps
- 20 within 1.0 mi
Show comp detail 12 sales within ~0.75 mi
| Address | Dist | Beds/Ba | Sqft | Sold | Price | $/sf | Match |
|---|---|---|---|---|---|---|---|
| 1509 Foster Ave | 0.17mi | 3/2.0 (-1) | 1,814 (-6%) | 7mo | $328,000 | $181 | 67 |
| 2606 W 20th St | 0.46mi | 4/2.5 | 1,893 (-2%) | 8mo | $282,000 | $149 | 66 |
| 1522 Fountain Ave | 0.36mi | 3/2.0 (-1) | 1,855 (-4%) | 5mo | $120,000 | $65 | 63 |
| 2205 W 14th St | 0.38mi | 3/2.5 (-1) | 2,082 (+8%) | 2mo | $340,000 | $163 | 61 |
| 1613 Friendship Ave | 0.50mi | 4/3.0 | 1,816 (-6%) | 10mo | $285,000 | $157 | 59 |
| 2510 W 18th St | 0.20mi | 3/2.0 (-1) | 2,112 (+9%) | 10mo | $150,000 | $71 | 58 |
| 2009 Clay Ave | 0.50mi | 4/2.0 | 1,872 (-3%) | 19mo | $305,000 | $163 | 52 |
| 2124 Hentz Dr | 0.67mi | 4/2.0 | 1,905 (-1%) | 17mo | $295,000 | $155 | 49 |
| 1301 Oakland Dr | 0.51mi | 4/2.0 | 1,674 (-13%) | 7mo | $200,000 | $119 | 44 |
| 1411 Chestnut Ave | 0.44mi | 3/3.5 (-1) | 1,680 (-13%) | 12mo | $372,000 | $221 | 41 |
| 1325 Fairland Ave | 0.67mi | 3/2.5 (-1) | 1,646 (-15%) | 6mo | $289,500 | $176 | 32 |
| 1710 W 12th St | 0.74mi | 3/2.0 (-1) | 2,184 (+13%) | 20mo | $220,000 | $101 | 18 |
Match score weights: distance 35% · size 25% · config 20% · recency 20%. Top-matched comps best support the ARV.
Projected returns pro-forma
-3.0% appreciation · 1.24% rent growth · sell at horizon
- IRR
- 8.8%
- Equity multiple
- 1.34×
- Total profit
- $15,680
- Equity at exit
- $24,602
- IRR
- 16.6%
- Equity multiple
- 2.25×
- Total profit
- $57,900
- Equity at exit
- $14,266
Cash invested: $46,200 (down + closing). Projections, not guarantees.
Landlord ↔ Tenant lean methodology
- Overall (STATE)
- 87 Strongly Landlord-Friendly
- State Florida
- 87 Strongly Landlord-Friendly · R+3
- County
- — inherits STATE
- City
- — inherits STATE
ZIP-level market 32405
- Rents YoY
- 1.2%
- Active inventory
- 381
- Price-to-rent
- 6.2×
Monthly cashflow live
- Estimated rent
- $2,203 high interval (Pro) →
- Mortgage (P&I)
- −$865
- Tax from tax record
- −$80 /mo · $955/yr
- Insurance
- −$69
- HOA
- −$0
- Vacancy / Maint / Mgmt
- −$463
- Net cashflow
- $727
Break-even live
Sensitivity live
| Price | -10% $820 | -5% $774 | +0% $727 | +5% $680 | +10% $633 |
|---|---|---|---|---|---|
| Rent | -10% $553 | -5% $640 | +0% $727 | +5% $814 | +10% $901 |
| Rate | -1.0pp $810 | -0.5pp $769 | base $727 | +0.5pp $684 | +1.0pp $641 |
UW: 25.0% down · 7.5% · 30yr · 1.5% tax · 5.0% vac · 8.0% maint · 8.0% mgmt
Financing live
Cash to close
- Down payment
- $41,250
- Closing costs
- $4,950
- Reserves months
- —
- Total cash needed
- —
Loan-product check · same deal, 3 products live
Conventional
25% down · 7.5% · 30yr
- Down + closing
- —
- Monthly P&I
- —
- Monthly cashflow
- —
- DSCR
- —
- Eligible?
- —
Personal DTI + credit; lowest rate.
DSCR
20% down · 8.5% · 30yr
- Down + closing
- —
- Monthly P&I
- —
- Monthly cashflow
- —
- DSCR
- —
- Eligible?
- —
No personal income docs; deal must DSCR.
Hard money
10% down · 12.0% · 12mo
- Down + closing
- —
- Monthly P&I
- —
- Monthly cashflow
- —
- DSCR
- —
- Eligible?
- —
Short-term bridge; refi at stabilization.
Rent comps 5 comps
| Address | Beds | Baths | Sqft | Rent | $/sqft | DOM | Units | Dist |
|---|---|---|---|---|---|---|---|---|
| 2602 W 12th St Panama City, FL | 3.0 | 2.0 | 1400 | $2,095 | $1.50 | 22d | 1 | 0.63mi |
| 1113 Arthur Ave Panama City, FL | 3.0 | 2.5 | 2000 | $2,295 | $1.15 | 22d | 1 | 0.66mi |
| 1827 Balboa Ave Panama City, FL | 3.0 | 2.5 | 1440 | $1,800 | $1.25 | 14d | 1 | 1.20mi |
| 1007 W 10th Ct Panama City, FL | 3.0 | 3.0 | 2046 | $2,600 | $1.27 | 14d | 1 | 1.41mi |
| 4324 W 20th St Panama City, FL | 1.0–3.0 | 1.0–2.5 | 1000 | $1,630 | $1.63 | 14d | 12 | 1.49mi |
Listing history 7 events
-
2026-06-02status $165,000 Pending 42 DOM
-
2026-06-01days on market $165,000 Active 42 DOM
-
2026-05-31days on market $165,000 Active 41 DOM
-
2026-05-30days on market $165,000 Active 40 DOM
-
2026-04-18$165,000 Active 526-char remark
Show marketing remark (526 chars)
Don't miss this opportunity to own right in the middle of Panama City, in St Andrews area, and only 13 minutes to the beaches. St. Andrews is vibrant with restaurants, businesses, marina, etc and this home is just as convenient to downtown and all that is offered. There are 4 bedrooms and 2 full baths, with a 3rd bath that has been gutted and is ready for remodel. The back yard is partially fenced and a great place for enjoying get-togethers, cookouts, ballgames, with the large screened porch across the rear of the home.
-
1995-03-01soldstatus $63,000
-
1985-11-01soldstatus $44,500
ⓘ Source: listings_history table (triggers on properties + properties_extension) + one-shot
backfill from property_details.listing_events for pre-trigger history.
Tax reassessment forecast FL · Resets to sale price
- Current annual tax
- $955 · $80/mo
- Projected year-2 tax
- $1,370 · $114/mo
- Expected delta
- +$414/yr (+$35/mo · 43.4%)
ⓘ Screening estimate from a state-policy table — verify with the county assessor before closing.
Climate risk First Street
- Flood 1/10 Low FEMA zone X (unshaded) · 0% chance over 30 yrs
- Wildfire 1/10 Low
- Heat 10/10 Extreme 7 d/yr ≥106°F today · 21 d/yr by 30 yrs out
- Wind 9/10 Extreme 99% chance of damaging wind over 30 yrs
- Air quality 1/10 Low 0 unhealthy d/yr today · 0 by 30 yrs out
Nearby sold comps map
Loading sold comps map…
Walkable amenities ~0.75 mi
Loading nearby amenities…
Taxation est. · year 1
- Rental income
- $26,438
- − Mortgage interest
- −$9,243
- − Property taxes
- −$955
- − Insurance
- −$825
- − Repairs & maintenance
- −$2,115
- − Management
- −$2,115
- − Depreciation
- −$4,800
- Taxable income
- $6,385
- Est. tax owed @ 24.0%
- −$1,533
- After-tax cash flow
- $7,190/yr
For passive investors: Depreciation is non-cash, so a rental often shows a tax loss while cash-flowing — sheltering income. Rental losses are passive: they offset passive income freely, and up to $25,000/yr can offset ordinary (W-2) income if you actively participate and your MAGI is under $100k (phasing out to $0 by $150k); unused losses carry forward. On sale, claimed depreciation is recaptured at up to 25%, and gains may owe capital-gains tax (a 1031 exchange can defer both). Figures are a year-1 estimate at your 24.0% rate — not tax advice; consult a CPA.
Schools (NCES district)
- District
- Bay
- NCES district ID
- 1200090
- Math proficiency
- 51% ▼ -8.00%
- Reading proficiency
- 51% ▼ -7.00%
- Median HH income
- $47,740
- Composite
- 43.41/100
- National rank
- #3014
- State rank
- #29 of 73 in FL
Livability — Panama City
- Score
- 72/100
- State rank
- #350
- US rank
- #5823
Category grades
Schools grade is shown separately in the Schools card above.
Census & demographics
- Census place
- Panama City, FL
- County
- Bay County · 163,593 people
- City population
- 91,445
- Metro
- Panama City, FL
- Population (ZIP)
- 29,984
- Household income
- $73,373
- Rent vs Own
- Severe rent burden
- 1008.0
Population outlook (Bay County) Hauer SSP2
- Today (2025)
- 206,264 people
- By 2030
- 217,740 · +5.6%
- By 2040
- 238,738 · +15.7%
- By 2050
- 255,545 · +23.9%
- By 2075
- 288,295 · +39.8%
- By 2100
- 288,638 · +39.9%
Race, ethnicity, and origin ACS 2023
- Neighborhood character
- Predominantly White (67%)
- Race & ethnicity
- White 67% Black 17% Two or more races 8% Hispanic / Latino 7% Native American 1%
- Hispanic origin (detail)
- Mexican 2% Puerto Rican 3%
- Common ancestry
- Slovak 4% Lithuanian 2% Romanian 2%
- Foreign-born
- 7% · Canada
- Languages at home
- 89% English-only · Spanish 6% Arabic 1% French/Haitian/Cajun 1%
Political lean MEDSL · Bay
- 2024 margin
- Solid R (+47.4) · D 25.8% · R 73.1% · Other 1.1%
- 2008→2024 swing
- -6.6pp toward R · 2008: -40.7pp · 2024: -47.4pp
- All cycles
- 2024: R+47.4 2020: R+43.5 2016: R+46.3 2012: R+43.6 2008: R+40.7
Not yet ingested
- Civics
- —
Market trends
- HPI YoY
- ▼ -217.88%
- Current HPI
- 262.7854
- Rent YoY
- ▲ 1.24%
- Metro
- Panama City, FL
- State GDP YoY
- ▲ 3.28%
- F500 in state
- 36
Industry mix (Fortune 500 HQ in FL)
| Industry | F500 HQs | Revenue |
|---|---|---|
| Industrial Technology | 2 | $29B |
|
||
| Insurance | 2 | $17B |
|
||
| Retail | 1 | $60B |
|
||
| Technology Distribution | 1 | $58B |
|
||
| Homebuilding | 1 | $35B |
|
||
| Technology Manufacturing | 1 | $35B |
|
||
Price history
+270.8% since first listed3 events — show timeline
- 2026-04-18 Listed $165,000 CPARMLS
- 1995-03-01 Sold (Public Records) $63,000 Public Records
- 1985-11-01 Sold (Public Records) $44,500 Public Records
Property tax history
+3.7%/yrLatest (2025): $955 · +3.9% YoY. Source: county tax records.
Cash-flow waterfall
monthlySold comps — $/sqft
last 12 mo · ≤1 miLoading sold comps…