 🏗️ New Construction
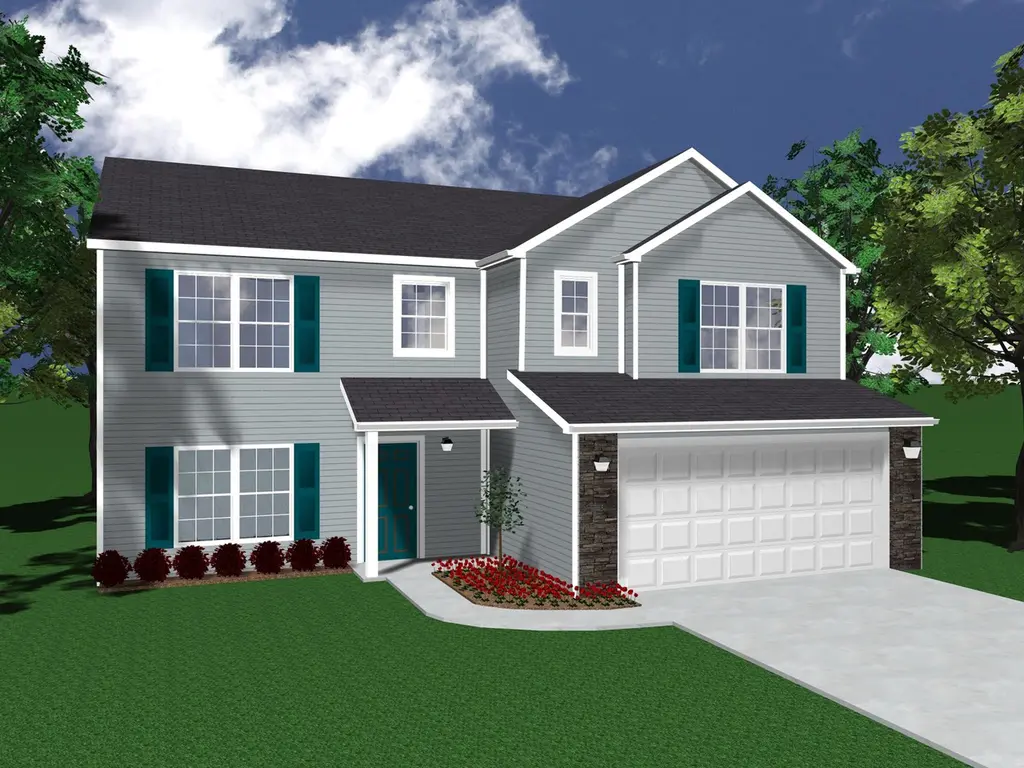
Lancia's Chesapeake I Plan · Huntertown, IN
Flood risk No data
- FEMA flood zone
- —
- Chance of flooding over 30 yrs
- —
- Est. flood insurance / yr
- —
Fire risk No data
- Est. fire insurance / yr
- —
Heat risk No data
- Hot days now (above threshold)
- —
- Hot days in 30 yrs
- —
Wind risk No data
- Chance of severe wind over 30 yrs
- —
Air-quality risk No data
- Unhealthy air days now
- —
- Unhealthy air days in 30 yrs
- —
Risk factors via First Street. Map © Google.
Why this score? — see what drove the F grade
The composite is a weighted blend of 9 inputs, each scored 0–100. Each bar is that input's sub-score; the figure is the points it added to the 100-point composite (weight × sub-score).
- ARV discount +7.5/15.0
- Cash flow +6.2/30.0
- Schools +4.9/10.0
- Rent growth +4.4/5.0
- Livability +3.5/5.0
- 1% rule +1.6/10.0
- Condition / age +1.0/5.0
- DSCR +0.6/10.0
- Appreciation +0.0/10.0
$247,100
🖨 Deal sheet 📄 Offer letter ✓ Due diligence
Listing remarks MLS
THIS IS A SAMPLE PLAN - THIS IS NOT A HOME FOR SALE. Lancia's Chesapeake I is a lot of home for your money with 4 Bedrooms, 2.5 Baths, Office, Laundry upstairs and plenty of storage! Lancia Homes offers many different floor plan options to choose from, visit our website or call our office to see all current floor plans. * Base price does not include land
Key facts
- 2 parking spots
- Listed 300 days
Neighborhood map
What this means for you Summary
Snapshot
- This is a 4-bed/2.5-bath single-family listed at $247k. Condition is rated poor.
Deal economics
- At list price, monthly cash flow is $-658 ($-8k/yr) — negative.
- The deal already cash-flows at list — no discount required.
- To meet the 1% rule (rent ≥ 1% of price), the offer needs to be $242k (2.1% below list).
- Recommended offer: $217k (12.0% below list) — sets the bar for market timing.
Location & tenants
- Location reads 70/100 on livability (#159 in IN) — a middle-class / working-renter tenant base. Strengths: employment A+, cost of living A+, housing A+; Watch: amenities F, commute F, health & safety F.
- Northwest Allen County Schools (rural): math 51% / reading 58% proficiency, ranked #25 of 301 in IN (top 8%) — acceptable for families but not a draw, mixed tenant base, ~2y average lease; only 11% free/reduced lunch — higher-income household profile.
- Market conditions: Rents rising fast (+7.6%/yr); 327 active listings in the ZIP; 3 comparable units currently listed for rent nearby; rentals leasing fast (median 14d on market — plan ~1-2 weeks tenant-placement turnaround); solid renter incomes; 1,861 units permitted in Allen County in 2024 (576 in 5+ unit buildings).
- This rent runs 36% of the median local income ($81k/yr) — at the standard rent-burdened threshold; future hikes will face affordability resistance.
Forward outlook
- Local home prices are declining (-3.0%/yr); year-one equity from $3k of loan paydown is wiped out by about $11k of value loss. Plan a longer hold.
- Allen County population projected at +10% by 2050 — modest demand growth; plan on rents tracking national, not racing it.
Negotiation context
- It's been on market 300 days — a 12% lower offer ($217k) is reasonable based on typical stale-listing flexibility.
Questions for the listing agent
- What do current leases actually rent for vs. the listed asking? Can we see a recent rent roll and the last 12 months of T-12 income?
- It's been on market 300 days. Have you received any prior offers? Is the seller open to a 12% concession, seller financing, or rate buy-down credit?
- Have any recent inspections been done? Can we get a copy of the seller's disclosures and any deferred-maintenance estimates?
- What does the HOA fee cover, when was the last increase, and are there any pending special assessments or reserve-fund shortfalls?
- Why hasn't it sold? Are there any deal-killer items the seller is aware of (foundation, flood, title, zoning, code violations)?
- Is there a deadline driving the sale (1031 exchange, divorce, estate, relocation)? That informs how much negotiation room exists.
- The area grade is low — what's the realistic commute time and amenity access for the typical tenant pool here? Any planned neighborhood developments (good or bad) we should know about?
- What's the average days-on-market for RENTAL listings here right now (not sales)? A rising rental-DOM trend means longer vacancies and softer asking-rent achievability than the comps imply.
- What's the recent tenant-quality profile in this submarket — average credit score on applications, eviction rate, late-payment / NSF rate, and stable-employment percentage? A property-management company in the area should have these aggregated.
- How much new for-sale + rental construction is in the pipeline within 1–3 miles? Heavy new supply typically softens prices + rents 12–24 months out; constrained supply supports both.
Investment metrics
- 1% rule
- 0.66% ✗
- Cap rate
- 4.13%
- Cash-on-cash
- -7.72%
- DSCR
- 0.66
- GRM
- 12.6
CMA / ARV
- ARV (median comp)
- $365,299
- List price
- $247,100
- Delta
- -32.36%
- Verdict
- UNDERPRICED
- Comps
- 20 within 1.0 mi
Show comp detail 12 sales within ~0.75 mi
| Address | Dist | Beds/Ba | Sqft | Sold | Price | $/sf | Match |
|---|---|---|---|---|---|---|---|
| 5207 Mountain Sky Cv | 0.08mi | 4/2.5 | 1,900 (-4%) | 2mo | $338,000 | $178 | 89 |
| 5029 Whittlebury Dr | 0.28mi | 4/2.5 | 1,938 (-2%) | 1mo | $352,900 | $182 | 83 |
| 5116 Mountain Sky Cv | 0.08mi | 4/2.5 | 1,818 (-8%) | 0mo | $374,800 | $206 | 83 |
| 4874 Whittlebury Dr | 0.38mi | 4/2.5 | 1,994 (+1%) | 1mo | $375,000 | $188 | 80 |
| 12204 Bozzio Rd | 0.30mi | 4/2.5 | 2,155 (+9%) | 0mo | $382,000 | $177 | 70 |
| 12283 Hideout Pass | 0.26mi | 4/2.0 | 1,771 (-10%) | 1mo | $295,115 | $167 | 68 |
| 4819 Windrow Way | 0.40mi | 4/2.5 | 2,244 (+14%) | 1mo | $379,900 | $169 | 58 |
| 12041 Swather Ct | 0.44mi | 4/2.5 | 2,229 (+13%) | 2mo | $375,000 | $168 | 56 |
| 4684 Hammock Dr | 0.33mi | 3/2.0 (-1) | 1,724 (-13%) | 1mo | $327,000 | $190 | 55 |
| 5091 Sickle Cv | 0.37mi | 3/2.0 (-1) | 1,703 (-14%) | 0mo | $342,200 | $201 | 53 |
| 5591 Broad Fields Cv | 0.51mi | 3/2.0 (-1) | 1,775 (-10%) | 0mo | $386,300 | $218 | 52 |
| 4725 Silverstone Psge | 0.44mi | 3/2.0 (-1) | 1,716 (-13%) | 2mo | $379,900 | $221 | 49 |
Match score weights: distance 35% · size 25% · config 20% · recency 20%. Top-matched comps best support the ARV.
Projected returns pro-forma
-3.0% appreciation · 7.64% rent growth · sell at horizon
- IRR
- -24.7%
- Equity multiple
- 0.13×
- Total profit
- $-89,218
- Equity at exit
- $54,467
- IRR
- -10.5%
- Equity multiple
- 0.24×
- Total profit
- $-77,989
- Equity at exit
- $31,584
Cash invested: $102,284 (down + closing). Projections, not guarantees.
Landlord ↔ Tenant lean methodology
- Overall (STATE)
- 90 Strongly Landlord-Friendly
- State Indiana
- 90 Strongly Landlord-Friendly · R+11
- County
- — inherits STATE
- City
- — inherits STATE
ZIP-level market 46818
- Rents YoY
- 7.6%
- Active inventory
- 327
- Price-to-rent
- 8.5×
Monthly cashflow live
- Estimated rent
- $2,420 medium interval (Pro) →
- Mortgage (P&I)
- −$1,916
- Tax est. 1.5%
- −$457 /mo · $5,479/yr
- Insurance
- −$152
- HOA
- −$45
- Vacancy / Maint / Mgmt
- −$508
- Net cashflow
- $-658
Break-even live
UW: 25.0% down · 7.5% · 30yr · 1.5% tax · 5.0% vac · 8.0% maint · 8.0% mgmt
Financing live
Cash to close
- Down payment
- $91,325
- Closing costs
- $10,959
- Reserves months
- —
- Total cash needed
- —
Loan-product check · same deal, 3 products live
Conventional
25% down · 7.5% · 30yr
- Down + closing
- —
- Monthly P&I
- —
- Monthly cashflow
- —
- DSCR
- —
- Eligible?
- —
Personal DTI + credit; lowest rate.
DSCR
20% down · 8.5% · 30yr
- Down + closing
- —
- Monthly P&I
- —
- Monthly cashflow
- —
- DSCR
- —
- Eligible?
- —
No personal income docs; deal must DSCR.
Hard money
10% down · 12.0% · 12mo
- Down + closing
- —
- Monthly P&I
- —
- Monthly cashflow
- —
- DSCR
- —
- Eligible?
- —
Short-term bridge; refi at stabilization.
Rent comps 3 comps
| Address | Beds | Baths | Sqft | Rent | $/sqft | DOM | Units | Dist |
|---|---|---|---|---|---|---|---|---|
| 5045 Portney Pl Fort Wayne, IN | 4.0 | 2.5 | 2226 | $2,300 | $1.03 | 43d | 1 | 0.12mi |
| 4722 Whittlebury Dr Fort Wayne, IN | 4.0 | 2.0 | 1650 | $1,999 | $1.21 | 13d | 1 | 0.30mi |
| 3115 Carroll Rd Fort Wayne, IN | 3.0 | 2.0 | 1244 | $2,300 | $1.85 | 13d | 1 | 1.39mi |
HOA detail
- Monthly dues
- $45 · $540/yr
Listing history 17 events
-
2026-06-18days on market $247,100 Active 300 DOM
-
2026-06-17days on market $247,100 Active 299 DOM
-
2026-06-16days on market $247,100 Active 298 DOM
-
2026-06-15days on market $247,100 Active 297 DOM
-
2026-06-14days on market $247,100 Active 295 DOM
-
2026-06-13days on market $247,100 Active 294 DOM
-
2026-06-10days on market $247,100 Active 292 DOM
-
2026-06-09days on market $247,100 Active 291 DOM
-
2026-06-08days on market $247,100 Active 290 DOM
-
2026-06-07days on market $247,100 Active 289 DOM
-
2026-06-03days on market $247,100 Active 285 DOM
-
2026-06-02pricedays on market $247,100 Active 284 DOM
-
2026-06-01days on market $242,400 Active 283 DOM
-
2026-05-31days on market $242,400 Active 282 DOM
-
2026-05-30days on market $242,400 Active 281 DOM
-
2026-02-09price $242,400 356-char remark
Show marketing remark (356 chars)
THIS IS A SAMPLE PLAN - THIS IS NOT A HOME FOR SALE. Lancia's Chesapeake I is a lot of home for your money with 4 Bedrooms, 2.5 Baths, Office, Laundry upstairs and plenty of storage! Lancia Homes offers many different floor plan options to choose from, visit our website or call our office to see all current floor plans. * Base price does not include land
-
2025-08-22$240,600 Active 356-char remark
Show marketing remark (356 chars)
THIS IS A SAMPLE PLAN - THIS IS NOT A HOME FOR SALE. Lancia's Chesapeake I is a lot of home for your money with 4 Bedrooms, 2.5 Baths, Office, Laundry upstairs and plenty of storage! Lancia Homes offers many different floor plan options to choose from, visit our website or call our office to see all current floor plans. * Base price does not include land
ⓘ Source: listings_history table (triggers on properties + properties_extension) + one-shot
backfill from property_details.listing_events for pre-trigger history.
Nearby sold comps map
Loading sold comps map…
Walkable amenities ~0.75 mi
Loading nearby amenities…
Taxation est. · year 1
- Rental income
- $29,034
- − Mortgage interest
- −$20,462
- − Property taxes
- −$5,479
- − Insurance
- −$1,826
- − Repairs & maintenance
- −$2,323
- − Management
- −$2,323
- − HOA
- −$540
- − Depreciation
- −$10,627
- Taxable loss
- −$14,546
- Est. tax savings @ 24.0%
- +$3,491
- After-tax cash flow
- $-4,406/yr
For passive investors: Depreciation is non-cash, so a rental often shows a tax loss while cash-flowing — sheltering income. Rental losses are passive: they offset passive income freely, and up to $25,000/yr can offset ordinary (W-2) income if you actively participate and your MAGI is under $100k (phasing out to $0 by $150k); unused losses carry forward. On sale, claimed depreciation is recaptured at up to 25%, and gains may owe capital-gains tax (a 1031 exchange can defer both). Figures are a year-1 estimate at your 24.0% rate — not tax advice; consult a CPA.
Condition & rehab AI · 1 photo
This property requires extensive repairs and updates to bring it up to a livable condition. Significant investment is needed in the roof, exterior, interior, bathrooms, kitchen, HVAC, and landscaping to make it move-in ready.
Repairs flagged
- Major roof — No visible roof in the satellite image.
- Major exterior — No visible exterior in the satellite image.
- Major flooring — No visible interior or exterior flooring in the satellite image.
- Major interior walls/paint — No visible interior walls or paint in the satellite image.
- Major bathrooms — No visible bathrooms in the satellite image.
- Major kitchen — No visible kitchen in the satellite image.
- Major systems — No visible HVAC or mechanical systems in the satellite image.
- Major windows — No visible windows in the satellite image.
- Major foundation/structure — No visible foundation or structure in the satellite image.
- Major landscaping/curb appeal — No visible landscaping or curb appeal in the satellite image.
Value-add opportunities
- Both roof replacement — A new roof would significantly improve the home's appearance and functionality.
- Both exterior painting/staining — A fresh coat of paint or stain would enhance curb appeal and protect the exterior.
- Both interior painting — A fresh coat of paint would improve the home's appearance and protect the walls.
- Both bathroom updates — Modernizing bathrooms would improve functionality and appeal.
- Both kitchen updates — Upgrading the kitchen would improve functionality and appeal.
- Both HVAC replacement — A new HVAC system would improve comfort and energy efficiency.
- Both landscaping — Landscaping would improve curb appeal and add value to the property.
Renovation cost estimate screening
| Repair item | Severity | Est. cost |
|---|---|---|
| roof · No visible roof in the satellite image. | Major | $15,000–50,000 |
| exterior · No visible exterior in the satellite image. | Major | $15,000–50,000 |
| flooring · No visible interior or exterior flooring in the satellite image. | Major | $15,000–50,000 |
| interior walls/paint · No visible interior walls or paint in the satellite image. | Major | $15,000–50,000 |
| bathrooms · No visible bathrooms in the satellite image. | Major | $15,000–50,000 |
| kitchen · No visible kitchen in the satellite image. | Major | $15,000–50,000 |
| systems · No visible HVAC or mechanical systems in the satellite image. | Major | $15,000–50,000 |
| windows · No visible windows in the satellite image. | Major | $15,000–50,000 |
| foundation/structure · No visible foundation or structure in the satellite image. | Major | $15,000–50,000 |
| landscaping/curb appeal · No visible landscaping or curb appeal in the satellite image. | Major | $15,000–50,000 |
| Total estimated repair cost · 10 items | $150,000–500,000 |
Value-add ROI direction
- Both roof replacement — A new roof would significantly improve the home's appearance and functionality. ↑
- Both exterior painting/staining — A fresh coat of paint or stain would enhance curb appeal and protect the exterior. ↑
- Both interior painting — A fresh coat of paint would improve the home's appearance and protect the walls. ↑
- Both bathroom updates — Modernizing bathrooms would improve functionality and appeal. ↑
- Both kitchen updates — Upgrading the kitchen would improve functionality and appeal. ↑
- Both HVAC replacement — A new HVAC system would improve comfort and energy efficiency. ↑
- Both landscaping — Landscaping would improve curb appeal and add value to the property. ↑
ⓘ Cost ranges are severity-bucket heuristics (US national rule-of-thumb). Get contractor quotes + a written scope before underwriting a rehab budget.
Schools (NCES district)
- District
- Northwest Allen County Schools
- NCES district ID
- 1808250
- Math proficiency
- 51% ▼ -6.00%
- Reading proficiency
- 58% ▼ -5.00%
- Median HH income
- $78,952
- Composite
- 49.26/100
- National rank
- #2027
- State rank
- #25 of 301 in IN
Livability — Huntertown
- Score
- 70/100
- State rank
- #159
- US rank
- #7771
Category grades
Schools grade is shown separately in the Schools card above.
Census & demographics
- County
- Allen County · 326,813 people
- Metro
- Fort Wayne, IN
- Population (ZIP)
- 21,954
- Household income
- $81,066
- Rent vs Own
- Severe rent burden
- 101.0
Population outlook (Allen County) Hauer SSP2
- Today (2025)
- 394,020 people
- By 2030
- 405,128 · +2.8%
- By 2040
- 423,476 · +7.5%
- By 2050
- 435,137 · +10.4%
- By 2075
- 450,293 · +14.3%
- By 2100
- 424,101 · +7.6%
Race, ethnicity, and origin ACS 2023
- Neighborhood character
- Predominantly White (79%)
- Race & ethnicity
- White 79% Two or more races 8% Hispanic / Latino 7% Black 4% Asian 3%
- Hispanic origin (detail)
- Mexican 6%
- Common ancestry
- Italian 4% Slovak 3% Romanian 2%
- Foreign-born
- 8% · Canada, Vietnam, Philippines
- Languages at home
- 90% English-only · Spanish 4% Other Asian/Pacific 1% Vietnamese 1%
Political lean MEDSL · Allen
- 2024 margin
- R (+12.5) · D 42.9% · R 55.4% · Other 1.7%
- 2008→2024 swing
- -8.1pp toward R · 2008: -4.3pp · 2024: -12.5pp
- All cycles
- 2024: R+12.5 2020: R+11.2 2016: R+19.6 2012: R+16.8 2008: R+4.3
Not yet ingested
- Civics
- —
Market trends
- HPI YoY
- ▼ -217.71%
- Current HPI
- 228.1539
- Rent YoY
- ▲ 7.64%
- Metro
- Fort Wayne, IN
- State GDP YoY
- ▲ 2.90%
- F500 in state
- 18
Industry mix (Fortune 500 HQ in IN)
| Industry | F500 HQs | Revenue |
|---|---|---|
| Industrial Machinery | 2 | $37B |
|
||
| Healthcare | 1 | $177B |
|
||
| Pharmaceuticals | 1 | $45B |
|
||
| Metals / Steel | 1 | $18B |
|
||
| Agriculture | 1 | $17B |
|
||
| Packaging | 1 | $12B |
|
||
Price history
+0.7% since first listed2 events — show timeline
- 2026-02-09 Price Changed $242,400 Zillow
- 2025-08-22 Listed $240,600 Zillow
Cash-flow waterfall
monthlySold comps — $/sqft
last 12 mo · ≤1 miLoading sold comps…