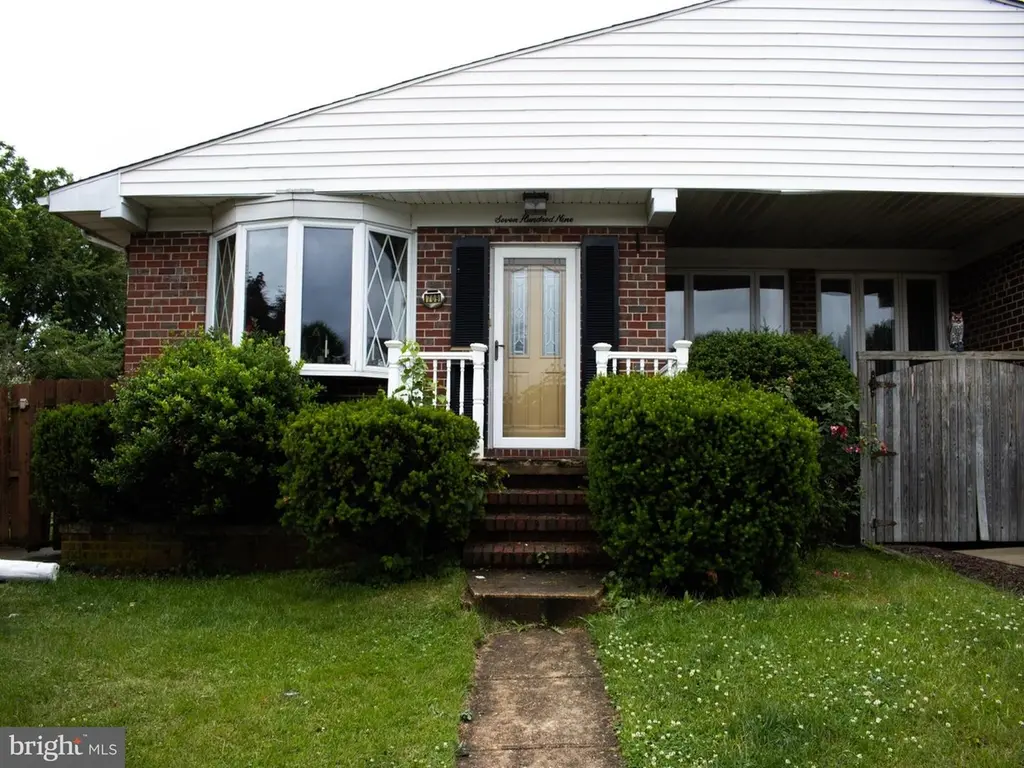
709 Margo Rd · Dundalk, MD
Flood risk 1/10 · Minimal
- FEMA flood zone
- X (unshaded)
- Chance of flooding over 30 yrs
- 0.0%
- Est. flood insurance / yr
- $473 – $860
Fire risk 1/10 · Minimal
- Est. fire insurance / yr
- $755 – $1,403
Heat risk 8/10 · Major
- Hot days now (above 103°F)
- 7 days/yr
- Hot days in 30 yrs
- 15 days/yr
Wind risk 6/10 · Moderate
- Chance of severe wind over 30 yrs
- 27.0%
Air-quality risk 5/10 · Moderate
- Unhealthy air days now
- 6 days/yr
- Unhealthy air days in 30 yrs
- 8 days/yr
Risk factors via First Street. Map © Google.
Why this score? — see what drove the D grade
The composite is a weighted blend of 9 inputs, each scored 0–100. Each bar is that input's sub-score; the figure is the points it added to the 100-point composite (weight × sub-score).
- Cash flow +15.4/30.0
- ARV discount +6.9/15.0
- DSCR +4.7/10.0
- 1% rule +4.4/10.0
- Livability +4.2/5.0
- Rent growth +2.5/5.0
- Condition / age +2.5/5.0
- Schools +2.3/10.0
- Appreciation +0.0/10.0
$215,000
🖨 Deal sheet (PDF) 📄 Offer letter ✓ Due diligence
Key facts
- Pool
- Built 1967
- Listed 8 days
Property features AI
Finance
- Other: Above-grade finished area reported by assessor; Below-grade unfinished area reported by assessor
- Financial info: Fee simple ownership
Exterior
- Parking: Driveway
- Utilities: Public water; Public sewer; Electric service
- Home design: Semi-detached property
- Construction: Brick construction; Brick/mortar foundation; Above-grade and below-grade structures
- Exterior features: Personal (private) pool; Not in a federal flood zone; Ground rent paid annually
Interior
- Bedrooms: Three bedrooms on the main level
- Bathrooms: Two full bathrooms (one on the main level and one on the lower level)
- Heating & cooling: Central heating (natural gas); Central air conditioning (electric); Electric hot water
- Interior features: Assessor-listed living area; Has one fireplace; Basement with windows, interior access, outside entrance and walkout stairs; Basement is partially finished with space for additional rooms and is heated
Neighborhood map
What this means for you Summary
Snapshot
- This is a 3-bed/1.0-bath townhouse listed at $215k.
Deal economics
- At list price, monthly cash flow is $83 ($999/yr) — positive.
- The deal already cash-flows at list — no discount required.
- To meet the 1% rule (rent ≥ 1% of price), the offer needs to be $202k (6.2% below list).
- Recommended offer: $202k (6.2% below list) — sets the bar for 1% rule.
Location & tenants
- Location reads 85/100 on livability (#16 in MD, #510 nationally) — a professional / high-income tenant draw. Strengths: amenities A+, commute A+, housing A+; Watch: crime F.
- Baltimore County Public Schools (suburban): math 15% / reading 34% proficiency, ranked #11 of 24 in MD (top 46%) — low school quality limits family demand, transient renter base, plan for 1-2y turnover.
- Zoned schools: Berkshire Elementary (math 8% / reading 14%, grade F, #589 of 860 statewide, top 68%, 471 students, 66% FRL); Holabird Middle (math 4% / reading 19%, grade F, #205 of 225 statewide, top 92%, 912 students, 65% FRL); Dundalk High (math 5% / reading 33%, grade F, #177 of 222 statewide, top 80%, 2,193 students, 62% FRL) — zoned schools average 65% FRL vs 39% district-wide (26 pts higher); higher-poverty schools than district average — tighter screening recommended.
- Market conditions: Rents soft (-0.1%/yr); 238 active listings in the ZIP; 40 comparable units currently listed for rent nearby; rentals at typical pace (median 26d on market — plan ~3-4 weeks tenant-placement turnaround); 1,511 units permitted in Baltimore County in 2024 (643 in 5+ unit buildings).
- This rent runs 38% of the median local income ($64k/yr) — at the standard rent-burdened threshold; future hikes will face affordability resistance.
Forward outlook
- Local home prices are declining (-3.0%/yr); year-one equity from $1k of loan paydown is wiped out by about $6k of value loss. Plan a longer hold.
- Baltimore County population projected at +12% by 2050 — modest demand growth; plan on rents tracking national, not racing it.
Negotiation context
- Only 8 days on market — expect competitive offers; lowballing is unlikely to land.
Risks & watch-outs
- Climate carrying-cost: major wind risk, 27% chance of damaging wind over 30y; extreme-heat days projected 7→15/yr by 2055 (HVAC capex compounding) — expect insurance premiums to compound above CPI over the hold.
Questions for the listing agent
- Built in 1967 — when were the roof, HVAC, electrical panel, plumbing, and water heater last replaced?
- Is there a deadline driving the sale (1031 exchange, divorce, estate, relocation)? That informs how much negotiation room exists.
- Schools are A-rated — typically a magnet for longer-tenancy family renters. What's the average tenant stay here, and is there a school-zone premium baked into asking?
- Crime grade is F in this area — have there been break-ins, vandalism, or insurance claims at this property in the last 3 years? What carrier currently insures it and at what premium?
- The area grade is low — what's the realistic commute time and amenity access for the typical tenant pool here? Any planned neighborhood developments (good or bad) we should know about?
- What's the average days-on-market for RENTAL listings here right now (not sales)? A rising rental-DOM trend means longer vacancies and softer asking-rent achievability than the comps imply.
- What's the recent tenant-quality profile in this submarket — average credit score on applications, eviction rate, late-payment / NSF rate, and stable-employment percentage? A property-management company in the area should have these aggregated.
- How much new for-sale + rental construction is in the pipeline within 1–3 miles? Heavy new supply typically softens prices + rents 12–24 months out; constrained supply supports both.
Investment metrics
- 1% rule
- 0.94% ✗
- Cap rate
- 6.76%
- Cash-on-cash
- 1.66%
- DSCR
- 1.07
- GRM
- 8.9
CMA / ARV
- ARV (on-the-fly)
- $212,313
- Comps found
- 12
Show comp detail 12 sales within ~0.75 mi
| Address | Dist | Beds/Ba | Sqft | Sold | Price | $/sf | Match |
|---|---|---|---|---|---|---|---|
| 640 Aldworth Rd | 0.12mi | 3/2.0 | 1,144 (-2%) | 9mo | $150,000 | $131 | 78 |
| 7552 Rabon Ave | 0.33mi | 3/1.5 | 1,144 (-2%) | 2mo | $132,000 | $115 | 77 |
| 805 Mildred Ave | 0.37mi | 3/1.5 | 1,144 (-2%) | 1mo | $235,000 | $205 | 76 |
| 815 Jeannette Ave | 0.29mi | 3/1.5 | 1,124 (-4%) | 10mo | $225,000 | $200 | 70 |
| 815 Mildred | 0.37mi | 3/1.5 | 1,144 (-2%) | 12mo | $170,000 | $149 | 67 |
| 7432 Manchester Rd | 0.16mi | 3/1.0 | 1,320 (+12%) | 8mo | $225,000 | $170 | 65 |
| 7475 Rabon Ave | 0.25mi | 3/1.5 | 1,024 (-13%) | 4mo | $170,000 | $166 | 62 |
| 874 Mildred Ave | 0.41mi | 3/2.0 | 1,280 (+9%) | 3mo | $226,000 | $177 | 59 |
| 849 Loalan Ave | 0.34mi | 3/1.5 | 1,024 (-13%) | 12mo | $185,000 | $181 | 51 |
| 7315 Stratton Way | 0.74mi | 3/2.0 | 1,215 (+4%) | 7mo | $250,000 | $206 | 50 |
| 857 Mildred Ave | 0.41mi | 3/2.0 | 1,024 (-13%) | 13mo | $240,000 | $234 | 45 |
| 423 Westham Way | 0.73mi | 2/1.0 (-1) | 1,092 (-7%) | 12mo | $226,000 | $207 | 39 |
Match score weights: distance 35% · size 25% · config 20% · recency 20%. Top-matched comps best support the ARV.
Projected returns pro-forma
-3.0% appreciation · 0.0% rent growth · sell at horizon
- IRR
- -17.1%
- Equity multiple
- 0.41×
- Total profit
- $-35,400
- Equity at exit
- $32,057
- IRR
- -16.0%
- Equity multiple
- 0.23×
- Total profit
- $-46,651
- Equity at exit
- $18,589
Cash invested: $60,200 (down + closing). Projections, not guarantees.
Landlord ↔ Tenant lean methodology
- Overall (STATE)
- 27 Tenant-Leaning
- State Maryland
- 27 Tenant-Leaning · D+14
- County
- — inherits STATE
- City
- — inherits STATE
ZIP-level market 21222
- Rents YoY
- -0.1%
- Active inventory
- 238
- Price-to-rent
- 8.9×
Monthly cashflow live
- Estimated rent
- $2,017 high interval (Pro) →
- Mortgage (P&I)
- −$1,127
- Tax from tax record
- −$293 /mo · $3,513/yr
- Insurance
- −$90
- HOA
- −$0
- Vacancy / Maint / Mgmt
- −$423
- Net cashflow
- $83
Break-even live
Sensitivity live
| Price | -10% $205 | -5% $144 | +0% $83 | +5% $22 | +10% $-38 |
|---|---|---|---|---|---|
| Rent | -10% $-76 | -5% $4 | +0% $83 | +5% $163 | +10% $243 |
| Rate | -1.0pp $192 | -0.5pp $138 | base $83 | +0.5pp $28 | +1.0pp $-29 |
UW: 25.0% down · 7.5% · 30yr · 1.5% tax · 5.0% vac · 8.0% maint · 8.0% mgmt
Financing live
Cash to close
- Down payment
- $53,750
- Closing costs
- $6,450
- Reserves months
- —
- Total cash needed
- —
Loan-product check · same deal, 3 products live
Conventional
25% down · 7.5% · 30yr
- Down + closing
- —
- Monthly P&I
- —
- Monthly cashflow
- —
- DSCR
- —
- Eligible?
- —
Personal DTI + credit; lowest rate.
DSCR
20% down · 8.5% · 30yr
- Down + closing
- —
- Monthly P&I
- —
- Monthly cashflow
- —
- DSCR
- —
- Eligible?
- —
No personal income docs; deal must DSCR.
Hard money
10% down · 12.0% · 12mo
- Down + closing
- —
- Monthly P&I
- —
- Monthly cashflow
- —
- DSCR
- —
- Eligible?
- —
Short-term bridge; refi at stabilization.
Rent comps 40 comps
| Address | Beds | Baths | Sqft | Rent | $/sqft | DOM | Units | Dist |
|---|---|---|---|---|---|---|---|---|
| 7520 Durwood Rd Dundalk, MD | 3.0 | 1.0 | 1110 | $2,100 | $1.89 | 45d | 1 | 0.26mi |
| 7484 Rabon Ave Dundalk, MD | 3.0 | 1.5 | 1499 | $2,000 | $1.33 | 45d | 1 | 0.27mi |
| 7444 Berkshire Rd Baltimore, MD | 3.0 | 1.5 | 1228 | $1,850 | $1.51 | 7d | 1 | 0.28mi |
| 944 Dalton Ave Baltimore, MD | 3.0 | 2.0 | 1024 | $2,100 | $2.05 | 12d | 1 | 0.34mi |
| 849 Loalan Ave Dundalk, MD | 3.0 | 1.5 | 1024 | $1,850 | $1.81 | 16d | 1 | 0.37mi |
| 7517 Belmont Ave Baltimore, MD | 2.0 | 1.0 | 720 | $1,800 | $2.50 | 19d | 1 | 0.37mi |
| 932 Elton Ave Baltimore, MD | 3.0 | 2.0 | 1024 | $1,950 | $1.90 | 19d | 1 | 0.37mi |
| 901 Elton Ave Baltimore, MD | 4.0 | 2.0 | 1056 | $2,800 | $2.65 | 45d | 1 | 0.41mi |
| 608 Northpoint Rd Baltimore, MD | 3.0 | 1.5 | 1148 | $1,895 | $1.65 | 25d | 1 | 0.52mi |
| 505 Northpoint Rd Baltimore, MD | 3.0 | 2.0 | 1300 | $2,195 | $1.69 | 13d | 1 | 0.62mi |
| 630 47th St Unit B Baltimore, MD | 2.0 | 1.0 | 750 | $1,200 | $1.60 | 45d | 1 | 0.66mi |
| 628 47th St Apt RW2 Baltimore, MD | 2.0 | 1.0 | 750 | $1,200 | $1.60 | 12d | 1 | 0.66mi |
| 1533 Leslie Rd Dundalk, MD | 4.0 | 1.0 | 1270 | $2,000 | $1.57 | 45d | 1 | 0.67mi |
| 530 47th St Baltimore, MD | 3.0 | 1.0 | 1424 | $1,695 | $1.19 | 0d | 1 | 0.73mi |
| 7261 Bridgewood Dr Baltimore, MD | 3.0 | 2.0 | 896 | $2,495 | $2.78 | 25d | 1 | 0.76mi |
| 7911 Bank St Baltimore, MD | 3.0 | 1.0 | 1080 | $1,749 | $1.62 | 45d | 1 | 0.76mi |
| 7508 Ives Ln Dundalk, MD | 2.0 | 1.0 | 896 | $1,750 | $1.95 | 45d | 1 | 0.80mi |
| 7319 Conley St Baltimore, MD | 3.0 | 2.0 | 1080 | $1,950 | $1.81 | 19d | 1 | 0.81mi |
| 7325 Conley St Baltimore, MD | 3.0 | 2.0 | 1290 | $1,950 | $1.51 | 19d | 1 | 0.81mi |
| 7219 Conley St Baltimore, MD | 4.0 | 1.5 | 1440 | $1,950 | $1.35 | 16d | 1 | 0.83mi |
| 1955 Walnut Ave Dundalk, MD | 3.0 | 1.0 | 950 | $2,300 | $2.42 | 45d | 1 | 0.83mi |
| 7230 Conley St Unit 1 Baltimore, MD | 3.0 | 1.5 | 1144 | $2,100 | $1.84 | 25d | 1 | 0.85mi |
| 7230 Conley St Unit 1 Baltimore, MD | 3.0 | 1.5 | 1144 | $2,100 | $1.84 | 5d | 1 | 0.85mi |
| 309 52nd St Unit A Baltimore, MD | 2.0 | 1.0 | 722 | $1,350 | $1.87 | 25d | 1 | 0.86mi |
| 7716 Wynbrook Rd Baltimore, MD | 2.0 | 1.0 | 1232 | $1,800 | $1.46 | 45d | 1 | 0.88mi |
| 8036 Lansdale Rd Unit 1 Baltimore, MD | 3.0 | 1.0 | 1024 | $1,750 | $1.71 | 0d | 1 | 0.90mi |
| 7124 Gough St Baltimore, MD | 2.0 | 1.5 | 1096 | $1,700 | $1.55 | 23d | 1 | 0.94mi |
| 6905 Bank St Baltimore, MD | 2.0 | 1.5 | 784 | $1,650 | $2.10 | 45d | 1 | 0.94mi |
| 7136 Eastbrook Ave Baltimore, MD | 4.0 | 2.0 | 996 | $2,200 | $2.21 | 7d | 1 | 0.95mi |
| 7915 Eastdale Rd Baltimore, MD | 2.0 | 1.0 | 896 | $1,500 | $1.67 | 45d | 1 | 0.96mi |
| 7058 Eastbrook Ave Baltimore, MD | 3.0 | 2.0 | 1228 | $1,700 | $1.38 | 13d | 1 | 0.97mi |
| 7948 Eastdale Rd Baltimore, MD | 3.0 | 1.0 | 1024 | $1,700 | $1.66 | 45d | 1 | 1.01mi |
| 6802 Conley St Baltimore, MD | 2.0 | 1.5 | 939 | $1,750 | $1.86 | 23d | 1 | 1.02mi |
| 433 Oakwood Rd Dundalk, MD | 2.0 | 1.0 | 1016 | $1,900 | $1.87 | 0d | 1 | 1.03mi |
| 7951 E Baltimore St Baltimore, MD | 3.0 | 1.0 | 1024 | $1,750 | $1.71 | 4d | 1 | 1.03mi |
| 6722 Brentwood Ave Unit 2FL Dundalk, MD | 3.0 | 1.0 | 900 | $1,750 | $1.94 | 45d | 1 | 1.05mi |
| 6710 Hudson St Baltimore, MD | 4.0 | 4.0 | 1156 | $3,500 | $3.03 | 25d | 1 | 1.07mi |
| 414 Westfield Rd Dundalk, MD | 3.0 | 1.0 | 1024 | $2,300 | $2.25 | 45d | 1 | 1.17mi |
| 7 Robinson Ave Dundalk, MD | 3.0 | 2.0 | 1100 | $2,600 | $2.36 | 45d | 1 | 1.21mi |
| 334 Kane St Baltimore, MD | 2.0 | 2.0 | 1050 | $1,675 | $1.60 | 25d | 1 | 1.32mi |
Listing history 5 events
-
2026-06-13statusdays on market $215,000 Pending 8 DOM
-
2026-06-09days on market $215,000 Active 6 DOM
-
2026-06-08days on market $215,000 Active 5 DOM
-
2026-06-07days on market $215,000 Active 4 DOM
-
2026-06-04$215,000 Active 1 DOM
ⓘ Source: listings_history table (triggers on properties + properties_extension) + one-shot
backfill from property_details.listing_events for pre-trigger history.
Tax reassessment forecast MD · Partial reset (capped growth)
- Current annual tax
- $3,513 · $293/mo
- Projected year-2 tax
- $3,513 · $293/mo
- Expected delta
- $0/yr ($0/mo · 0.0%)
ⓘ Screening estimate from a state-policy table — verify with the county assessor before closing.
Climate risk First Street
- Flood 1/10 Low FEMA zone X (unshaded) · 0% chance over 30 yrs
- Wildfire 1/10 Low
- Heat 8/10 Severe 7 d/yr ≥103°F today · 15 d/yr by 30 yrs out
- Wind 6/10 Major 27% chance of damaging wind over 30 yrs
- Air quality 5/10 Major 6 unhealthy d/yr today · 8 by 30 yrs out
Nearby sold comps map
Loading sold comps map…
Walkable amenities ~0.75 mi
Loading nearby amenities…
Taxation est. · year 1
- Rental income
- $24,198
- − Mortgage interest
- −$12,043
- − Property taxes
- −$3,513
- − Insurance
- −$1,075
- − Repairs & maintenance
- −$1,936
- − Management
- −$1,936
- − Depreciation
- −$6,255
- Taxable loss
- −$2,559
- Est. tax savings @ 24.0%
- +$614
- After-tax cash flow
- $1,613/yr
For passive investors: Depreciation is non-cash, so a rental often shows a tax loss while cash-flowing — sheltering income. Rental losses are passive: they offset passive income freely, and up to $25,000/yr can offset ordinary (W-2) income if you actively participate and your MAGI is under $100k (phasing out to $0 by $150k); unused losses carry forward. On sale, claimed depreciation is recaptured at up to 25%, and gains may owe capital-gains tax (a 1031 exchange can defer both). Figures are a year-1 estimate at your 24.0% rate — not tax advice; consult a CPA.
Schools (NCES district)
- District
- Baltimore County Public Schools
- NCES district ID
- 2400120
- Math proficiency
- 15% ▼ -16.00%
- Reading proficiency
- 34% ▼ -5.00%
- Median HH income
- $66,746
- Composite
- 23.17/100
- National rank
- #7948
- State rank
- #11 of 24 in MD
Livability — Dundalk
- Score
- 85/100
- State rank
- #16
- US rank
- #510
Category grades
Schools grade is shown separately in the Schools card above.
Census & demographics
- Census place
- Dundalk, MD
- County
- Baltimore County · 769,527 people
- City population
- 59,407
- Metro
- Baltimore-Columbia-Towson, MD
- Population (ZIP)
- 59,407
- Household income
- $64,141
- Rent vs Own
- Severe rent burden
- 2566.0
Population outlook (Baltimore County) Hauer SSP2
- Today (2025)
- 885,518 people
- By 2030
- 909,272 · +2.7%
- By 2040
- 951,547 · +7.5%
- By 2050
- 990,955 · +11.9%
- By 2075
- 1,086,411 · +22.7%
- By 2100
- 1,135,078 · +28.2%
Race, ethnicity, and origin ACS 2023
- Neighborhood character
- Diverse neighborhood (Simpson 0.60)
- Race & ethnicity
- White 59% Black 18% Hispanic / Latino 15% Two or more races 7% Asian 2% Native American 1%
- Hispanic origin (detail)
- Mexican 3% Puerto Rican 2%
- Common ancestry
- Romanian 7% Lithuanian 1% Italian 1%
- Foreign-born
- 9% · Canada
- Languages at home
- 85% English-only · Spanish 11% Other Indo-European 2% Arabic 1%
Political lean MEDSL · Baltimore
- 2024 margin
- Strong D (+24.5) · D 61.0% · R 36.5% · Other 2.5%
- 2008→2024 swing
- +9.9pp toward D · 2008: 14.6pp · 2024: 24.5pp
- All cycles
- 2024: D+24.5 2020: D+27.0 2016: D+17.4 2012: D+16.4 2008: D+14.6
Not yet ingested
- Civics
- —
Market trends
- HPI YoY
- ▼ -251.44%
- Current HPI
- 228.4218
- Rent YoY
- ▼ -0.09%
- Metro
- Baltimore-Columbia-Towson, MD
- State GDP YoY
- ▲ 2.97%
- F500 in state
- 12
Industry mix (Fortune 500 HQ in MD)
| Industry | F500 HQs | Revenue |
|---|---|---|
| Aerospace / Defense | 1 | $71B |
|
||
| Utilities | 1 | $25B |
|
||
| Hotels | 1 | $24B |
|
||
| Consumer Goods | 1 | $7B |
|
||
| Real Estate | 1 | $6B |
|
||
| Chemicals | 1 | $2B |
|
||
Price history
+0.0% since first listed2 events — show timeline
- 2026-06-04 Listed $215,000 BRIGHT MLS
- 2026-06-03 Coming Soon $215,000 BRIGHT MLS
Property tax history
+3.5%/yrLatest (2025): $3,513 · +5.5% YoY. Source: county tax records.
Cash-flow waterfall
monthlySold comps — $/sqft
last 12 mo · ≤1 miLoading sold comps…