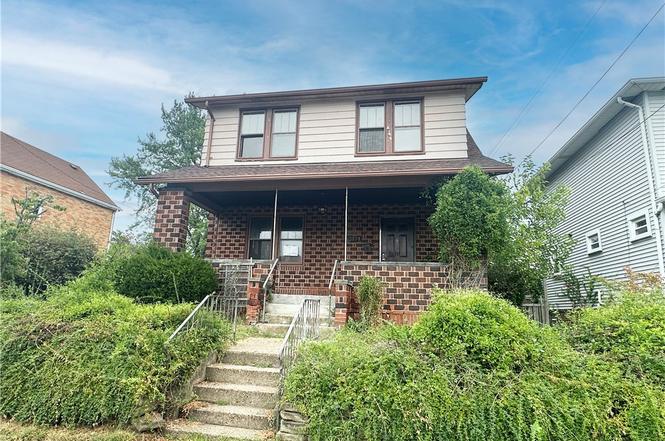
3733 Superior St · Munhall, PA
Flood risk 1/10 · Minimal
- FEMA flood zone
- X (unshaded)
- Chance of flooding over 30 yrs
- 0.0%
- Est. flood insurance / yr
- $473 – $860
Fire risk 1/10 · Minimal
- Est. fire insurance / yr
- $511 – $949
Heat risk 3/10 · Minor
- Hot days now (above 96°F)
- 7 days/yr
- Hot days in 30 yrs
- 17 days/yr
Wind risk 2/10 · Minimal
- Chance of severe wind over 30 yrs
- 0.0%
Air-quality risk 4/10 · Minor
- Unhealthy air days now
- 4 days/yr
- Unhealthy air days in 30 yrs
- 5 days/yr
Risk factors via First Street. Map © Google.
Why this score? — see what drove the B grade
The composite is a weighted blend of 9 inputs, each scored 0–100. Each bar is that input's sub-score; the figure is the points it added to the 100-point composite (weight × sub-score).
- Cash flow +26.6/30.0
- ARV discount +15.0/15.0
- DSCR +9.1/10.0
- 1% rule +8.2/10.0
- Livability +3.9/5.0
- Rent growth +3.5/5.0
- Schools +3.1/10.0
- Condition / age +2.5/5.0
- Appreciation +0.0/10.0
$109,900
🖨 Deal sheet (PDF) 📄 Offer letter ✓ Due diligence
Listing remarks MLS
Old Style Charm & Character! Upd Oak Kitchen, built-ins with orig woodwork. Park-like rear level lot! Cov'd Front & Rear Porches. Close to all necessities. Well Maintained
Key facts
- Covered front porch
- Hardwood flooring
- Level rear yard
Tags
Neighborhood map
What this means for you Summary
Snapshot
- This is a 3-bed/1.0-bath single-family listed at $110k.
Deal economics
- At list price, monthly cash flow is $296 ($4k/yr) — positive.
- The deal already cash-flows at list — no discount required.
- Meets the 1% rule at list price ($1k rent vs $110k).
- Cap rate 9.5% vs local median 7.3% in Munhall — top-decile yield for the area; either an underpriced asset or a hidden risk that comps aren't pricing in. Stress-test before assuming the spread holds.
Location & tenants
- Location reads 78/100 on livability (#308 in PA, #2,734 nationally) — a middle-class / working-renter tenant base. Strengths: cost of living A+, housing A+, crime A; Watch: employment D+, amenities F.
- Steel Valley SD (suburban): math 29% / reading 45% proficiency, ranked #403 of 539 in PA (top 75%) — families likely to look elsewhere, expect single-tenant / working-renter base with shorter leases.
- Market conditions: Rents rising fast (+4.1%/yr); 92 active listings in the ZIP; 11 comparable units currently listed for rent nearby; rentals at typical pace (median 24d on market — plan ~3-4 weeks tenant-placement turnaround); 45% of comp listings sitting > 30 days — soft ceiling on asking rent; 2,996 units permitted in Allegheny County in 2024 (1,588 in 5+ unit buildings).
- This rent runs 31% of the median local income ($56k/yr) — at the standard rent-burdened threshold; future hikes will face affordability resistance.
Forward outlook
- Local home prices are declining (-3.0%/yr); year-one equity from $760 of loan paydown is wiped out by about $3k of value loss. Plan a longer hold.
- At projected returns (-3.0% appreciation + 4.1% rent growth), your $31k cash investment doubles in ~9 years — after that, you're playing with house money.
Negotiation context
- Only 13 days on market — expect competitive offers; lowballing is unlikely to land.
- 3 sale attempts since 23y ago with the ask held roughly flat each time — persistent listings suggest the price (not the market) is what's stuck; bring a comps-based counter.
Risks & watch-outs
- Watch-outs: built in 1928 — expect roof / HVAC / electrical / plumbing capex.
Questions for the listing agent
- Built in 1928 — when were the roof, HVAC, electrical panel, plumbing, and water heater last replaced?
- Is there a deadline driving the sale (1031 exchange, divorce, estate, relocation)? That informs how much negotiation room exists.
- Schools are B-rated — typically a magnet for longer-tenancy family renters. What's the average tenant stay here, and is there a school-zone premium baked into asking?
- What's the average days-on-market for RENTAL listings here right now (not sales)? A rising rental-DOM trend means longer vacancies and softer asking-rent achievability than the comps imply.
- What's the recent tenant-quality profile in this submarket — average credit score on applications, eviction rate, late-payment / NSF rate, and stable-employment percentage? A property-management company in the area should have these aggregated.
- How much new for-sale + rental construction is in the pipeline within 1–3 miles? Heavy new supply typically softens prices + rents 12–24 months out; constrained supply supports both.
Investment metrics
- 1% rule
- 1.32% ✓
- Cap rate
- 9.52%
- Cash-on-cash
- 11.53%
- DSCR
- 1.51
- GRM
- 6.3
CMA / ARV
- ARV (on-the-fly)
- $214,368
- Comps found
- 12
Show comp detail 12 sales within ~0.75 mi
| Address | Dist | Beds/Ba | Sqft | Sold | Price | $/sf | Match |
|---|---|---|---|---|---|---|---|
| 147 E Virginia Ave | 0.13mi | 2/1.0 (-1) | 1,400 (+1%) | 1mo | $154,000 | $110 | 87 |
| 3728 Superior St | 0.03mi | 2/1.5 (-1) | 1,197 (-14%) | 1mo | $211,900 | $177 | 68 |
| 4317 Superior St | 0.32mi | 3/2.0 | 1,236 (-11%) | 1mo | $185,000 | $150 | 61 |
| 209 Video Dr | 0.52mi | 3/1.0 | 1,269 (-9%) | 2mo | $195,000 | $154 | 60 |
| 3430 Lynnwood Dr | 0.68mi | 3/2.0 | 1,357 (-2%) | 2mo | $295,000 | $217 | 59 |
| 3508 Cambria St | 0.34mi | 3/1.0 | 1,600 (+15%) | 3mo | $157,500 | $98 | 56 |
| 409 Victoria St | 0.59mi | 3/1.0 | 1,545 (+11%) | 1mo | $230,000 | $149 | 53 |
| 4374 Homestead Duquesne Rd | 0.50mi | 3/2.5 | 1,534 (+10%) | 1mo | $218,000 | $142 | 53 |
| 145 Marham Rd | 0.59mi | 4/2.0 (+1) | 1,488 (+7%) | 3mo | $235,000 | $158 | 49 |
| 517 Brierly Ln | 0.59mi | 3/2.5 | 1,544 (+11%) | 3mo | $279,900 | $181 | 46 |
| 4803 Aspen St | 0.70mi | 3/2.0 | 1,541 (+11%) | 3mo | $250,000 | $162 | 43 |
| 127 Marham Rd | 0.59mi | 3/2.5 | 1,579 (+13%) | 4mo | $220,000 | $139 | 41 |
Match score weights: distance 35% · size 25% · config 20% · recency 20%. Top-matched comps best support the ARV.
Projected returns pro-forma
-3.0% appreciation · 4.06% rent growth · sell at horizon
- IRR
- 2.2%
- Equity multiple
- 1.09×
- Total profit
- $2,649
- Equity at exit
- $16,386
- IRR
- 12.9%
- Equity multiple
- 2.08×
- Total profit
- $33,384
- Equity at exit
- $9,502
Cash invested: $30,772 (down + closing). Projections, not guarantees.
Landlord ↔ Tenant lean methodology
- Overall (STATE)
- 62 Landlord-Friendly
- State Pennsylvania
- 62 Landlord-Friendly · EVEN
- County
- — inherits STATE
- City
- — inherits STATE
ZIP-level market 15120
- Home prices YoY
- -16.9%
- Rents YoY
- 4.1%
- Active inventory
- 92
- Price-to-rent
- 6.3×
Monthly cashflow live
- Estimated rent
- $1,445 high interval (Pro) →
- Mortgage (P&I)
- −$576
- Tax from tax record
- −$224 /mo · $2,690/yr
- Insurance
- −$46
- HOA
- −$0
- Vacancy / Maint / Mgmt
- −$304
- Net cashflow
- $296
Break-even live
Sensitivity live
| Price | -10% $358 | -5% $327 | +0% $296 | +5% $264 | +10% $233 |
|---|---|---|---|---|---|
| Rent | -10% $181 | -5% $238 | +0% $296 | +5% $353 | +10% $410 |
| Rate | -1.0pp $351 | -0.5pp $324 | base $296 | +0.5pp $267 | +1.0pp $238 |
UW: 25.0% down · 7.5% · 30yr · 1.5% tax · 5.0% vac · 8.0% maint · 8.0% mgmt
Financing live
Cash to close
- Down payment
- $27,475
- Closing costs
- $3,297
- Reserves months
- —
- Total cash needed
- —
Loan-product check · same deal, 3 products live
Conventional
25% down · 7.5% · 30yr
- Down + closing
- —
- Monthly P&I
- —
- Monthly cashflow
- —
- DSCR
- —
- Eligible?
- —
Personal DTI + credit; lowest rate.
DSCR
20% down · 8.5% · 30yr
- Down + closing
- —
- Monthly P&I
- —
- Monthly cashflow
- —
- DSCR
- —
- Eligible?
- —
No personal income docs; deal must DSCR.
Hard money
10% down · 12.0% · 12mo
- Down + closing
- —
- Monthly P&I
- —
- Monthly cashflow
- —
- DSCR
- —
- Eligible?
- —
Short-term bridge; refi at stabilization.
Rent comps 11 comps
| Address | Beds | Baths | Sqft | Rent | $/sqft | DOM | Units | Dist |
|---|---|---|---|---|---|---|---|---|
| 3705 Botsford St Apt 2 Munhall, PA | 3.0 | 1.0 | 1000 | $1,195 | $1.20 | 44d | 1 | 0.08mi |
| 3305 W Run Rd Munhall, PA | 2.0 | 1.0 | 1100 | $1,365 | $1.24 | 24d | 1 | 0.43mi |
| 402 Brierly Ln West Mifflin, PA | 2.0 | 1.0 | 1100 | $1,145 | $1.04 | 24d | 1 | 0.64mi |
| 308 Lea St Homestead, PA | 4.0 | 2.0 | 1480 | $1,490 | $1.01 | 3d | 1 | 0.68mi |
| 218 Mary St Homestead, PA | 3.0 | 1.0 | 1776 | $1,400 | $0.79 | 22d | 1 | 0.69mi |
| 1254 Edgewood Dr Homestead, PA | 3.0 | 1.0 | 1144 | $1,725 | $1.51 | 44d | 1 | 0.86mi |
| 335 Commonwealth Ave West Mifflin, PA | 2.0 | 2.0 | 1536 | $2,500 | $1.63 | 44d | 1 | 1.06mi |
| 300 W 13th Ave Homestead, PA | 2.0 | 1.0 | 1088 | $1,125 | $1.03 | 17d | 1 | 1.28mi |
| 300 W 13th Ave Unit 302 Homestead, PA | 2.0 | 1.0 | 1088 | $1,150 | $1.06 | 17d | 1 | 1.28mi |
| 623 E 18th Ave Homestead, PA | 2.0 | 1.0 | 1156 | $1,600 | $1.38 | 44d | 1 | 1.29mi |
| 214 Vine St Homestead, PA | 2.0 | 1.0 | 1034 | $1,150 | $1.11 | 44d | 1 | 1.49mi |
Listing history 8 events
-
2026-02-23status Pending
-
2026-02-10$109,900 Active
-
2007-04-17soldstatus $100,000
-
2007-04-16soldstatus $100,000 183-char remark
Show marketing remark (183 chars)
Old Style Charm & Character! Upd Oak Kitchen, built-ins with orig woodwork. Park-like rear level lot! Cov'd Front & Rear Porches. Close to all necessities. Well Maintained
-
2007-02-09$111,900 183-char remark
Show marketing remark (183 chars)
Old Style Charm & Character! Upd Oak Kitchen, built-ins with orig woodwork. Park-like rear level lot! Cov'd Front & Rear Porches. Close to all necessities. Well Maintained
-
2003-08-26soldstatus $92,900
-
2003-08-25soldstatus $92,900 163-char remark
Show marketing remark (163 chars)
Well Maintained home Beautiful original woodwork built-in bookcase & desk updated oak kitchen covered ft & back porches LEVEL backyard TAXES are EST!!!
-
2003-04-03$89,900 163-char remark
Show marketing remark (163 chars)
Well Maintained home Beautiful original woodwork built-in bookcase & desk updated oak kitchen covered ft & back porches LEVEL backyard TAXES are EST!!!
ⓘ Source: listings_history table (triggers on properties + properties_extension) + one-shot
backfill from property_details.listing_events for pre-trigger history.
Tax reassessment forecast PA · Partial reset (capped growth)
- Current annual tax
- $2,690 · $224/mo
- Projected year-2 tax
- $2,690 · $224/mo
- Expected delta
- $0/yr ($0/mo · 0.0%)
ⓘ Screening estimate from a state-policy table — verify with the county assessor before closing.
Climate risk First Street
- Flood 1/10 Low FEMA zone X (unshaded) · 0% chance over 30 yrs
- Wildfire 1/10 Low
- Heat 3/10 Moderate 7 d/yr ≥96°F today · 17 d/yr by 30 yrs out
- Wind 2/10 Low 0% chance of damaging wind over 30 yrs
- Air quality 4/10 Moderate 4 unhealthy d/yr today · 5 by 30 yrs out
Nearby sold comps map
Loading sold comps map…
Walkable amenities ~0.75 mi
Loading nearby amenities…
Taxation est. · year 1
- Rental income
- $17,345
- − Mortgage interest
- −$6,156
- − Property taxes
- −$2,690
- − Insurance
- −$550
- − Repairs & maintenance
- −$1,388
- − Management
- −$1,388
- − Depreciation
- −$3,197
- Taxable income
- $1,977
- Est. tax owed @ 24.0%
- −$474
- After-tax cash flow
- $3,072/yr
For passive investors: Depreciation is non-cash, so a rental often shows a tax loss while cash-flowing — sheltering income. Rental losses are passive: they offset passive income freely, and up to $25,000/yr can offset ordinary (W-2) income if you actively participate and your MAGI is under $100k (phasing out to $0 by $150k); unused losses carry forward. On sale, claimed depreciation is recaptured at up to 25%, and gains may owe capital-gains tax (a 1031 exchange can defer both). Figures are a year-1 estimate at your 24.0% rate — not tax advice; consult a CPA.
Schools (NCES district)
- District
- Steel Valley SD
- NCES district ID
- 4222790
- Math proficiency
- 29% ▼ -1.00%
- Reading proficiency
- 45% ▼ -4.00%
- Median HH income
- $39,505
- Composite
- 30.94/100
- National rank
- #6111
- State rank
- #403 of 539 in PA
Livability — Munhall
- Score
- 78/100
- State rank
- #308
- US rank
- #2734
Category grades
Schools grade is shown separately in the Schools card above.
Census & demographics
- Census place
- Munhall, PA
- County
- Allegheny County · 1,022,028 people
- City population
- 18,029
- Metro
- Pittsburgh, PA
- Population (ZIP)
- 18,029
- Household income
- $55,714
- Rent vs Own
- Severe rent burden
- 669.0
Population outlook (Allegheny County) Hauer SSP2
- Today (2025)
- 1,250,282 people
- By 2030
- 1,256,482 · +0.5%
- By 2040
- 1,256,318 · +0.5%
- By 2050
- 1,244,169 · -0.5%
- By 2075
- 1,197,693 · -4.2%
- By 2100
- 1,093,187 · -12.6%
Race, ethnicity, and origin ACS 2023
- Neighborhood character
- Predominantly White (74%)
- Race & ethnicity
- White 74% Black 20% Two or more races 4% Hispanic / Latino 2%
- Common ancestry
- Romanian 6% Lithuanian 1% Scotch-Irish 1%
- Foreign-born
- 3% · South Korea, Canada
- Languages at home
- 95% English-only · Spanish 3% Russian/Polish/Slavic 1%
Political lean MEDSL · Allegheny
- 2024 margin
- Strong D (+20.3) · D 59.7% · R 39.4%
- 2008→2024 swing
- +4.8pp toward D · 2008: 15.5pp · 2024: 20.3pp
- All cycles
- 2024: D+20.3 2020: D+20.4 2016: D+16.4 2012: D+14.4 2008: D+15.5
Not yet ingested
- Civics
- —
Market trends
- HPI YoY
- ▼ -59.52%
- Current HPI
- 292.5607
- Rent YoY
- ▲ 4.06%
- Metro
- Pittsburgh, PA
- State GDP YoY
- ▲ 1.68%
- F500 in state
- 34
Industry mix (Fortune 500 HQ in PA)
| Industry | F500 HQs | Revenue |
|---|---|---|
| Healthcare | 2 | $309B |
|
||
| Insurance | 2 | $27B |
|
||
| Telecommunications / Media | 1 | $124B |
|
||
| Industrial Distribution | 1 | $22B |
|
||
| Financial Services | 1 | $20B |
|
||
| Chemicals / Materials | 1 | $18B |
|
||
Price history
+22.2% since first listed8 events — show timeline
- 2026-02-23 Pending — West Penn MLS
- 2026-02-10 Listed $109,900 West Penn MLS
- 2007-04-17 Sold (Public Records) $100,000 Public Records
- 2007-04-16 Sold (MLS) $100,000 West Penn MLS
- 2007-02-09 Listed $111,900 West Penn MLS
- 2003-08-26 Sold (Public Records) $92,900 Public Records
- 2003-08-25 Sold (MLS) $92,900 West Penn MLS
- 2003-04-03 Listed $89,900 West Penn MLS
Property tax history
+2.3%/yrLatest (2026): $2,690 · +3.9% YoY. Source: county tax records.
Cash-flow waterfall
monthlySold comps — $/sqft
last 12 mo · ≤1 miLoading sold comps…