 Fourplex
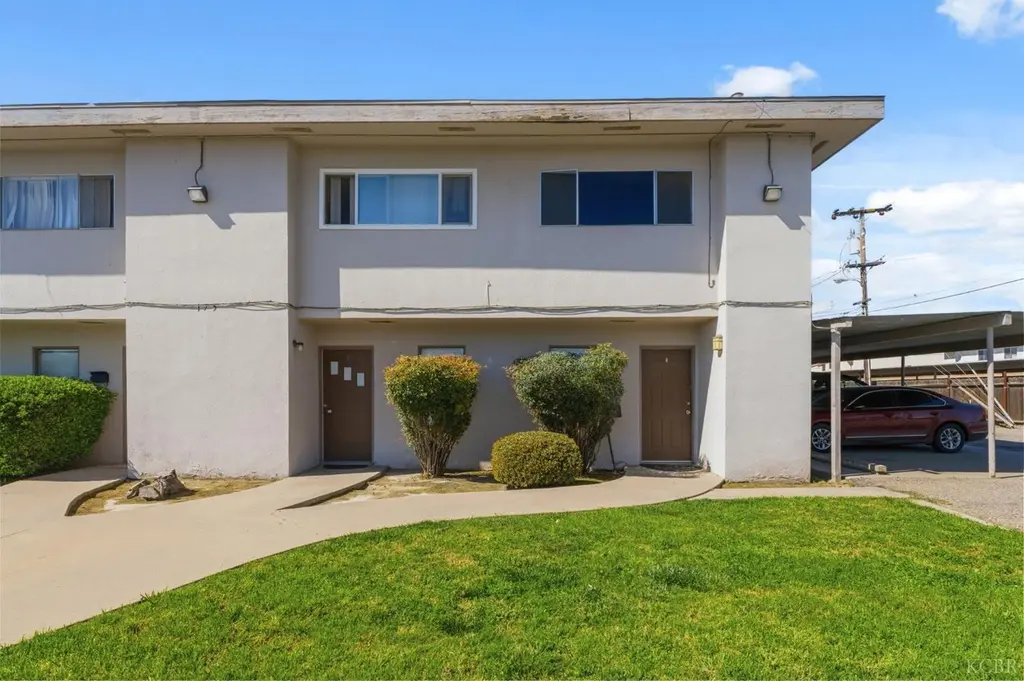
175 S 19th Ave · Lemoore, CA
Flood risk 1/10 · Minimal
- FEMA flood zone
- X (unshaded)
- Chance of flooding over 30 yrs
- 0.0%
- Est. flood insurance / yr
- $507 – $1,088
Fire risk 5/10 · Moderate
- Est. fire insurance / yr
- $659 – $1,223
Heat risk 8/10 · Major
- Hot days now (above 105°F)
- 7 days/yr
- Hot days in 30 yrs
- 17 days/yr
Wind risk 1/10 · Minimal
- Chance of severe wind over 30 yrs
- —
Air-quality risk 10/10 · Severe
- Unhealthy air days now
- 30 days/yr
- Unhealthy air days in 30 yrs
- 32 days/yr
Risk factors via First Street. Map © Google.
Why this score? — see what drove the D grade
The composite is a weighted blend of 9 inputs, each scored 0–100. Each bar is that input's sub-score; the figure is the points it added to the 100-point composite (weight × sub-score).
- Cash flow +15.5/30.0
- ARV discount +7.5/15.0
- DSCR +4.8/10.0
- Schools +3.5/10.0
- Rent growth +3.2/5.0
- 1% rule +3.1/10.0
- Livability +2.9/5.0
- Condition / age +2.5/5.0
- Appreciation +0.0/10.0
$899,000
🖨 Deal sheet (PDF) 📄 Offer letter ✓ Due diligence
Multi-family units
County records classify this as Multi-Family (5+ Unit). Listing-text estimate: 4 units. estimate disagrees with records
5+ unit building — per-unit beds/baths from public records are typically unavailable; the breakdown below (if shown) is an estimate from the listing text.
Listing remarks MLS
Great investment opportunity in Lemoore. This 4-unit multifamily property offers strong income potential for investors or owner-occupants looking to build their portfolio. Conveniently located near shopping, dining, schools, and major commuter routes.
Key facts
- Multifamily property
- Conveniently located
- 9,997 sq ft lot
Tags
Property features AI
Exterior
- Parking: Covered parking
- Utilities: Electricity connected; Public sewer; Public utilities
- Home design: Quadruplex property
- Construction: Stucco construction; Composition roof; Concrete perimeter foundation; Built as a two-level structure
- Exterior features: Urban lot setting; Composition roof; Stucco exterior; Concrete perimeter foundation; Two stories
Interior
- Bathrooms: Four bathrooms
- Heating & cooling: Central heat/central cool
- Interior features: Central heating and cooling; No fireplace
Neighborhood map
What this means for you Summary
Snapshot
- This is a 4 × 2-bed/1.0-bath units multifamily listed at $899k.
Deal economics
- At list price, monthly cash flow is $358 ($4k/yr) — positive. Per door: $89/mo.
- The deal already cash-flows at list — no discount required.
- To meet the 1% rule (rent ≥ 1% of price), the offer needs to be $725k (19.4% below list).
- Recommended offer: $725k (19.4% below list) — sets the bar for 1% rule.
- Cap rate 6.8% vs local median 3.8% in Lemoore — top-decile yield for the area; either an underpriced asset or a hidden risk that comps aren't pricing in. Stress-test before assuming the spread holds.
Location & tenants
- Location reads 58/100 on livability (#728 in CA) — a working-class tenant base; expect higher turnover. Strengths: commute A+, housing A+; Watch: amenities F, cost of living F, health & safety F.
- Lemoore Union High (suburban): math 25% / reading 55% proficiency, ranked #235 of 517 in CA (top 46%) — families likely to look elsewhere, expect single-tenant / working-renter base with shorter leases.
- Zoned schools: P. W. Engvall Elementary (math 39% / reading 52%, grade D-, #485 of 1,571 statewide, top 31%, 509 students, 78% FRL); Liberty Middle (math 41% / reading 58%, grade C, #104 of 498 statewide, top 21%, 666 students, 77% FRL); Lemoore High (math 27% / reading 59%, grade F, #460 of 1,170 statewide, top 40%, 1,861 students, 52% FRL).
- Market conditions: Rents rising (+2.9%/yr); 148 active listings in the ZIP; solid renter incomes; 741 units permitted in Kings County in 2024 (307 in 5+ unit buildings).
- At $7,246/mo this rent would consume 108% of the median local household income ($80k/yr) (locally 1317% of renters already pay >50% of income on rent) — very limited rent-growth headroom before tenants either downsize or default.
Forward outlook
- Local home prices are declining (-3.0%/yr); year-one equity from $6k of loan paydown is wiped out by about $27k of value loss. Plan a longer hold.
Negotiation context
- It's been on market 102 days — a 9% lower offer ($818k) is reasonable based on typical stale-listing flexibility.
- 5 sale attempts since 12y ago with the ask held roughly flat each time — persistent listings suggest the price (not the market) is what's stuck; bring a comps-based counter.
- Current owner paid $260k; list at $899k implies a 246% gain — meaningful room to come down on a strong offer.
Risks & watch-outs
- Climate carrying-cost: moderate wildfire risk; extreme-heat days projected 7→17/yr by 2055 (HVAC capex compounding) — expect insurance premiums to compound above CPI over the hold.
Questions for the listing agent
- It's been on market 102 days. Have you received any prior offers? Is the seller open to a 19% concession, seller financing, or rate buy-down credit?
- Can we see the unit-by-unit rent roll, current vacancy, and any below-market leases? What's the average tenancy length?
- What capital expenditures (roof, boiler, parking lot, exteriors) have been made in the last 5 years, and what's planned in the next 2?
- Built in 1964 — when were the roof, HVAC, electrical panel, plumbing, and water heater last replaced?
- Why hasn't it sold? Are there any deal-killer items the seller is aware of (foundation, flood, title, zoning, code violations)?
- Is there a deadline driving the sale (1031 exchange, divorce, estate, relocation)? That informs how much negotiation room exists.
- Schools are D-rated, which usually means shorter tenancies and higher turnover. Who's the typical renter profile here, and what's been the actual vacancy rate?
- The area grade is low — what's the realistic commute time and amenity access for the typical tenant pool here? Any planned neighborhood developments (good or bad) we should know about?
- What's the average days-on-market for RENTAL listings here right now (not sales)? A rising rental-DOM trend means longer vacancies and softer asking-rent achievability than the comps imply.
- What's the recent tenant-quality profile in this submarket — average credit score on applications, eviction rate, late-payment / NSF rate, and stable-employment percentage? A property-management company in the area should have these aggregated.
- How much new apartment / multifamily construction is in the pipeline within 1–3 miles? Heavy new supply (>2% of stock underway) typically softens rents 12–24 months out; light construction supports rent growth.
Investment metrics
- 1% rule
- 0.81% ✗
- Cap rate
- 6.77%
- Cash-on-cash
- 1.71%
- DSCR
- 1.08
- GRM
- 10.3
CMA / ARV
No comps found within radius.
Projected returns pro-forma
-3.0% appreciation · 2.94% rent growth · sell at horizon
- IRR
- -13.7%
- Equity multiple
- 0.51×
- Total profit
- $-123,727
- Equity at exit
- $134,044
- IRR
- -5.0%
- Equity multiple
- 0.67×
- Total profit
- $-81,844
- Equity at exit
- $77,729
Cash invested: $251,720 (down + closing). Projections, not guarantees.
Landlord ↔ Tenant lean methodology
- Overall (STATE)
- 18 Strongly Tenant-Friendly
- State California
- 18 Strongly Tenant-Friendly · D+13
- County
- — inherits STATE
- City
- — inherits STATE
ZIP-level market 93245
- Rents YoY
- 2.9%
- Active inventory
- 148
- Price-to-rent
- 41.4×
Monthly cashflow live
- Estimated rent
- $7,246 high interval (Pro) →
- Mortgage (P&I)
- −$4,714
- Tax from tax record
- −$277 /mo · $3,328/yr
- Insurance
- −$375
- HOA
- −$0
- Lot rent
- −$0
- Vacancy / Maint / Mgmt
- −$1,522
- Net cashflow
- $358
Break-even live
Sensitivity live
| Price | -10% $867 | -5% $612 | +0% $358 | +5% $103 | +10% $-151 |
|---|---|---|---|---|---|
| Rent | -10% $-214 | -5% $72 | +0% $358 | +5% $644 | +10% $930 |
| Rate | -1.0pp $811 | -0.5pp $587 | base $358 | +0.5pp $125 | +1.0pp $-112 |
4-unit breakdown (identical units grouped — click to expand)
| Units | Beds | Baths | Est. rent |
|---|---|---|---|
| 4× units | 2 | 1 | $7,244 |
| #1 | 2 | 1 | $1,811 |
| #2 | 2 | 1 | $1,811 |
| #3 | 2 | 1 | $1,811 |
| #4 | 2 | 1 | $1,811 |
| Total (4 units) | $7,246 | ||
UW: 25.0% down · 7.5% · 30yr · 1.5% tax · 5.0% vac · 8.0% maint · 8.0% mgmt
Financing live
Cash to close
- Down payment
- $224,750
- Closing costs
- $26,970
- Reserves months
- —
- Total cash needed
- —
Loan-product check · same deal, 3 products live
Conventional
25% down · 7.5% · 30yr
- Down + closing
- —
- Monthly P&I
- —
- Monthly cashflow
- —
- DSCR
- —
- Eligible?
- —
Personal DTI + credit; lowest rate.
DSCR
20% down · 8.5% · 30yr
- Down + closing
- —
- Monthly P&I
- —
- Monthly cashflow
- —
- DSCR
- —
- Eligible?
- —
No personal income docs; deal must DSCR.
Hard money
10% down · 12.0% · 12mo
- Down + closing
- —
- Monthly P&I
- —
- Monthly cashflow
- —
- DSCR
- —
- Eligible?
- —
Short-term bridge; refi at stabilization.
Listing history 29 events
-
2026-06-22days on market $899,000 Active 102 DOM
-
2026-06-21days on market $899,000 Active 101 DOM
-
2026-06-19days on market $899,000 Active 99 DOM
-
2026-06-18days on market $899,000 Active 98 DOM
-
2026-06-17days on market $899,000 Active 97 DOM
-
2026-06-16days on market $899,000 Active 96 DOM
-
2026-06-15days on market $899,000 Active 95 DOM
-
2026-06-14days on market $899,000 Active 93 DOM
-
2026-06-13days on market $899,000 Active 92 DOM
-
2026-06-10days on market $899,000 Active 90 DOM
-
2026-06-09days on market $899,000 Active 89 DOM
-
2026-06-08days on market $899,000 Active 88 DOM
-
2026-06-07days on market $899,000 Active 87 DOM
-
2026-06-05days on market $899,000 Active 84 DOM
-
2026-06-03days on market $899,000 Active 83 DOM
-
2026-06-02days on market $899,000 Active 82 DOM
-
2026-06-01days on market $899,000 Active 81 DOM
-
2026-05-31days on market $899,000 Active 80 DOM
-
2026-05-30days on market $899,000 Active 79 DOM
-
2026-04-10price $899,000
-
2026-03-12$899,000 Active 251-char remark
Show marketing remark (251 chars)
Great investment opportunity in Lemoore. This 4-unit multifamily property offers strong income potential for investors or owner-occupants looking to build their portfolio. Conveniently located near shopping, dining, schools, and major commuter routes.
-
2026-03-09$1,200,000 Active
-
2018-01-25historical
-
2017-08-18$350,000
-
2017-08-17$350,000
-
2014-10-27soldstatus $260,000
-
2014-10-27soldstatus $260,000
-
2014-07-02$285,000
-
1993-06-01soldstatus $125,000
ⓘ Source: listings_history table (triggers on properties + properties_extension) + one-shot
backfill from property_details.listing_events for pre-trigger history.
Tax reassessment forecast CA · Resets to sale price
- Current annual tax
- $3,328 · $277/mo
- Projected year-2 tax
- $6,832 · $569/mo
- Expected delta
- +$3,504/yr (+$292/mo · 105.3%)
ⓘ Screening estimate from a state-policy table — verify with the county assessor before closing.
Climate risk First Street
- Flood 1/10 Low FEMA zone X (unshaded) · 0% chance over 30 yrs
- Wildfire 5/10 Major
- Heat 8/10 Severe 7 d/yr ≥105°F today · 17 d/yr by 30 yrs out
- Wind 1/10 Low
- Air quality 10/10 Extreme 30 unhealthy d/yr today · 32 by 30 yrs out
Nearby sold comps map
Loading sold comps map…
Walkable amenities ~0.75 mi
Loading nearby amenities…
Taxation est. · year 1
- Rental income
- $86,952
- − Mortgage interest
- −$50,358
- − Property taxes
- −$3,328
- − Insurance
- −$4,495
- − Repairs & maintenance
- −$6,956
- − Management
- −$6,956
- − Depreciation
- −$26,153
- Taxable loss
- −$11,294
- Est. tax savings @ 24.0%
- +$2,711
- After-tax cash flow
- $7,006/yr
For passive investors: Depreciation is non-cash, so a rental often shows a tax loss while cash-flowing — sheltering income. Rental losses are passive: they offset passive income freely, and up to $25,000/yr can offset ordinary (W-2) income if you actively participate and your MAGI is under $100k (phasing out to $0 by $150k); unused losses carry forward. On sale, claimed depreciation is recaptured at up to 25%, and gains may owe capital-gains tax (a 1031 exchange can defer both). Figures are a year-1 estimate at your 24.0% rate — not tax advice; consult a CPA.
Schools (NCES district)
- District
- Lemoore Union High
- NCES district ID
- 0621400
- Math proficiency
- 25% ▲ 6.00%
- Reading proficiency
- 55% ▲ 3.00%
- Median HH income
- $54,752
- Composite
- 34.83/100
- National rank
- #5097
- State rank
- #235 of 517 in CA
Livability — Lemoore
- Score
- 58/100
- State rank
- #728
- US rank
- #21473
Category grades
Schools grade is shown separately in the Schools card above.
Census & demographics
- Census place
- Lemoore, CA
- County
- Kings County · 107,655 people
- City population
- 37,971
- Metro
- Hanford-Corcoran, CA
- Population (ZIP)
- 37,971
- Household income
- $80,412
- Rent vs Own
- Severe rent burden
- 1317.0
Population outlook (Kings County) Hauer SSP2
- Today (2025)
- 147,136 people
- By 2030
- 145,623 · -1.0%
- By 2040
- 146,017 · -0.8%
- By 2050
- 145,239 · -1.3%
- By 2075
- 131,479 · -10.6%
- By 2100
- 103,967 · -29.3%
Race, ethnicity, and origin ACS 2023
- Neighborhood character
- Diverse neighborhood (Simpson 0.66)
- Race & ethnicity
- Hispanic / Latino 44% White 37% Two or more races 19% Black 7% Asian 6% Native American 2%
- Hispanic origin (detail)
- Mexican 39%
- Common ancestry
- Italian 4% Russian 4% Lithuanian 2%
- Foreign-born
- 14% · Canada
- Languages at home
- 68% English-only · Spanish 26% Tagalog/Filipino 3% Other Indo-European 1%
Political lean MEDSL · Kings
- 2024 margin
- Strong R (+23.0) · D 37.4% · R 60.4% · Other 2.2%
- 2008→2024 swing
- -8.9pp toward R · 2008: -14.1pp · 2024: -23.0pp
- All cycles
- 2024: R+23.0 2020: R+12.2 2016: R+14.1 2012: R+16.3 2008: R+14.1
Not yet ingested
- Civics
- —
Market trends
- HPI YoY
- ▼ -268.40%
- Current HPI
- 272.7794
- Rent YoY
- ▲ 2.94%
- Metro
- Hanford-Corcoran, CA
- State GDP YoY
- ▲ 3.21%
- F500 in state
- 116
Industry mix (Fortune 500 HQ in CA)
| Industry | F500 HQs | Revenue |
|---|---|---|
| Technology | 27 | $1,492B |
|
||
| Financial Services | 3 | $174B |
|
||
| Retail | 3 | $44B |
|
||
| Insurance | 3 | $26B |
|
||
| Media / Entertainment | 2 | $115B |
|
||
| Pharmaceuticals / Biotech | 2 | $62B |
|
||
Price history
+619.2% since first listed10 events — show timeline
- 2026-04-10 Price Changed $899,000 FRESNOMLS
- 2026-03-12 Listed $899,000 KCBOR
- 2026-03-09 Listed $1,200,000 FRESNOMLS
- 2018-01-25 Listing Removed — CRMLS
- 2017-08-18 Listed $350,000 CRMLS
- 2017-08-17 Listed $350,000 FRESNOMLS
- 2014-10-27 Sold (Public Records) $260,000 Public Records
- 2014-10-27 Sold (MLS) $260,000 KCBOR
- 2014-07-02 Listed $285,000 KCBOR
- 1993-06-01 Sold (Public Records) $125,000 Public Records
Property tax history
+5.2%/yrLatest (2025): $3,328 · +5.0% YoY. Source: county tax records.
Cash-flow waterfall
monthlySold comps — $/sqft
last 12 mo · ≤1 miLoading sold comps…