 Triplex
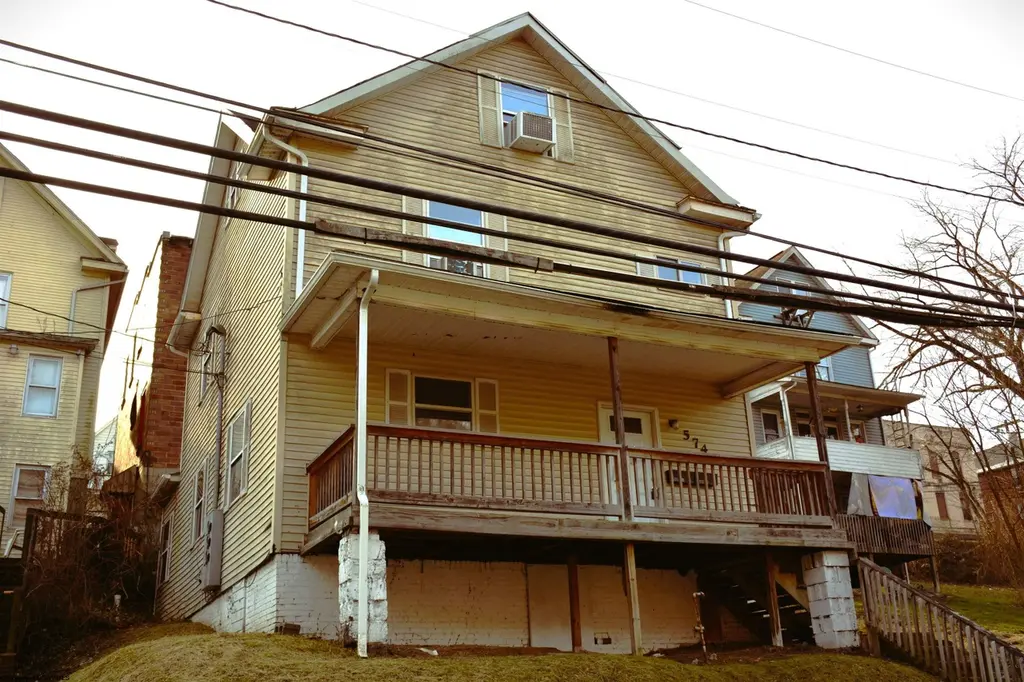
574 Pennsylvania · Morgantown, WV
Flood risk 5/10 · Moderate
- FEMA flood zone
- X (unshaded)
- Chance of flooding over 30 yrs
- 0.64%
- Est. flood insurance / yr
- $473 – $860
Fire risk 1/10 · Minimal
- Est. fire insurance / yr
- $787 – $1,461
Heat risk 4/10 · Minor
- Hot days now (above 97°F)
- 7 days/yr
- Hot days in 30 yrs
- 19 days/yr
Wind risk 1/10 · Minimal
- Chance of severe wind over 30 yrs
- —
Air-quality risk 2/10 · Minimal
- Unhealthy air days now
- 1 days/yr
- Unhealthy air days in 30 yrs
- 2 days/yr
Risk factors via First Street. Map © Google.
Why this score? — see what drove the B+ grade
The composite is a weighted blend of 9 inputs, each scored 0–100. Each bar is that input's sub-score; the figure is the points it added to the 100-point composite (weight × sub-score).
- Cash flow +30.0/30.0
- ARV discount +15.0/15.0
- 1% rule +10.0/10.0
- DSCR +10.0/10.0
- Livability +4.2/5.0
- Schools +4.1/10.0
- Rent growth +2.9/5.0
- Condition / age +2.5/5.0
- Appreciation +0.0/10.0
$149,900
🖨 Deal sheet 📄 Offer letter ✓ Due diligence
Multi-family units
County records classify this as Multi-Family (2-4 Unit). Listing-text estimate: 3 units. confirmed
Listing remarks MLS
3 STORY, 3 UNIT RENTAL with all utilities separated in downtown Morgantown. Common laundry Room for all units on 1st floor.
Key facts
- 3 unit rental
- 3 story
- Common laundry room
Tags
Neighborhood map
What this means for you Summary
Snapshot
- This is a 3 × 2-bed/1.0-bath units multifamily listed at $150k.
Deal economics
- At list price, monthly cash flow is $1k ($15k/yr) — positive. Per door: $416/mo.
- The deal already cash-flows at list — no discount required.
- Meets the 1% rule at list price ($3k rent vs $150k).
- Recommended offer: $132k (12.0% below list) — sets the bar for market timing.
- Cap rate 16.3% vs local median 3.1% in Morgantown — top-decile yield for the area; either an underpriced asset or a hidden risk that comps aren't pricing in. Stress-test before assuming the spread holds.
Location & tenants
- Location reads 84/100 on livability (#5 in WV, #674 nationally) — a professional / high-income tenant draw. Strengths: amenities A+, commute A+, cost of living A+; Watch: schools D+, employment D-.
- Monongalia County Schools (urban): math 45% / reading 53% proficiency, ranked #1 of 55 in WV (top 2%) — families likely to look elsewhere, expect single-tenant / working-renter base with shorter leases.
- Market conditions: Rents rising (+1.4%/yr); 129 active listings in the ZIP; 23 units permitted in Monongalia County in 2024 (15 in 5+ unit buildings).
- At $2,825/mo this rent would consume 53% of the median local household income ($64k/yr) (locally 595% of renters already pay >50% of income on rent) — very limited rent-growth headroom before tenants either downsize or default.
Forward outlook
- Local home prices are declining (-3.0%/yr); year-one equity from $1k of loan paydown is wiped out by about $4k of value loss. Plan a longer hold.
- Monongalia County population projected at +38% by 2050 — long-run rental-demand tailwind backs the buy-and-hold thesis.
- At projected returns (-3.0% appreciation + 1.4% rent growth), your $42k cash investment doubles in ~4 years — after that, you're playing with house money.
Negotiation context
- It's been on market 140 days — a 12% lower offer ($132k) is reasonable based on typical stale-listing flexibility.
- 3 sale attempts since 4y ago with the ask held roughly flat each time — persistent listings suggest the price (not the market) is what's stuck; bring a comps-based counter.
Risks & watch-outs
- Watch-outs: built in 1911 — expect roof / HVAC / electrical / plumbing capex.
- Climate carrying-cost: moderate flood risk — expect insurance premiums to compound above CPI over the hold.
Questions for the listing agent
- It's been on market 140 days. Have you received any prior offers? Is the seller open to a 12% concession, seller financing, or rate buy-down credit?
- Can we see the unit-by-unit rent roll, current vacancy, and any below-market leases? What's the average tenancy length?
- What capital expenditures (roof, boiler, parking lot, exteriors) have been made in the last 5 years, and what's planned in the next 2?
- Built in 1911 — when were the roof, HVAC, electrical panel, plumbing, and water heater last replaced?
- Why hasn't it sold? Are there any deal-killer items the seller is aware of (foundation, flood, title, zoning, code violations)?
- Is there a deadline driving the sale (1031 exchange, divorce, estate, relocation)? That informs how much negotiation room exists.
- Schools are D-rated, which usually means shorter tenancies and higher turnover. Who's the typical renter profile here, and what's been the actual vacancy rate?
- What's the average days-on-market for RENTAL listings here right now (not sales)? A rising rental-DOM trend means longer vacancies and softer asking-rent achievability than the comps imply.
- What's the recent tenant-quality profile in this submarket — average credit score on applications, eviction rate, late-payment / NSF rate, and stable-employment percentage? A property-management company in the area should have these aggregated.
- How much new apartment / multifamily construction is in the pipeline within 1–3 miles? Heavy new supply (>2% of stock underway) typically softens rents 12–24 months out; light construction supports rent growth.
Investment metrics
- 1% rule
- 1.88% ✓
- Cap rate
- 16.29%
- Cash-on-cash
- 35.69%
- DSCR
- 2.59
- GRM
- 4.4
CMA / ARV
- ARV (median comp)
- $191,777
- List price
- $149,900
- Delta
- -21.84%
- Verdict
- UNDERPRICED
- Comps
- 20 within 1.0 mi
Show comp detail 7 sales within ~0.75 mi
| Address | Dist | Beds/Ba | Sqft | Sold | Price | $/sf | Match |
|---|---|---|---|---|---|---|---|
| 417 Pennsylvania | 0.19mi | 3/3.0 (-1) | 1,827 (+2%) | 17mo | $112,500 | $62 | 69 |
| 450 Dallas St | 0.27mi | 5/2.5 (+1) | 1,815 (+1%) | 12mo | $170,000 | $94 | 69 |
| 309 Green St | 0.19mi | 4/2.0 | 1,600 (-11%) | 5mo | $272,500 | $170 | 65 |
| 565 E Brockway | 0.37mi | 4/2.0 | 1,773 (-1%) | 21mo | $150,000 | $85 | 58 |
| 301 Richwood Ave | 0.23mi | 5/2.0 (+1) | 1,680 (-6%) | 19mo | $166,000 | $99 | 54 |
| 228 Cornell Ave | 0.62mi | 5/2.5 (+1) | 1,625 (-10%) | 22mo | $205,500 | $126 | 30 |
| 980 Willey St | 0.56mi | 3/1.0 (-1) | 1,550 (-14%) | 15mo | $125,000 | $81 | 25 |
Match score weights: distance 35% · size 25% · config 20% · recency 20%. Top-matched comps best support the ARV.
Projected returns pro-forma
-3.0% appreciation · 1.42% rent growth · sell at horizon
- IRR
- 29.6%
- Equity multiple
- 2.21×
- Total profit
- $50,797
- Equity at exit
- $22,351
- IRR
- 36.0%
- Equity multiple
- 4.08×
- Total profit
- $129,066
- Equity at exit
- $12,961
Cash invested: $41,972 (down + closing). Projections, not guarantees.
Landlord ↔ Tenant lean methodology
- Overall (STATE)
- 83 Strongly Landlord-Friendly
- State West Virginia
- 83 Strongly Landlord-Friendly · R+22
- County
- — inherits STATE
- City
- — inherits STATE
ZIP-level market 26501
- Home prices YoY
- -30.1%
- Rents YoY
- 1.4%
- Active inventory
- 129
- Price-to-rent
- 13.3×
Monthly cashflow live
- Estimated rent
- $2,825 medium interval (Pro) →
- Mortgage (P&I)
- −$786
- Tax from tax record
- −$135 /mo · $1,620/yr
- Insurance
- −$62
- HOA
- −$0
- Vacancy / Maint / Mgmt
- −$593
- Net cashflow
- $1,248
Break-even live
3-unit breakdown (identical units grouped — click to expand)
| Units | Beds | Baths | Est. rent |
|---|---|---|---|
| 3× units | 2 | 1 | $2,826 |
| #1 | 2 | 1 | $942 |
| #2 | 2 | 1 | $942 |
| #3 | 2 | 1 | $942 |
| Total (3 units) | $2,825 | ||
UW: 25.0% down · 7.5% · 30yr · 1.5% tax · 5.0% vac · 8.0% maint · 8.0% mgmt
Financing live
Cash to close
- Down payment
- $37,475
- Closing costs
- $4,497
- Reserves months
- —
- Total cash needed
- —
Loan-product check · same deal, 3 products live
Conventional
25% down · 7.5% · 30yr
- Down + closing
- —
- Monthly P&I
- —
- Monthly cashflow
- —
- DSCR
- —
- Eligible?
- —
Personal DTI + credit; lowest rate.
DSCR
20% down · 8.5% · 30yr
- Down + closing
- —
- Monthly P&I
- —
- Monthly cashflow
- —
- DSCR
- —
- Eligible?
- —
No personal income docs; deal must DSCR.
Hard money
10% down · 12.0% · 12mo
- Down + closing
- —
- Monthly P&I
- —
- Monthly cashflow
- —
- DSCR
- —
- Eligible?
- —
Short-term bridge; refi at stabilization.
Listing history 29 events
-
2026-06-19days on market $149,900 Active 140 DOM
-
2026-06-18days on market $149,900 Active 139 DOM
-
2026-06-17days on market $149,900 Active 138 DOM
-
2026-06-16days on market $149,900 Active 137 DOM
-
2026-06-15days on market $149,900 Active 136 DOM
-
2026-06-14days on market $149,900 Active 134 DOM
-
2026-06-13days on market $149,900 Active 133 DOM
-
2026-06-10days on market $149,900 Active 131 DOM
-
2026-06-09days on market $149,900 Active 130 DOM
-
2026-06-08days on market $149,900 Active 129 DOM
-
2026-06-07days on market $149,900 Active 128 DOM
-
2026-06-05days on market $149,900 Active 125 DOM
-
2026-06-03days on market $149,900 Active 124 DOM
-
2026-06-02days on market $149,900 Active 123 DOM
-
2026-06-01days on market $149,900 Active 122 DOM
-
2026-05-31days on market $149,900 Active 121 DOM
-
2026-05-30days on market $149,900 Active 120 DOM
-
2026-01-30$149,900 Active 123-char remark
Show marketing remark (123 chars)
3 STORY, 3 UNIT RENTAL with all utilities separated in downtown Morgantown. Common laundry Room for all units on 1st floor.
-
2025-07-23price $154,900
-
2024-07-30price $194,900
-
2024-05-04historical $800
-
2024-03-26price $800
-
2024-02-20price $849
-
2024-02-17$850
-
2023-06-25historical
-
2022-09-16soldstatus $169,000
-
2022-09-15soldstatus $169,000
-
2022-05-16$169,900
-
2008-09-23soldstatus $163,000
ⓘ Source: listings_history table (triggers on properties + properties_extension) + one-shot
backfill from property_details.listing_events for pre-trigger history.
Tax reassessment forecast WV · Resets to sale price
- Current annual tax
- $1,620 · $135/mo
- Projected year-2 tax
- $1,620 · $135/mo
- Expected delta
- $0/yr ($0/mo · 0.0%)
ⓘ Screening estimate from a state-policy table — verify with the county assessor before closing.
Climate risk First Street
- Flood 5/10 Major FEMA zone X (unshaded) · 64% chance over 30 yrs
- Wildfire 1/10 Low
- Heat 4/10 Moderate 7 d/yr ≥97°F today · 19 d/yr by 30 yrs out
- Wind 1/10 Low
- Air quality 2/10 Low 1 unhealthy d/yr today · 2 by 30 yrs out
Nearby sold comps map
Loading sold comps map…
Walkable amenities ~0.75 mi
Loading nearby amenities…
Taxation est. · year 1
- Rental income
- $33,900
- − Mortgage interest
- −$8,397
- − Property taxes
- −$1,620
- − Insurance
- −$750
- − Repairs & maintenance
- −$2,712
- − Management
- −$2,712
- − Depreciation
- −$4,361
- Taxable income
- $13,349
- Est. tax owed @ 24.0%
- −$3,204
- After-tax cash flow
- $11,775/yr
For passive investors: Depreciation is non-cash, so a rental often shows a tax loss while cash-flowing — sheltering income. Rental losses are passive: they offset passive income freely, and up to $25,000/yr can offset ordinary (W-2) income if you actively participate and your MAGI is under $100k (phasing out to $0 by $150k); unused losses carry forward. On sale, claimed depreciation is recaptured at up to 25%, and gains may owe capital-gains tax (a 1031 exchange can defer both). Figures are a year-1 estimate at your 24.0% rate — not tax advice; consult a CPA.
Schools (NCES district)
- District
- Monongalia County Schools
- NCES district ID
- 5400930
- Math proficiency
- 45% ▼ -5.00%
- Reading proficiency
- 53% ▼ -2.00%
- Median HH income
- $43,820
- Composite
- 41.34/100
- National rank
- #3503
- State rank
- #1 of 55 in WV
Livability — Morgantown
- Score
- 84/100
- State rank
- #5
- US rank
- #674
Category grades
Schools grade is shown separately in the Schools card above.
Census & demographics
- Census place
- Morgantown, WV
- County
- Monongalia County · 97,252 people
- City population
- 97,252
- Metro
- Morgantown, WV
- Population (ZIP)
- 19,529
- Household income
- $63,529
- Rent vs Own
- Severe rent burden
- 595.0
Population outlook (Monongalia County) Hauer SSP2
- Today (2025)
- 122,188 people
- By 2030
- 131,536 · +7.7%
- By 2040
- 149,777 · +22.6%
- By 2050
- 168,245 · +37.7%
- By 2075
- 207,979 · +70.2%
- By 2100
- 239,430 · +96.0%
Race, ethnicity, and origin ACS 2023
- Neighborhood character
- Predominantly White (88%)
- Race & ethnicity
- White 88% Black 6% Two or more races 3% Hispanic / Latino 2% Asian 1%
- Common ancestry
- Slovak 4% Italian 3% Romanian 3%
- Foreign-born
- 2% · Canada
- Languages at home
- 96% English-only · Spanish 2%
Political lean MEDSL · Monongalia
- 2024 margin
- Toss-up / Even · D 46.5% · R 50.9% · Other 2.7%
- 2008→2024 swing
- -8.2pp toward R · 2008: 3.9pp · 2024: -4.4pp
- All cycles
- 2024: R+4.4 2020: R+1.2 2016: R+10.4 2012: R+9.7 2008: D+3.9
Not yet ingested
- Civics
- —
Market trends
- HPI YoY
- ▼ -95.15%
- Current HPI
- 220.911
- Rent YoY
- ▲ 1.42%
- Metro
- Morgantown, WV
- State GDP YoY
- —
- F500 in state
- 0
Price history
-8.0% since first listed12 events — show timeline
- 2026-01-30 Listed $149,900 NCWVREIN
- 2025-07-23 Price Changed $154,900 NCWVREIN
- 2024-07-30 Price Changed $194,900 NCWVREIN
- 2024-05-04 Rental Removed $800 BUILDIUM
- 2024-03-26 Price Changed $800 BUILDIUM
- 2024-02-20 Price Changed $849 BUILDIUM
- 2024-02-17 Listed for Rent $850 BUILDIUM
- 2023-06-25 Rental Removed — BUILDIUM
- 2022-09-16 Sold (Public Records) $169,000 Public Records
- 2022-09-15 Sold (MLS) $169,000 NCWVREIN
- 2022-05-16 Listed $169,900 NCWVREIN
- 2008-09-23 Sold (Public Records) $163,000 Public Records
Property tax history
+2.7%/yrLatest (2025): $1,620 · +0.2% YoY. Source: county tax records.
Cash-flow waterfall
monthlySold comps — $/sqft
last 12 mo · ≤1 miLoading sold comps…