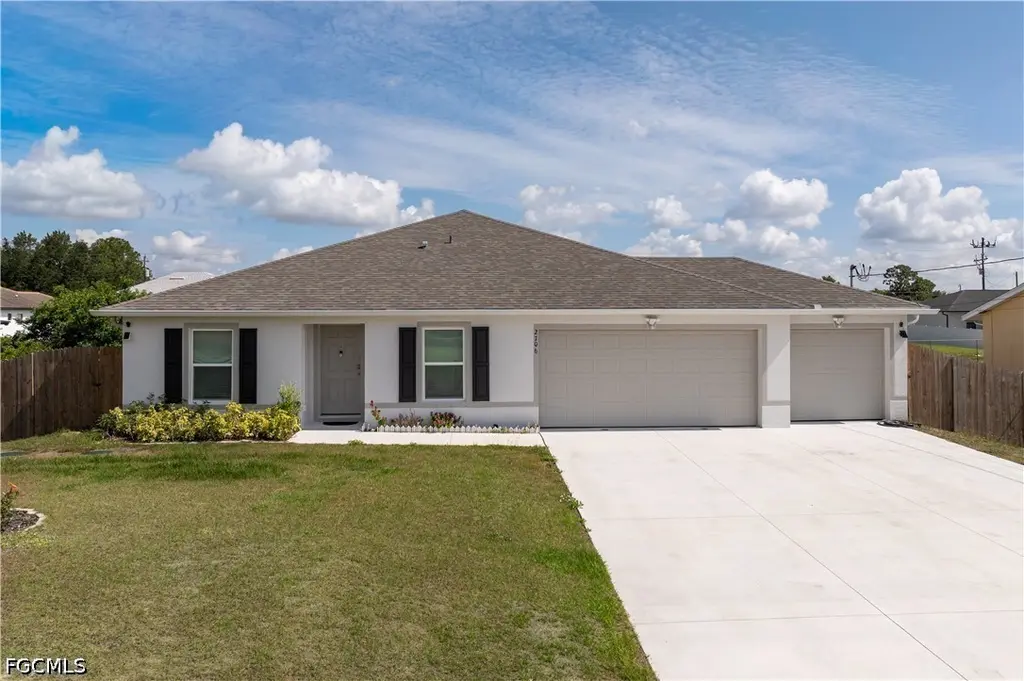
2706 9th St SW · Lehigh Acres, FL
Flood risk 1/10 · Minimal
- FEMA flood zone
- X (unshaded)
- Chance of flooding over 30 yrs
- 0.0%
- Est. flood insurance / yr
- $507 – $1,088
Fire risk 1/10 · Minimal
- Est. fire insurance / yr
- $947 – $1,759
Heat risk 10/10 · Severe
- Hot days now (above 107°F)
- 7 days/yr
- Hot days in 30 yrs
- 27 days/yr
Wind risk 10/10 · Severe
- Chance of severe wind over 30 yrs
- 99.0%
Air-quality risk 2/10 · Minimal
- Unhealthy air days now
- 1 days/yr
- Unhealthy air days in 30 yrs
- 1 days/yr
Risk factors via First Street. Map © Google.
Why this score? — see what drove the D- grade
The composite is a weighted blend of 9 inputs, each scored 0–100. Each bar is that input's sub-score; the figure is the points it added to the 100-point composite (weight × sub-score).
- Appreciation +10.0/10.0
- ARV discount +7.8/15.0
- Cash flow +7.3/30.0
- Schools +4.1/10.0
- Livability +3.0/5.0
- Condition / age +2.5/5.0
- Rent growth +2.1/5.0
- 1% rule +1.4/10.0
- DSCR +1.4/10.0
$355,000
🖨 Deal sheet (PDF) 📄 Offer letter ✓ Due diligence
Listing remarks
Welcome to this beautifully built 2024 ranch-style home offering modern comfort, space, and privacy on a generous 10,892 sqft fully fenced lot tucked away on a quiet private street in Lehigh Acres. Boasting 1,805 sqft under air, this 4-bedroom + den, 2-bath home with a 3-car garage features an inviting open-concept layout with spacious living and dining areas, a large breakfast island, abundant cabinetry, and plenty of prep space for cooking and entertaining. The versatile den/office is perfect for working from home, a playroom, or flex space. Enjoy peace of mind with a whole-house reverse osmosis water treatment system and relax year-round on the spacious screened back porch overlooking th
Key facts
- Ranch style home
- Quiet private street
- Fully fenced lot
Tags
Property features AI
Finance
- Other: Lot is rectangular with public maintained road access; Lot dimensions approx. 80 x 137; Zoning: RS-1; Irrigation from well
- Financial info: Pets allowed
- HOA & community: No association fee
Exterior
- Parking: Attached 3-car garage; Driveway parking; Paved parking
- Security: Smoke detectors
- Utilities: Well water; Septic tank; Cable available; High-speed internet available
- Home design: Single-story home; Entry level: 1; Faces south; Resale property
- Construction: Built with block and concrete; Shingle roof
- Exterior features: Fenced yard; Patio; Lanai; Screened porch; Porch; Shutters (manual); North exposure
Interior
- Kitchen: Dishwasher; Range; Microwave; Refrigerator; Kitchen island; Pantry; Water purifier (reverse osmosis)
- Bedrooms: Bedroom located on main level
- Flooring: Carpet; Tile
- Bathrooms: 2 full bathrooms
- Heating & cooling: Central heating (electric); Central air conditioning (electric)
- Interior features: Bedroom on main level; Family/dining room; Living/dining room; Kitchen island; Pantry; Shower only with separate shower; Walk-in closets; Window treatments; Split bedroom layout; Single-hung windows
- Laundry & utility: Inside laundry; Washer; Dryer; Tankless water heater
Neighborhood map
What this means for you Summary
Snapshot
- This is a 4-bed/2.0-bath single-family listed at $355k.
Deal economics
- At list price, monthly cash flow is $-476 ($-6k/yr) — negative.
- To cash-flow at today's rent, offer at most $271k (23.7% below list).
- To meet the 1% rule (rent ≥ 1% of price), the offer needs to be $229k (35.6% below list).
- Recommended offer: $229k (35.6% below list) — sets the bar for 1% rule.
Location & tenants
- Location reads 59/100 on livability (#826 in FL) — a working-class tenant base; expect higher turnover. Strengths: cost of living A+, housing A+; Watch: crime C-, employment D+, amenities F.
- Lee (suburban): math 47% / reading 50% proficiency, ranked #42 of 73 in FL (top 58%) — families likely to look elsewhere, expect single-tenant / working-renter base with shorter leases.
- Zoned schools: Veterans Park Academy For The Arts (math 41% / reading 45%, grade F, #1,366 of 2,144 statewide, top 64%, 2,133 students, 36% FRL); Oak Hammock Middle School (math 43% / reading 41%, grade D-, #340 of 571 statewide, top 61%, 1,563 students, 56% FRL); Lehigh Senior High School (math 23% / reading 45%, grade F, #394 of 667 statewide, top 60%, 2,476 students, 57% FRL).
- Market conditions: Rents soft (-1.5%/yr); 788 active listings in the ZIP; 40 comparable units currently listed for rent nearby; rentals at typical pace (median 23d on market — plan ~3-4 weeks tenant-placement turnaround); 15,411 units permitted in Lee County in 2024 (4,686 in 5+ unit buildings).
- This rent runs 38% of the median local income ($73k/yr) — at the standard rent-burdened threshold; future hikes will face affordability resistance.
Forward outlook
- In year one you build about $38k of equity ($2k loan paydown + $36k appreciation (10.0% local appreciation)).
- Lee County population projected at +44% by 2050 — long-run rental-demand tailwind backs the buy-and-hold thesis.
- By year 2, paydown + projected appreciation supports a ~$61k cash-out refi (75% LTV) — recoverable capital for the next deal without selling this one.
Negotiation context
- It's been on market 55 days — a 3% lower offer ($344k) is reasonable based on typical stale-listing flexibility.
- Current owner paid $22k; list at $355k implies a 1551% gain — meaningful room to come down on a strong offer.
Risks & watch-outs
- Climate carrying-cost: severe wind risk, 99% chance of damaging wind over 30y; extreme-heat days projected 7→27/yr by 2055 (HVAC capex compounding) — expect insurance premiums to compound above CPI over the hold.
Questions for the listing agent
- What do current leases actually rent for vs. the listed asking? Can we see a recent rent roll and the last 12 months of T-12 income?
- It's been on market 55 days. Have you received any prior offers? Is the seller open to a 36% concession, seller financing, or rate buy-down credit?
- Is there a deadline driving the sale (1031 exchange, divorce, estate, relocation)? That informs how much negotiation room exists.
- Schools are D-rated, which usually means shorter tenancies and higher turnover. Who's the typical renter profile here, and what's been the actual vacancy rate?
- The area grade is low — what's the realistic commute time and amenity access for the typical tenant pool here? Any planned neighborhood developments (good or bad) we should know about?
- What's the average days-on-market for RENTAL listings here right now (not sales)? A rising rental-DOM trend means longer vacancies and softer asking-rent achievability than the comps imply.
- What's the recent tenant-quality profile in this submarket — average credit score on applications, eviction rate, late-payment / NSF rate, and stable-employment percentage? A property-management company in the area should have these aggregated.
- How much new for-sale + rental construction is in the pipeline within 1–3 miles? Heavy new supply typically softens prices + rents 12–24 months out; constrained supply supports both.
Investment metrics
- 1% rule
- 0.64% ✗
- Cap rate
- 4.68%
- Cash-on-cash
- -5.75%
- DSCR
- 0.74
- GRM
- 12.9
CMA / ARV
- ARV (on-the-fly)
- $357,390
- Comps found
- 12
Show comp detail 12 sales within ~0.75 mi
| Address | Dist | Beds/Ba | Sqft | Sold | Price | $/sf | Match |
|---|---|---|---|---|---|---|---|
| 2813 10th St SW | 0.23mi | 4/2.0 | 1,824 (+1%) | 16mo | $335,000 | $184 | 74 |
| 2618 4th St SW | 0.36mi | 4/2.0 | 1,715 (-5%) | 7mo | $375,000 | $219 | 69 |
| 2808 9th St SW | 0.18mi | 3/2.0 (-1) | 1,931 (+7%) | 15mo | $340,000 | $176 | 63 |
| 209 Punta Alta Ct | 0.67mi | 4/2.0 | 1,860 (+3%) | 3mo | $240,000 | $129 | 62 |
| 1514 Markdale St E | 0.65mi | 3/2.0 (-1) | 1,706 (-6%) | 2mo | $194,900 | $114 | 54 |
| 2618 15th St SW | 0.37mi | 3/2.0 (-1) | 1,682 (-7%) | 15mo | $355,000 | $211 | 53 |
| 3000 3rd St SW | 0.60mi | 3/2.0 (-1) | 1,630 (-10%) | 1mo | $309,998 | $190 | 50 |
| 2721 1st St W | 0.57mi | 3/2.0 (-1) | 1,630 (-10%) | 8mo | $322,998 | $198 | 45 |
| 2902 17th St SW | 0.56mi | 4/3.0 | 1,583 (-12%) | 12mo | $350,000 | $221 | 39 |
| 2906 18th St SW | 0.64mi | 3/2.0 (-1) | 1,536 (-15%) | 4mo | $340,000 | $221 | 38 |
| 1400 Alwynne Dr | 0.62mi | 3/2.0 (-1) | 1,534 (-15%) | 13mo | $300,000 | $196 | 30 |
| 2500 19th St SW | 0.71mi | 3/2.0 (-1) | 1,536 (-15%) | 16mo | $355,000 | $231 | 24 |
Match score weights: distance 35% · size 25% · config 20% · recency 20%. Top-matched comps best support the ARV.
Projected returns pro-forma
10.0% appreciation · 0.0% rent growth · sell at horizon
- IRR
- 19.5%
- Equity multiple
- 2.57×
- Total profit
- $156,224
- Equity at exit
- $319,812
- IRR
- 17.4%
- Equity multiple
- 5.75×
- Total profit
- $471,775
- Equity at exit
- $689,687
Cash invested: $99,400 (down + closing). Projections, not guarantees.
Landlord ↔ Tenant lean methodology
- Overall (STATE)
- 87 Strongly Landlord-Friendly
- State Florida
- 87 Strongly Landlord-Friendly · R+3
- County
- — inherits STATE
- City
- — inherits STATE
ZIP-level market 33976
- Home prices YoY
- 6.8%
- Rents YoY
- -1.5%
- Active inventory
- 788
- Price-to-rent
- 12.9×
Monthly cashflow live
- Estimated rent
- $2,287 high interval (Pro) →
- Mortgage (P&I)
- −$1,862
- Tax from tax record
- −$274 /mo · $3,287/yr
- Insurance
- −$148
- HOA
- −$0
- Vacancy / Maint / Mgmt
- −$480
- Net cashflow
- $-476
Break-even live
Sensitivity live
| Price | -10% $-275 | -5% $-376 | +0% $-476 | +5% $-577 | +10% $-677 |
|---|---|---|---|---|---|
| Rent | -10% $-657 | -5% $-567 | +0% $-476 | +5% $-386 | +10% $-296 |
| Rate | -1.0pp $-298 | -0.5pp $-386 | base $-476 | +0.5pp $-568 | +1.0pp $-662 |
UW: 25.0% down · 7.5% · 30yr · 1.5% tax · 5.0% vac · 8.0% maint · 8.0% mgmt
Financing live
Cash to close
- Down payment
- $88,750
- Closing costs
- $10,650
- Reserves months
- —
- Total cash needed
- —
Loan-product check · same deal, 3 products live
Conventional
25% down · 7.5% · 30yr
- Down + closing
- —
- Monthly P&I
- —
- Monthly cashflow
- —
- DSCR
- —
- Eligible?
- —
Personal DTI + credit; lowest rate.
DSCR
20% down · 8.5% · 30yr
- Down + closing
- —
- Monthly P&I
- —
- Monthly cashflow
- —
- DSCR
- —
- Eligible?
- —
No personal income docs; deal must DSCR.
Hard money
10% down · 12.0% · 12mo
- Down + closing
- —
- Monthly P&I
- —
- Monthly cashflow
- —
- DSCR
- —
- Eligible?
- —
Short-term bridge; refi at stabilization.
Rent comps 40 comps
| Address | Beds | Baths | Sqft | Rent | $/sqft | DOM | Units | Dist |
|---|---|---|---|---|---|---|---|---|
| 2812 4th St SW Lehigh Acres, FL | 3.0 | 2.0 | 1751 | $1,856 | $1.06 | 25d | 1 | 0.36mi |
| 2916 7th St SW Lehigh Acres, FL | 3.0 | 2.0 | 1357 | $1,900 | $1.40 | 25d | 1 | 0.38mi |
| 2906 14th St SW Lehigh Acres, FL | 3.0 | 2.0 | 1563 | $2,450 | $1.57 | 25d | 1 | 0.43mi |
| 2909 15th St SW Lehigh Acres, FL | 3.0 | 2.0 | 1291 | $1,800 | $1.39 | 23d | 1 | 0.51mi |
| 209 Punta Alta Ct Lehigh Acres, FL | 4.0 | 2.0 | 1860 | $1,950 | $1.05 | 21d | 1 | 0.67mi |
| 2701 20th St SW Lehigh Acres, FL | 3.0 | 2.0 | 2019 | $1,900 | $0.94 | 21d | 1 | 0.70mi |
| 1507 Paula Ave S Lehigh Acres, FL | 3.0 | 2.0 | 1547 | $2,000 | $1.29 | 20d | 1 | 0.91mi |
| 2602 24th St SW Lehigh Acres, FL | 3.0 | 2.0 | 1358 | $1,800 | $1.33 | 5d | 1 | 0.92mi |
| 2709 6th St W Lehigh Acres, FL | 4.0 | 3.0 | 1915 | $2,400 | $1.25 | 23d | 1 | 0.95mi |
| 2709 6th St W Lehigh Acres, FL | 4.0 | 3.0 | 1915 | $2,400 | $1.25 | 21d | 1 | 0.95mi |
| 3008 23rd St SW Lehigh Acres, FL | 3.0 | 2.0 | 1640 | $2,350 | $1.43 | 25d | 1 | 0.98mi |
| 2914 24th St SW Lehigh Acres, FL | 3.0 | 2.0 | 1537 | $2,250 | $1.46 | 25d | 1 | 0.99mi |
| 2811 25th St SW Unit NA Lehigh Acres, FL | 3.0 | 2.0 | 1430 | $1,990 | $1.39 | 25d | 1 | 1.02mi |
| 2614 7th St W Lehigh Acres, FL | 3.0 | 2.0 | 1912 | $2,500 | $1.31 | 25d | 1 | 1.06mi |
| 2612 7th St W Lehigh Acres, FL | 3.0 | 2.0 | 1492 | $2,295 | $1.54 | 25d | 1 | 1.06mi |
| 2902 7th St W Lehigh Acres, FL | 3.0 | 2.0 | 1841 | $2,085 | $1.13 | 3d | 1 | 1.08mi |
| 2902 7th St W Lehigh Acres, FL | 3.0 | 2.0 | 1841 | $2,215 | $1.20 | 16d | 1 | 1.08mi |
| 2708 27th St SW Lehigh Acres, FL | 4.0 | 2.0 | 1698 | $2,280 | $1.34 | 5d | 1 | 1.09mi |
| 3008 25th St SW Lehigh Acres, FL | 4.0 | 2.0 | 1565 | $1,711 | $1.09 | 23d | 1 | 1.10mi |
| 18461 Copperhead Dr #421 Lehigh Acres, FL | 3.0 | 2.0 | 1301 | $1,895 | $1.46 | 25d | 1 | 1.10mi |
| 18461 Copperhead Dr #431 Lehigh Acres, FL | 3.0 | 2.0 | 1301 | $3,995 | $3.07 | 25d | 1 | 1.10mi |
| 20720 Copperhead Dr Lehigh Acres, FL | 3.0 | 3.0 | 2434 | $2,500 | $1.03 | 25d | 1 | 1.10mi |
| 20681 Copperhead Dr Lehigh Acres, FL | 3.0 | 3.0 | 2434 | $3,000 | $1.23 | 25d | 1 | 1.12mi |
| 3209 21st St SW Lehigh Acres, FL | 3.0 | 2.0 | 1418 | $1,699 | $1.20 | 4d | 1 | 1.13mi |
| 2710 28th St SW Lehigh Acres, FL | 4.0 | 2.0 | 1742 | $2,450 | $1.41 | 25d | 1 | 1.15mi |
| 9112 Aegean Cir Lehigh Acres, FL | 3.0 | 2.0 | 1409 | $1,600 | $1.14 | 5d | 1 | 1.16mi |
| 18266 Minorea Ln Lehigh Acres, FL | 3.0 | 2.0 | 1408 | $1,650 | $1.17 | 25d | 1 | 1.18mi |
| 9131 Aegean Cir Lehigh Acres, FL | 3.0 | 2.0 | 1400 | $1,574 | $1.12 | 23d | 1 | 1.19mi |
| 9131 Aegean Cir Lehigh Acres, FL | 3.0 | 2.0 | 1400 | $1,574 | $1.12 | 25d | 1 | 1.19mi |
| 3417 7th St SW Lehigh Acres, FL | 4.0 | 2.0 | 1833 | $1,850 | $1.01 | 12d | 1 | 1.23mi |
| 3201 23rd St SW Lehigh Acres, FL | 3.0 | 2.0 | 1324 | $1,845 | $1.39 | 23d | 1 | 1.24mi |
| 3109 8th St SW Lehigh Acres, FL | 3.0 | 2.0 | 1324 | $1,845 | $1.39 | 23d | 1 | 1.25mi |
| 3408 10th St SW Lehigh Acres, FL | 4.0 | 2.0 | 1920 | $1,750 | $0.91 | 15d | 1 | 1.25mi |
| 3408 10th St SW Lehigh Acres, FL | 4.0 | 2.0 | 1385 | $1,850 | $1.34 | 23d | 1 | 1.25mi |
| 20555 Copperhead Dr Lehigh Acres, FL | 4.0 | 3.0 | 2032 | $2,490 | $1.23 | 5d | 1 | 1.29mi |
| 3203 24th St SW Lehigh Acres, FL | 3.0 | 2.0 | 1498 | $2,300 | $1.54 | 23d | 1 | 1.30mi |
| 20550 Copperhead Dr Lehigh Acres, FL | 4.0 | 3.0 | 2002 | $3,500 | $1.75 | 25d | 1 | 1.31mi |
| 2612 31st St Lehigh Acres, FL | 4.0 | 2.0 | 1389 | $1,799 | $1.30 | 17d | 1 | 1.34mi |
| 2612 31st St Lehigh Acres, FL | 4.0 | 2.0 | 1365 | $1,799 | $1.32 | 15d | 1 | 1.34mi |
| 8350 Tortoise Isle Ct Lehigh Acres, FL | 3.0 | 2.0 | 1478 | $1,595 | $1.08 | 5d | 1 | 1.34mi |
Listing history 18 events
-
2026-06-22days on market $355,000 Active 55 DOM
-
2026-06-17days on market $355,000 Active 51 DOM
-
2026-06-16days on market $355,000 Active 50 DOM
-
2026-06-15days on market $355,000 Active 49 DOM
-
2026-06-13days on market $355,000 Active 47 DOM
-
2026-06-10days on market $355,000 Active 44 DOM
-
2026-06-09days on market $355,000 Active 43 DOM
-
2026-06-08pricedays on market $355,000 Active 42 DOM
-
2026-06-07days on market $365,000 Active 41 DOM
-
2026-06-03days on market $365,000 Active 37 DOM
-
2026-06-02days on market $365,000 Active 36 DOM
-
2026-06-01days on market $365,000 Active 35 DOM
-
2026-05-31days on market $365,000 Active 34 DOM
-
2026-05-19price $365,000
-
2026-04-26$370,000 Active
-
2023-09-26soldstatus $21,500
-
2004-07-19soldstatus $14,900
-
2003-09-08soldstatus $15,000
ⓘ Source: listings_history table (triggers on properties + properties_extension) + one-shot
backfill from property_details.listing_events for pre-trigger history.
Tax reassessment forecast FL · Resets to sale price
- Current annual tax
- $3,287 · $274/mo
- Projected year-2 tax
- $3,287 · $274/mo
- Expected delta
- $0/yr ($0/mo · 0.0%)
ⓘ Screening estimate from a state-policy table — verify with the county assessor before closing.
Climate risk First Street
- Flood 1/10 Low FEMA zone X (unshaded) · 0% chance over 30 yrs
- Wildfire 1/10 Low
- Heat 10/10 Extreme 7 d/yr ≥107°F today · 27 d/yr by 30 yrs out
- Wind 10/10 Extreme 99% chance of damaging wind over 30 yrs
- Air quality 2/10 Low 1 unhealthy d/yr today · 1 by 30 yrs out
Nearby sold comps map
Loading sold comps map…
Walkable amenities ~0.75 mi
Loading nearby amenities…
Taxation est. · year 1
- Rental income
- $27,449
- − Mortgage interest
- −$19,886
- − Property taxes
- −$3,287
- − Insurance
- −$1,775
- − Repairs & maintenance
- −$2,196
- − Management
- −$2,196
- − Depreciation
- −$10,327
- Taxable loss
- −$12,218
- Est. tax savings @ 24.0%
- +$2,932
- After-tax cash flow
- $-2,785/yr
For passive investors: Depreciation is non-cash, so a rental often shows a tax loss while cash-flowing — sheltering income. Rental losses are passive: they offset passive income freely, and up to $25,000/yr can offset ordinary (W-2) income if you actively participate and your MAGI is under $100k (phasing out to $0 by $150k); unused losses carry forward. On sale, claimed depreciation is recaptured at up to 25%, and gains may owe capital-gains tax (a 1031 exchange can defer both). Figures are a year-1 estimate at your 24.0% rate — not tax advice; consult a CPA.
Schools (NCES district)
- District
- Lee
- NCES district ID
- 1201080
- Math proficiency
- 47% ▼ -11.00%
- Reading proficiency
- 50% ▼ -4.00%
- Median HH income
- $49,518
- Composite
- 41.49/100
- National rank
- #3458
- State rank
- #42 of 73 in FL
Livability — Lehigh Acres
- Score
- 59/100
- State rank
- #826
- US rank
- #20055
Category grades
Schools grade is shown separately in the Schools card above.
Census & demographics
- Census place
- Lehigh Acres, FL
- County
- Lee County · 788,662 people
- City population
- 130,638
- Metro
- Cape Coral-Fort Myers, FL
- Population (ZIP)
- 20,277
- Household income
- $72,679
- Rent vs Own
- Severe rent burden
- 574.0
Population outlook (Lee County) Hauer SSP2
- Today (2025)
- 871,946 people
- By 2030
- 955,468 · +9.6%
- By 2040
- 1,113,587 · +27.7%
- By 2050
- 1,256,891 · +44.1%
- By 2075
- 1,560,270 · +78.9%
- By 2100
- 1,726,848 · +98.0%
Race, ethnicity, and origin ACS 2023
- Neighborhood character
- Diverse neighborhood (Simpson 0.65)
- Race & ethnicity
- Hispanic / Latino 50% Two or more races 30% White 24% Black 20% Asian 3%
- Hispanic origin (detail)
- Mexican 8% Puerto Rican 8% Cuban 18% Dominican 4%
- Common ancestry
- Hispanic 8% Slovak 1% Lithuanian 1%
- Foreign-born
- 35% · Canada, Jamaica, Vietnam
- Languages at home
- 46% English-only · Spanish 43% French/Haitian/Cajun 8% Vietnamese 1%
Political lean MEDSL · Lee
- 2024 margin
- Strong R (+28.4) · D 35.5% · R 63.9%
- 2008→2024 swing
- -18.0pp toward R · 2008: -10.4pp · 2024: -28.4pp
- All cycles
- 2024: R+28.4 2020: R+19.2 2016: R+20.4 2012: R+16.6 2008: R+10.4
Not yet ingested
- Civics
- —
Market trends
- HPI YoY
- ▲ 21.77%
- Current HPI
- 340.4255
- Rent YoY
- ▼ -1.54%
- Metro
- Cape Coral-Fort Myers, FL
- State GDP YoY
- ▲ 3.28%
- F500 in state
- 36
Industry mix (Fortune 500 HQ in FL)
| Industry | F500 HQs | Revenue |
|---|---|---|
| Industrial Technology | 2 | $29B |
|
||
| Insurance | 2 | $17B |
|
||
| Retail | 1 | $60B |
|
||
| Technology Distribution | 1 | $58B |
|
||
| Homebuilding | 1 | $35B |
|
||
| Technology Manufacturing | 1 | $35B |
|
||
Price history
+2333.3% since first listed5 events — show timeline
- 2026-05-19 Price Changed $365,000 FORTMLS
- 2026-04-26 Listed $370,000 FORTMLS
- 2023-09-26 Sold (Public Records) $21,500 Public Records
- 2004-07-19 Sold (Public Records) $14,900 Public Records
- 2003-09-08 Sold (Public Records) $15,000 Public Records
Property tax history
+41.9%/yrLatest (2025): $3,287 · +601.9% YoY. Source: county tax records.
Cash-flow waterfall
monthlySold comps — $/sqft
last 12 mo · ≤1 miLoading sold comps…