 Multi-family
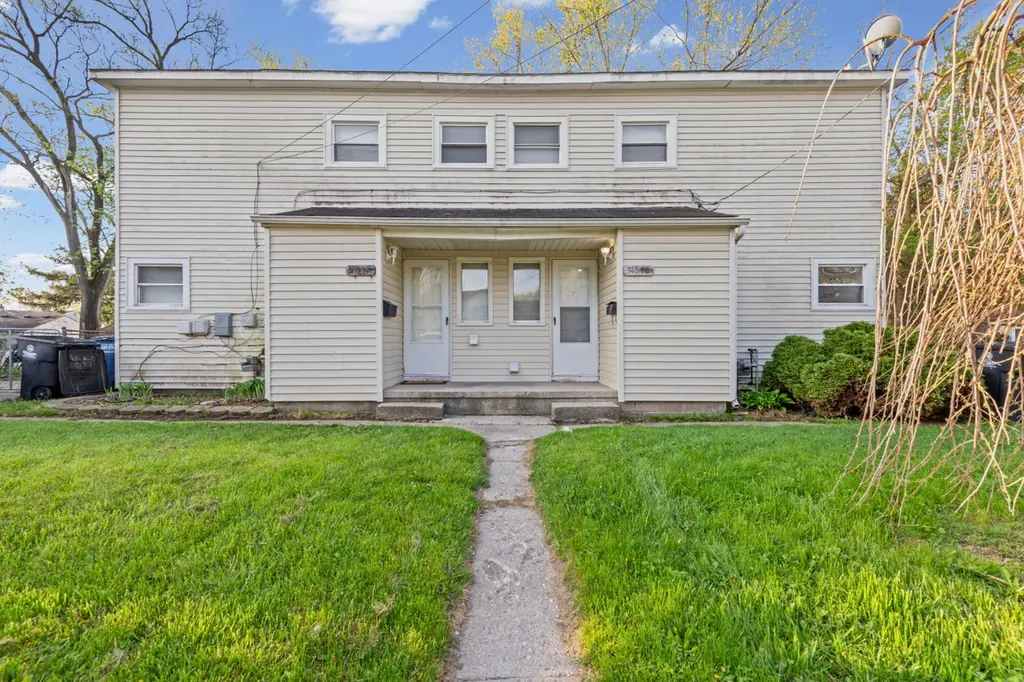
31546 Alpena Ct · Westland, MI
Flood risk 1/10 · Minimal
- FEMA flood zone
- X (unshaded)
- Chance of flooding over 30 yrs
- 0.0%
- Est. flood insurance / yr
- $507 – $1,088
Fire risk 1/10 · Minimal
- Est. fire insurance / yr
- $784 – $1,456
Heat risk 3/10 · Minor
- Hot days now (above 97°F)
- 7 days/yr
- Hot days in 30 yrs
- 14 days/yr
Wind risk 2/10 · Minimal
- Chance of severe wind over 30 yrs
- —
Air-quality risk 2/10 · Minimal
- Unhealthy air days now
- 1 days/yr
- Unhealthy air days in 30 yrs
- 3 days/yr
Risk factors via First Street. Map © Google.
Why this score? — see what drove the D+ grade
The composite is a weighted blend of 9 inputs, each scored 0–100. Each bar is that input's sub-score; the figure is the points it added to the 100-point composite (weight × sub-score).
- Cash flow +22.5/30.0
- DSCR +7.2/10.0
- 1% rule +5.8/10.0
- Livability +3.9/5.0
- Rent growth +3.3/5.0
- Condition / age +2.5/5.0
- Schools +1.6/10.0
- ARV discount +0.0/15.0
- Appreciation +0.0/10.0
$225,000
🖨 Deal sheet 📄 Offer letter ✓ Due diligence
Multi-family units
County records classify this as Multi-Family (2-4 Unit). Listing-text estimate: 1 unit. estimate disagrees with records
Listing remarks MLS
Sold off market, input for comps
Key facts
- 6,534 sq ft lot
- 2 parking spots
- Built 1942
Property features AI
Finance
- Other: Listing broker: Preferred, Realtors Ltd; Listing agent: Keith Jourdan
Exterior
- Parking: 2 parking spaces
- Utilities: Public water; Public sewer; Electricity connected; Natural gas connected
- Home design: Multi-family residential income property; Vinyl siding
- Construction: Vinyl siding construction
- Exterior features: Lot approximately 6,534 sq ft (0.15 acres); Located near Merriman and Palmer; cross streets Dorsey Rd & S Merriman Rd
Interior
- Bedrooms: Two 2-bedroom units (one vacant, one tenant-occupied)
- Bathrooms: Each unit has 1 bathroom
- Heating & cooling: Forced-air heating; Natural gas heating
- Interior features: Crawl space basement
Neighborhood map
What this means for you Summary
Snapshot
- This is a 4-bed/2.0-bath multifamily listed at $225k.
Deal economics
- At list price, monthly cash flow is $379 ($5k/yr) — positive.
- The deal already cash-flows at list — no discount required.
- Meets the 1% rule at list price ($2k rent vs $225k).
- Recommended offer: $218k (3.0% below list) — sets the bar for market timing.
- Cap rate 8.3% vs local median 4.5% in Westland — top-decile yield for the area; either an underpriced asset or a hidden risk that comps aren't pricing in. Stress-test before assuming the spread holds.
Location & tenants
- Location reads 77/100 on livability (#124 in MI, #3,067 nationally) — a middle-class / working-renter tenant base. Strengths: commute A+, cost of living A+, housing A+; Watch: amenities C-, employment C-, crime D+.
- Wayne-Westland Community School District (suburban): math 11% / reading 27% proficiency, ranked #474 of 540 in MI (top 88%) — low school quality limits family demand, transient renter base, plan for 1-2y turnover.
- Market conditions: Rents rising (+3.3%/yr); 146 active listings in the ZIP; 6 comparable units currently listed for rent nearby; rentals at typical pace (median 18d on market — plan ~3-4 weeks tenant-placement turnaround); 2,639 units permitted in Wayne County in 2024 (1,216 in 5+ unit buildings).
- This rent runs 45% of the median local income ($65k/yr) — at the standard rent-burdened threshold; future hikes will face affordability resistance.
Forward outlook
- Local home prices are declining (-3.0%/yr); year-one equity from $2k of loan paydown is wiped out by about $7k of value loss. Plan a longer hold.
- Wayne County population projected at -17% by 2050 — secular population decline; favor cash flow + early exit over multi-decade hold.
Negotiation context
- It's been on market 35 days — a 3% lower offer ($218k) is reasonable based on typical stale-listing flexibility.
- 13 sale attempts since 9y ago; this cycle's ask is 20355% above the opening price — seller raised mid-cycle; expect resistance to lowballs.
- Current owner paid $147k; list at $225k implies a 53% gain — meaningful room to come down on a strong offer.
Risks & watch-outs
- Watch-outs: built in 1942 — expect roof / HVAC / electrical / plumbing capex.
Questions for the listing agent
- It's been on market 35 days. Have you received any prior offers? Is the seller open to a 3% concession, seller financing, or rate buy-down credit?
- Built in 1942 — when were the roof, HVAC, electrical panel, plumbing, and water heater last replaced?
- Is there a deadline driving the sale (1031 exchange, divorce, estate, relocation)? That informs how much negotiation room exists.
- Schools are D-rated, which usually means shorter tenancies and higher turnover. Who's the typical renter profile here, and what's been the actual vacancy rate?
- Crime grade is D in this area — have there been break-ins, vandalism, or insurance claims at this property in the last 3 years? What carrier currently insures it and at what premium?
- The area grade is low — what's the realistic commute time and amenity access for the typical tenant pool here? Any planned neighborhood developments (good or bad) we should know about?
- What's the average days-on-market for RENTAL listings here right now (not sales)? A rising rental-DOM trend means longer vacancies and softer asking-rent achievability than the comps imply.
- What's the recent tenant-quality profile in this submarket — average credit score on applications, eviction rate, late-payment / NSF rate, and stable-employment percentage? A property-management company in the area should have these aggregated.
- How much new apartment / multifamily construction is in the pipeline within 1–3 miles? Heavy new supply (>2% of stock underway) typically softens rents 12–24 months out; light construction supports rent growth.
Investment metrics
- 1% rule
- 1.08% ✓
- Cap rate
- 8.32%
- Cash-on-cash
- 7.22%
- DSCR
- 1.32
- GRM
- 7.7
CMA / ARV
- ARV (median comp)
- $159,327
- List price
- $225,000
- Delta
- 41.22%
- Verdict
- OVERPRICED
- Comps
- 20 within 1.0 mi
Show comp detail 5 sales within ~0.75 mi
| Address | Dist | Beds/Ba | Sqft | Sold | Price | $/sf | Match |
|---|---|---|---|---|---|---|---|
| 31563 Alpena Ct | 0.06mi | 4/2.0 | 1,728 (0%) | 12mo | $80,000 | $46 | 87 |
| 31607-31609 Antrim | 0.13mi | 4/2.5 | 1,728 (0%) | 22mo | $170,000 | $98 | 74 |
| 31954-31956 Charlevoix | 0.28mi | 4/2.0 | 1,787 (+3%) | 19mo | $169,000 | $95 | 65 |
| 33116-33118 Alberta St | 0.70mi | 4/2.0 | 1,812 (+5%) | 12mo | $170,000 | $94 | 49 |
| 33117 Alberta St | 0.72mi | 4/2.0 | 1,812 (+5%) | 14mo | $152,000 | $84 | 47 |
Match score weights: distance 35% · size 25% · config 20% · recency 20%. Top-matched comps best support the ARV.
Projected returns pro-forma
-3.0% appreciation · 3.28% rent growth · sell at horizon
- IRR
- -4.9%
- Equity multiple
- 0.82×
- Total profit
- $-11,590
- Equity at exit
- $33,548
- IRR
- 5.1%
- Equity multiple
- 1.38×
- Total profit
- $23,951
- Equity at exit
- $19,454
Cash invested: $63,000 (down + closing). Projections, not guarantees.
Landlord ↔ Tenant lean methodology
- Overall (STATE)
- 62 Landlord-Friendly
- State Michigan
- 62 Landlord-Friendly · EVEN
- County
- — inherits STATE
- City
- — inherits STATE
ZIP-level market 48186
- Rents YoY
- 3.3%
- Active inventory
- 146
- Price-to-rent
- 15.5×
Monthly cashflow live
- Estimated rent
- $2,427 high interval (Pro) →
- Mortgage (P&I)
- −$1,180
- Tax from tax record
- −$264 /mo · $3,172/yr
- Insurance
- −$94
- HOA
- −$0
- Vacancy / Maint / Mgmt
- −$510
- Net cashflow
- $379
Break-even live
2-unit breakdown (identical units grouped — click to expand)
| Units | Beds | Baths | Est. rent |
|---|---|---|---|
| 2× units | 2 | 1 | $2,428 |
| #1 | 2 | 1 | $1,214 |
| #2 | 2 | 1 | $1,214 |
| Total (2 units) | $2,427 | ||
UW: 25.0% down · 7.5% · 30yr · 1.5% tax · 5.0% vac · 8.0% maint · 8.0% mgmt
Financing live
Cash to close
- Down payment
- $56,250
- Closing costs
- $6,750
- Reserves months
- —
- Total cash needed
- —
Loan-product check · same deal, 3 products live
Conventional
25% down · 7.5% · 30yr
- Down + closing
- —
- Monthly P&I
- —
- Monthly cashflow
- —
- DSCR
- —
- Eligible?
- —
Personal DTI + credit; lowest rate.
DSCR
20% down · 8.5% · 30yr
- Down + closing
- —
- Monthly P&I
- —
- Monthly cashflow
- —
- DSCR
- —
- Eligible?
- —
No personal income docs; deal must DSCR.
Hard money
10% down · 12.0% · 12mo
- Down + closing
- —
- Monthly P&I
- —
- Monthly cashflow
- —
- DSCR
- —
- Eligible?
- —
Short-term bridge; refi at stabilization.
Rent comps 6 comps
| Address | Beds | Baths | Sqft | Rent | $/sqft | DOM | Units | Dist |
|---|---|---|---|---|---|---|---|---|
| 33240 Parkwood St Westland, MI | 3.0 | 1.0 | 1481 | $1,750 | $1.18 | 15d | 1 | 1.03mi |
| 2310 Deerfield Ct Westland, MI | 3.0 | 1.5 | 1100 | $1,125 | $1.02 | 43d | 1 | 1.24mi |
| 2264 Delton Ct Westland, MI | 3.0 | 1.5 | 1076 | $1,300 | $1.21 | 15d | 1 | 1.24mi |
| 30520 Hiveley St Westland, MI | 3.0 | 1.0 | 1105 | $1,700 | $1.54 | 22d | 1 | 1.27mi |
| 2040 Dryden St Westland, MI | 3.0 | 1.0 | 1100 | $1,150 | $1.05 | 18d | 1 | 1.28mi |
| 31217 Cherry Hill Rd Westland, MI | 3.0 | 1.0 | 1100 | $1,800 | $1.64 | 4d | 1 | 1.37mi |
Listing history 40 events
-
2026-06-01days on market $225,000 Active 35 DOM
-
2026-05-31days on market $225,000 Active 34 DOM
-
2026-04-27$225,000 Active 49-char remark
-
2026-04-27$225,000 Active 49-char remark
-
2025-07-02status Pending
Show marketing remark (32 chars)
Sold off market, input for comps
-
2025-05-09soldstatus $147,000
-
2025-04-03soldstatus $147,000 Closed
Show marketing remark (32 chars)
Sold off market, input for comps
-
2025-04-03soldstatus $147,000 Closed
Show marketing remark (32 chars)
Sold off market, input for comps
-
2025-01-29$145,000 Active
Show marketing remark (32 chars)
Sold off market, input for comps
-
2025-01-29$145,000 Active
Show marketing remark (32 chars)
Sold off market, input for comps
-
2024-09-30historical $950
-
2024-09-26$950
-
2024-09-11historical $950
-
2024-08-14price $950
-
2024-05-11price $1,000
-
2024-05-07$1,100
-
2022-01-28soldstatus $95,000
-
2022-01-21soldstatus $95,000 Sold
-
2022-01-21soldstatus $95,000 Closed
-
2021-12-31status Pending
-
2021-12-17historical
-
2021-12-16status Pending
-
2021-12-09price $115,000
-
2021-12-08price $115,000
-
2021-11-10$124,900 Active
-
2021-11-10$124,900 Active
-
2021-11-10historical $124,900
-
2021-11-09historical $124,900
-
2017-06-21soldstatus $46,000
-
2017-06-07soldstatus $46,000 Sold
-
2017-06-07soldstatus $46,000 Closed
-
2017-04-12status Pending
-
2017-04-12status Pending
-
2017-03-28status Active
-
2017-03-28status Active
-
2017-03-15status Pending
-
2017-03-15status Pending
-
2017-03-09$46,900 Active
-
2017-03-09$46,900 Active
-
2003-12-24soldstatus $86,500
ⓘ Source: listings_history table (triggers on properties + properties_extension) + one-shot
backfill from property_details.listing_events for pre-trigger history.
Tax reassessment forecast MI · Partial reset (capped growth)
- Current annual tax
- $3,172 · $264/mo
- Projected year-2 tax
- $3,319 · $277/mo
- Expected delta
- +$146/yr (+$12/mo · 4.6%)
ⓘ Screening estimate from a state-policy table — verify with the county assessor before closing.
Climate risk First Street
- Flood 1/10 Low FEMA zone X (unshaded) · 0% chance over 30 yrs
- Wildfire 1/10 Low
- Heat 3/10 Moderate 7 d/yr ≥97°F today · 14 d/yr by 30 yrs out
- Wind 2/10 Low
- Air quality 2/10 Low 1 unhealthy d/yr today · 3 by 30 yrs out
Nearby sold comps map
Loading sold comps map…
Walkable amenities ~0.75 mi
Loading nearby amenities…
Taxation est. · year 1
- Rental income
- $29,124
- − Mortgage interest
- −$12,603
- − Property taxes
- −$3,172
- − Insurance
- −$1,125
- − Repairs & maintenance
- −$2,330
- − Management
- −$2,330
- − Depreciation
- −$6,545
- Taxable income
- $1,018
- Est. tax owed @ 24.0%
- −$244
- After-tax cash flow
- $4,307/yr
For passive investors: Depreciation is non-cash, so a rental often shows a tax loss while cash-flowing — sheltering income. Rental losses are passive: they offset passive income freely, and up to $25,000/yr can offset ordinary (W-2) income if you actively participate and your MAGI is under $100k (phasing out to $0 by $150k); unused losses carry forward. On sale, claimed depreciation is recaptured at up to 25%, and gains may owe capital-gains tax (a 1031 exchange can defer both). Figures are a year-1 estimate at your 24.0% rate — not tax advice; consult a CPA.
Schools (NCES district)
- District
- Wayne-Westland Community School District
- NCES district ID
- 2600015
- Math proficiency
- 11% ▼ -6.00%
- Reading proficiency
- 27% ▼ -2.00%
- Median HH income
- $43,524
- Composite
- 16.4/100
- National rank
- #9195
- State rank
- #474 of 540 in MI
Livability — Westland
- Score
- 77/100
- State rank
- #124
- US rank
- #3067
Category grades
Schools grade is shown separately in the Schools card above.
Census & demographics
- Census place
- Westland, MI
- County
- Wayne County · 1,562,939 people
- City population
- 83,633
- Metro
- Detroit-Warren-Dearborn, MI
- Population (ZIP)
- 35,103
- Household income
- $65,187
- Rent vs Own
- Severe rent burden
- 980.0
Population outlook (Wayne County) Hauer SSP2
- Today (2025)
- 1,675,273 people
- By 2030
- 1,620,300 · -3.3%
- By 2040
- 1,502,341 · -10.3%
- By 2050
- 1,384,039 · -17.4%
- By 2075
- 1,124,592 · -32.9%
- By 2100
- 881,193 · -47.4%
Race, ethnicity, and origin ACS 2023
- Neighborhood character
- Diverse neighborhood (Simpson 0.57)
- Race & ethnicity
- White 61% Black 23% Two or more races 10% Hispanic / Latino 6% Asian 2%
- Hispanic origin (detail)
- Mexican 4%
- Common ancestry
- Romanian 8% Italian 3% Lithuanian 3%
- Foreign-born
- 7% · Canada, China
- Languages at home
- 88% English-only · Spanish 4% Other Indo-European 2% Arabic 1%
Political lean MEDSL · Wayne
- 2024 margin
- Strong D (+29.0) · D 62.7% · R 33.7% · Other 3.6%
- 2008→2024 swing
- -20.5pp toward R · 2008: 49.5pp · 2024: 29.0pp
- All cycles
- 2024: D+29.0 2020: D+38.1 2016: D+37.3 2012: D+46.9 2008: D+49.5
Not yet ingested
- Civics
- —
Market trends
- HPI YoY
- ▼ -262.09%
- Current HPI
- 237.6325
- Rent YoY
- ▲ 3.28%
- Metro
- Detroit-Warren-Dearborn, MI
- State GDP YoY
- ▲ 1.37%
- F500 in state
- 28
Industry mix (Fortune 500 HQ in MI)
| Industry | F500 HQs | Revenue |
|---|---|---|
| Automotive Parts | 3 | $48B |
|
||
| Automotive | 2 | $372B |
|
||
| Chemicals | 1 | $45B |
|
||
| Automotive Retail | 1 | $29B |
|
||
| Healthcare / Medical Devices | 1 | $23B |
|
||
| Automotive Technology | 1 | $20B |
|
||
Price history
-98.7% since first listed42 events — show timeline
- 2026-06-02 Rental Removed $1,100 REALCOMP
- 2026-06-01 Listing Removed — MiRealSource-MiMLS
- 2026-06-01 Listing Removed — REALCOMP
- 2026-05-28 Listed for Rent $1,100 REALCOMP
- 2026-04-27 Listed $225,000 REALCOMP
- 2026-04-27 Listed $225,000 MiRealSource-MiMLS
- 2025-07-02 Pending — REALCOMP
- 2025-05-09 Sold (Public Records) $147,000 Public Records
- 2025-04-03 Sold (MLS) $147,000 MiRealSource-MiMLS
- 2025-04-03 Sold (MLS) $147,000 REALCOMP
- 2025-01-29 Listed $145,000 MiRealSource-MiMLS
- 2025-01-29 Listed $145,000 REALCOMP
- 2024-09-30 Rental Removed $950 REALSOURCE
- 2024-09-26 Listed for Rent $950 REALSOURCE
- 2024-09-11 Rental Removed $950 REALSOURCE
- 2024-08-14 Price Changed $950 REALSOURCE
- 2024-05-11 Price Changed $1,000 REALSOURCE
- 2024-05-07 Listed for Rent $1,100 REALSOURCE
- 2022-01-28 Sold (Public Records) $95,000 Public Records
- 2022-01-21 Sold (MLS) $95,000 MiRealSource-MiMLS
- 2022-01-21 Sold (MLS) $95,000 REALCOMP
- 2021-12-31 Pending — MiRealSource-MiMLS
- 2021-12-17 Listing Removed — MiRealSource-MiMLS
- 2021-12-16 Pending — REALCOMP
- 2021-12-09 Price Changed $115,000 MiRealSource-MiMLS
- 2021-12-08 Price Changed $115,000 REALCOMP
- 2021-11-10 Listed $124,900 MiRealSource-MiMLS
- 2021-11-10 Listed $124,900 REALCOMP
- 2021-11-10 Coming Soon $124,900 MiRealSource-MiMLS
- 2021-11-09 Coming Soon $124,900 REALCOMP
- 2017-06-21 Sold (Public Records) $46,000 Public Records
- 2017-06-07 Sold (MLS) $46,000 MiRealSource-MiMLS
- 2017-06-07 Sold (MLS) $46,000 REALCOMP
- 2017-04-12 Pending — MiRealSource-MiMLS
- 2017-04-12 Pending — REALCOMP
- 2017-03-28 Relisted — MiRealSource-MiMLS
- 2017-03-28 Relisted — REALCOMP
- 2017-03-15 Pending — MiRealSource-MiMLS
- 2017-03-15 Pending — REALCOMP
- 2017-03-09 Listed $46,900 MiRealSource-MiMLS
- 2017-03-09 Listed $46,900 REALCOMP
- 2003-12-24 Sold (Public Records) $86,500 Public Records
Property tax history
+10.8%/yrLatest (2025): $3,172 · +6.1% YoY. Source: county tax records.
Cash-flow waterfall
monthlySold comps — $/sqft
last 12 mo · ≤1 miLoading sold comps…