 Fourplex
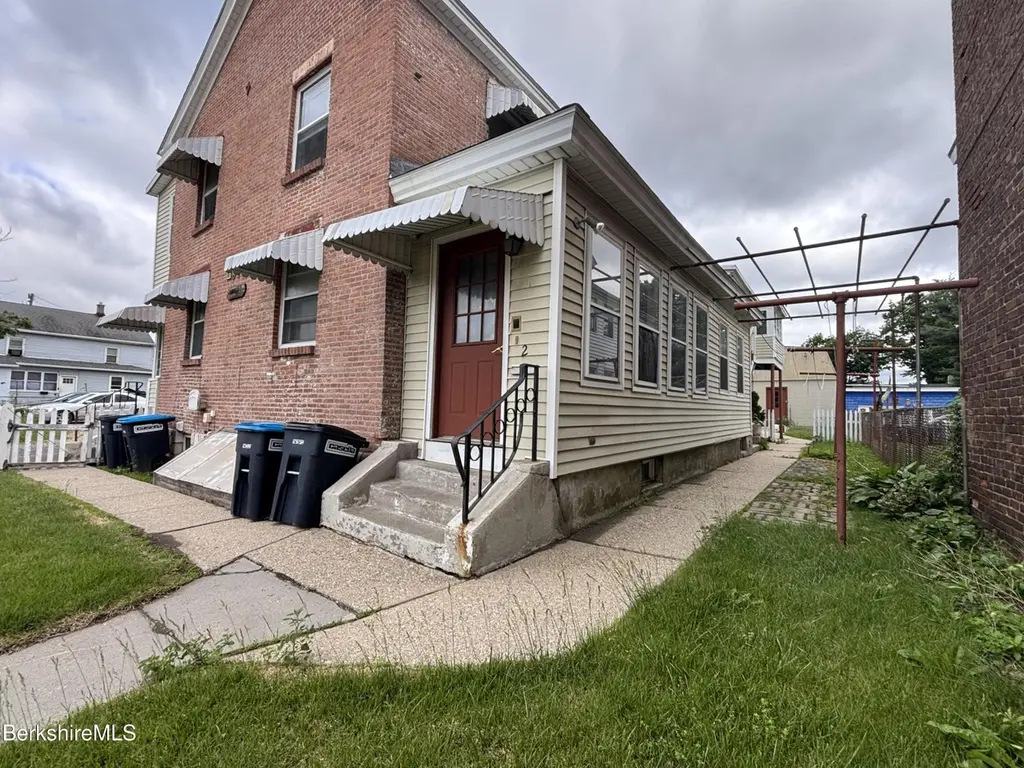
319 Fenn St · Pittsfield, MA
Flood risk 1/10 · Minimal
- FEMA flood zone
- X
- Chance of flooding over 30 yrs
- 0.0%
- Est. flood insurance / yr
- $473 – $860
Fire risk 1/10 · Minimal
- Est. fire insurance / yr
- $915 – $1,699
Heat risk 3/10 · Minor
- Hot days now (above 92°F)
- 7 days/yr
- Hot days in 30 yrs
- 17 days/yr
Wind risk 4/10 · Minor
- Chance of severe wind over 30 yrs
- 9.0%
Air-quality risk 2/10 · Minimal
- Unhealthy air days now
- 1 days/yr
- Unhealthy air days in 30 yrs
- 1 days/yr
Risk factors via First Street. Map © Google.
Why this score? — see what drove the B grade
The composite is a weighted blend of 9 inputs, each scored 0–100. Each bar is that input's sub-score; the figure is the points it added to the 100-point composite (weight × sub-score).
- Cash flow +30.0/30.0
- 1% rule +10.0/10.0
- DSCR +10.0/10.0
- ARV discount +7.5/15.0
- Rent growth +4.4/5.0
- Livability +3.8/5.0
- Condition / age +2.5/5.0
- Schools +2.3/10.0
- Appreciation +0.0/10.0
$445,000
🖨 Deal sheet 📄 Offer letter ✓ Due diligence
Multi-family units
County records classify this as Multi-Family (5+ Unit). Listing-text estimate: 4 units. estimate disagrees with records
5+ unit building — per-unit beds/baths from public records are typically unavailable; the breakdown below (if shown) is an estimate from the listing text.
Listing remarks MLS
A beautifully updated and maintained 4 family home centrally located in the heart of Pittsfield. This home is a good fit for an owner occupied or investor buyer. The home offers 2 generously sized apartments with 2 bedrooms and 2 apartments with 1 bedroom each. All separate utilities with all new natural gas heating systems throughout. Some of the updates include a new roof (2022), new energy efficient Viessmann natural gas heating systems (2023), vinyl replacement windows and vinyl siding amongst many others. An oversized 2 car garage, off street parking nicely round out this multifamily home that is close to all that downtown Pittsfield has to offer. Current owner would like to stay as a life tenant at the home.
Key facts
- Separate utilities
- New roof
- 6,970 sq ft lot
Tags
Property features AI
Finance
- Financial info: Monthly unit rent example: $1,550 for a 2-bed, 1-bath unit
Exterior
- Parking: 2-car garage
- Utilities: Public sewer
- Home design: Single building (multifamily layout implied by unit information)
- Construction: Asphalt roof; Total building area approximately 3087
- Exterior features: Public sewer
Interior
- Bedrooms: One unit with 2 bedrooms
- Flooring: Carpet; Linoleum; Wood
- Bathrooms: Four full bathrooms; No half bathrooms
- Heating & cooling: Natural gas heating
- Interior features: Carpet, linoleum, and wood flooring
Neighborhood map
What this means for you Summary
Snapshot
- This is a 4 × 6-bed/4.0-bath units multifamily listed at $445k.
Deal economics
- At list price, monthly cash flow is $4k ($53k/yr) — positive. Per door: $1k/mo.
- The deal already cash-flows at list — no discount required.
- Meets the 1% rule at list price ($9k rent vs $445k).
- Cap rate 18.2% vs local median 3.6% in Pittsfield — top-decile yield for the area; either an underpriced asset or a hidden risk that comps aren't pricing in. Stress-test before assuming the spread holds.
Location & tenants
- Location reads 75/100 on livability (#70 in MA, #3,820 nationally) — a middle-class / working-renter tenant base. Strengths: commute A+, housing A+, health & safety A+; Watch: employment C-, amenities D+, crime D.
- Pittsfield (urban): math 19% / reading 34% proficiency, ranked #272 of 302 in MA (top 90%) — low school quality limits family demand, transient renter base, plan for 1-2y turnover.
- Zoned schools: Morningside Community School (math 8% / reading 22%, grade F, #854 of 938 statewide, top 93%, 355 students, 0% FRL) — zoned schools average 0% FRL vs 50% district-wide (50 pts lower); this property's tenant base skews higher-income than the district average.
- Market conditions: Rents rising fast (+7.7%/yr); 275 active listings in the ZIP; 130 units permitted in Berkshire County in 2024 (10 in 5+ unit buildings).
- At $9,103/mo this rent would consume 154% of the median local household income ($71k/yr) (locally 1580% of renters already pay >50% of income on rent) — very limited rent-growth headroom before tenants either downsize or default.
Forward outlook
- Local home prices are declining (-3.0%/yr); year-one equity from $3k of loan paydown is wiped out by about $13k of value loss. Plan a longer hold.
- Berkshire County population projected at -24% by 2050 — secular population decline; favor cash flow + early exit over multi-decade hold.
- At projected returns (-3.0% appreciation + 7.7% rent growth), your $125k cash investment doubles in ~3 years — after that, you're playing with house money.
Negotiation context
- Only 1 days on market — expect competitive offers; lowballing is unlikely to land.
- 2 sale attempts since 2y ago with the ask held roughly flat each time — persistent listings suggest the price (not the market) is what's stuck; bring a comps-based counter.
- Current owner paid $340k; 31% above their basis — modest negotiation headroom, anchor on the comps not their cost.
Risks & watch-outs
- Watch-outs: built in 1860 — expect roof / HVAC / electrical / plumbing capex.
Questions for the listing agent
- Can we see the unit-by-unit rent roll, current vacancy, and any below-market leases? What's the average tenancy length?
- What capital expenditures (roof, boiler, parking lot, exteriors) have been made in the last 5 years, and what's planned in the next 2?
- Built in 1860 — when were the roof, HVAC, electrical panel, plumbing, and water heater last replaced?
- Is there a deadline driving the sale (1031 exchange, divorce, estate, relocation)? That informs how much negotiation room exists.
- Schools are D-rated, which usually means shorter tenancies and higher turnover. Who's the typical renter profile here, and what's been the actual vacancy rate?
- Crime grade is D in this area — have there been break-ins, vandalism, or insurance claims at this property in the last 3 years? What carrier currently insures it and at what premium?
- What's the average days-on-market for RENTAL listings here right now (not sales)? A rising rental-DOM trend means longer vacancies and softer asking-rent achievability than the comps imply.
- What's the recent tenant-quality profile in this submarket — average credit score on applications, eviction rate, late-payment / NSF rate, and stable-employment percentage? A property-management company in the area should have these aggregated.
- How much new apartment / multifamily construction is in the pipeline within 1–3 miles? Heavy new supply (>2% of stock underway) typically softens rents 12–24 months out; light construction supports rent growth.
Investment metrics
- 1% rule
- 2.05% ✓
- Cap rate
- 18.19%
- Cash-on-cash
- 42.49%
- DSCR
- 2.89
- GRM
- 4.1
CMA / ARV
- ARV (on-the-fly)
- $274,743
- Comps found
- 12
Show comp detail 12 sales within ~0.75 mi
| Address | Dist | Beds/Ba | Sqft | Sold | Price | $/sf | Match |
|---|---|---|---|---|---|---|---|
| 1 Rostone Pl | 0.08mi | 7/3.0 (+1) | 3,180 (+3%) | 6mo | $380,000 | $119 | 77 |
| 10 Cherry St | 0.35mi | 6/4.0 | 3,320 (+8%) | 2mo | $295,000 | $89 | 70 |
| 36-38 Chickering St | 0.45mi | 6/2.5 | 3,200 (+4%) | 6mo | $365,000 | $114 | 62 |
| 474 Tyler St | 0.63mi | 5/4.0 (-1) | 3,276 (+6%) | 1mo | $345,000 | $105 | 55 |
| 76-78 Stoddard Ave | 0.67mi | 7/3.0 (+1) | 3,120 (+1%) | 4mo | $275,000 | $88 | 55 |
| 41-43 Reed St | 0.62mi | 5/5.0 (-1) | 2,976 (-4%) | 2mo | $325,000 | $109 | 54 |
| 27-29 Daniels Ave | 0.63mi | 6/2.5 | 3,216 (+4%) | 8mo | $145,000 | $45 | 51 |
| 10-12 Stoddard Ave | 0.69mi | 6/2.5 | 2,840 (-8%) | 6mo | $152,000 | $54 | 44 |
| 52-54 Brown St | 0.61mi | 6/3.0 | 2,736 (-11%) | 8mo | $321,000 | $117 | 42 |
| 61 Seymour St | 0.65mi | 6/2.0 | 2,736 (-11%) | 4mo | $210,000 | $77 | 39 |
| 29 Glenwood Ave | 0.69mi | 6/2.0 | 2,736 (-11%) | 3mo | $242,340 | $89 | 38 |
| 71 Center St | 0.57mi | 6/8.0 | 2,709 (-12%) | 1mo | $80,000 | $30 | 36 |
Match score weights: distance 35% · size 25% · config 20% · recency 20%. Top-matched comps best support the ARV.
Projected returns pro-forma
-3.0% appreciation · 7.72% rent growth · sell at horizon
- IRR
- 44.3%
- Equity multiple
- 3.04×
- Total profit
- $254,158
- Equity at exit
- $66,351
- IRR
- 52.3%
- Equity multiple
- 7.32×
- Total profit
- $787,907
- Equity at exit
- $38,475
Cash invested: $124,600 (down + closing). Projections, not guarantees.
Landlord ↔ Tenant lean methodology
- Overall (STATE)
- 20 Strongly Tenant-Friendly
- State Massachusetts
- 20 Strongly Tenant-Friendly · D+15
- County
- — inherits STATE
- City
- — inherits STATE
ZIP-level market 01201
- Rents YoY
- 7.7%
- Active inventory
- 275
- Price-to-rent
- 16.3×
Monthly cashflow live
- Estimated rent
- $9,103 medium interval (Pro) →
- Mortgage (P&I)
- −$2,334
- Tax from tax record
- −$260 /mo · $3,120/yr
- Insurance
- −$185
- HOA
- −$0
- Vacancy / Maint / Mgmt
- −$1,912
- Net cashflow
- $4,412
Break-even live
4-unit breakdown (identical units grouped — click to expand)
| Units | Beds | Baths | Est. rent |
|---|---|---|---|
| 4× units | 6 | 4 | $9,104 |
| #1 | 6 | 4 | $2,276 |
| #2 | 6 | 4 | $2,276 |
| #3 | 6 | 4 | $2,276 |
| #4 | 6 | 4 | $2,276 |
| Total (4 units) | $9,103 | ||
UW: 25.0% down · 7.5% · 30yr · 1.5% tax · 5.0% vac · 8.0% maint · 8.0% mgmt
Financing live
Cash to close
- Down payment
- $111,250
- Closing costs
- $13,350
- Reserves months
- —
- Total cash needed
- —
Loan-product check · same deal, 3 products live
Conventional
25% down · 7.5% · 30yr
- Down + closing
- —
- Monthly P&I
- —
- Monthly cashflow
- —
- DSCR
- —
- Eligible?
- —
Personal DTI + credit; lowest rate.
DSCR
20% down · 8.5% · 30yr
- Down + closing
- —
- Monthly P&I
- —
- Monthly cashflow
- —
- DSCR
- —
- Eligible?
- —
No personal income docs; deal must DSCR.
Hard money
10% down · 12.0% · 12mo
- Down + closing
- —
- Monthly P&I
- —
- Monthly cashflow
- —
- DSCR
- —
- Eligible?
- —
Short-term bridge; refi at stabilization.
Listing history 2 events
-
2026-06-18remarks 699-char remark
-
2026-06-18$445,000 Active 1 DOM
ⓘ Source: listings_history table (triggers on properties + properties_extension) + one-shot
backfill from property_details.listing_events for pre-trigger history.
Tax reassessment forecast MA · Partial reset (capped growth)
- Current annual tax
- $3,120 · $260/mo
- Projected year-2 tax
- $4,297 · $358/mo
- Expected delta
- +$1,177/yr (+$98/mo · 37.7%)
ⓘ Screening estimate from a state-policy table — verify with the county assessor before closing.
Climate risk First Street
- Flood 1/10 Low FEMA zone X · 0% chance over 30 yrs
- Wildfire 1/10 Low
- Heat 3/10 Moderate 7 d/yr ≥92°F today · 17 d/yr by 30 yrs out
- Wind 4/10 Moderate 9% chance of damaging wind over 30 yrs
- Air quality 2/10 Low 1 unhealthy d/yr today · 1 by 30 yrs out
Nearby sold comps map
Loading sold comps map…
Walkable amenities ~0.75 mi
Loading nearby amenities…
Taxation est. · year 1
- Rental income
- $109,236
- − Mortgage interest
- −$24,927
- − Property taxes
- −$3,120
- − Insurance
- −$2,225
- − Repairs & maintenance
- −$8,739
- − Management
- −$8,739
- − Depreciation
- −$12,945
- Taxable income
- $48,541
- Est. tax owed @ 24.0%
- −$11,650
- After-tax cash flow
- $41,298/yr
For passive investors: Depreciation is non-cash, so a rental often shows a tax loss while cash-flowing — sheltering income. Rental losses are passive: they offset passive income freely, and up to $25,000/yr can offset ordinary (W-2) income if you actively participate and your MAGI is under $100k (phasing out to $0 by $150k); unused losses carry forward. On sale, claimed depreciation is recaptured at up to 25%, and gains may owe capital-gains tax (a 1031 exchange can defer both). Figures are a year-1 estimate at your 24.0% rate — not tax advice; consult a CPA.
Schools (NCES district)
- District
- Pittsfield
- NCES district ID
- 2509630
- Math proficiency
- 19% ▼ -10.00%
- Reading proficiency
- 34% ▼ -2.00%
- Median HH income
- $44,032
- Composite
- 22.67/100
- National rank
- #8046
- State rank
- #272 of 302 in MA
Livability — Pittsfield
- Score
- 75/100
- State rank
- #70
- US rank
- #3820
Category grades
Schools grade is shown separately in the Schools card above.
Census & demographics
- Census place
- Pittsfield, MA
- County
- Berkshire County · 44,848 people
- City population
- 44,848
- Metro
- Pittsfield, MA
- Population (ZIP)
- 44,848
- Household income
- $71,093
- Rent vs Own
- Severe rent burden
- 1580.0
Population outlook (Berkshire County) Hauer SSP2
- Today (2025)
- 119,723 people
- By 2030
- 114,608 · -4.3%
- By 2040
- 102,806 · -14.1%
- By 2050
- 91,305 · -23.7%
- By 2075
- 71,517 · -40.3%
- By 2100
- 57,988 · -51.6%
Race, ethnicity, and origin ACS 2023
- Neighborhood character
- Predominantly White (78%)
- Race & ethnicity
- White 78% Two or more races 10% Hispanic / Latino 9% Black 5% Asian 1%
- Hispanic origin (detail)
- Puerto Rican 3%
- Common ancestry
- Lithuanian 8% Romanian 6% Slovak 2%
- Foreign-born
- 7% · Canada, Jamaica
- Languages at home
- 90% English-only · Spanish 6% Other Indo-European 1% Russian/Polish/Slavic 1%
Political lean MEDSL · Berkshire
- 2024 margin
- Solid D (+39.9) · D 68.9% · R 29.0% · Other 2.1%
- 2008→2024 swing
- -12.5pp toward R · 2008: 52.4pp · 2024: 39.9pp
- All cycles
- 2024: D+39.9 2020: D+47.1 2016: D+41.5 2012: D+53.7 2008: D+52.4
Not yet ingested
- Civics
- —
Market trends
- HPI YoY
- ▼ -199.88%
- Current HPI
- 283.3421
- Rent YoY
- ▲ 7.72%
- Metro
- Pittsfield, MA
- State GDP YoY
- ▲ 2.28%
- F500 in state
- 38
Industry mix (Fortune 500 HQ in MA)
| Industry | F500 HQs | Revenue |
|---|---|---|
| Technology | 3 | $17B |
|
||
| Insurance | 2 | $84B |
|
||
| Retail | 2 | $76B |
|
||
| Life Sciences | 1 | $43B |
|
||
| Energy Technology | 1 | $31B |
|
||
| Aerospace / Defense | 1 | $18B |
|
||
Price history
+30.9% since first listed4 events — show timeline
- 2026-06-12 Listed $445,000 BCMLS
- 2024-03-01 Sold (MLS) $339,900 BCMLS
- 2024-01-22 Pending — BCMLS
- 2024-01-01 Listed $339,900 BCMLS
Property tax history
+1.2%/yrLatest (2023): $3,120 · +3.7% YoY. Source: county tax records.
Cash-flow waterfall
monthlySold comps — $/sqft
last 12 mo · ≤1 miLoading sold comps…