24826 Lakecrest Village Dr · Houston, TX
Flood risk 1/10 · Minimal
- FEMA flood zone
- X (unshaded)
- Chance of flooding over 30 yrs
- 0.0%
- Est. flood insurance / yr
- $507 – $1,088
Fire risk 3/10 · Minor
- Est. fire insurance / yr
- $1,222 – $2,270
Heat risk 9/10 · Severe
- Hot days now (above 111°F)
- 7 days/yr
- Hot days in 30 yrs
- 24 days/yr
Wind risk 9/10 · Severe
- Chance of severe wind over 30 yrs
- 99.0%
Air-quality risk 2/10 · Minimal
- Unhealthy air days now
- 1 days/yr
- Unhealthy air days in 30 yrs
- 2 days/yr
Risk factors via First Street. Map © Google.
Why this score? — see what drove the D+ grade
The composite is a weighted blend of 9 inputs, each scored 0–100. Each bar is that input's sub-score; the figure is the points it added to the 100-point composite (weight × sub-score).
- ARV discount +15.0/15.0
- Cash flow +11.0/30.0
- Schools +5.7/10.0
- 1% rule +5.1/10.0
- Livability +3.7/5.0
- DSCR +3.2/10.0
- Condition / age +2.5/5.0
- Rent growth +2.3/5.0
- Appreciation +0.0/10.0
$255,000
🖨 Deal sheet (PDF) 📄 Offer letter ✓ Due diligence
Listing remarks
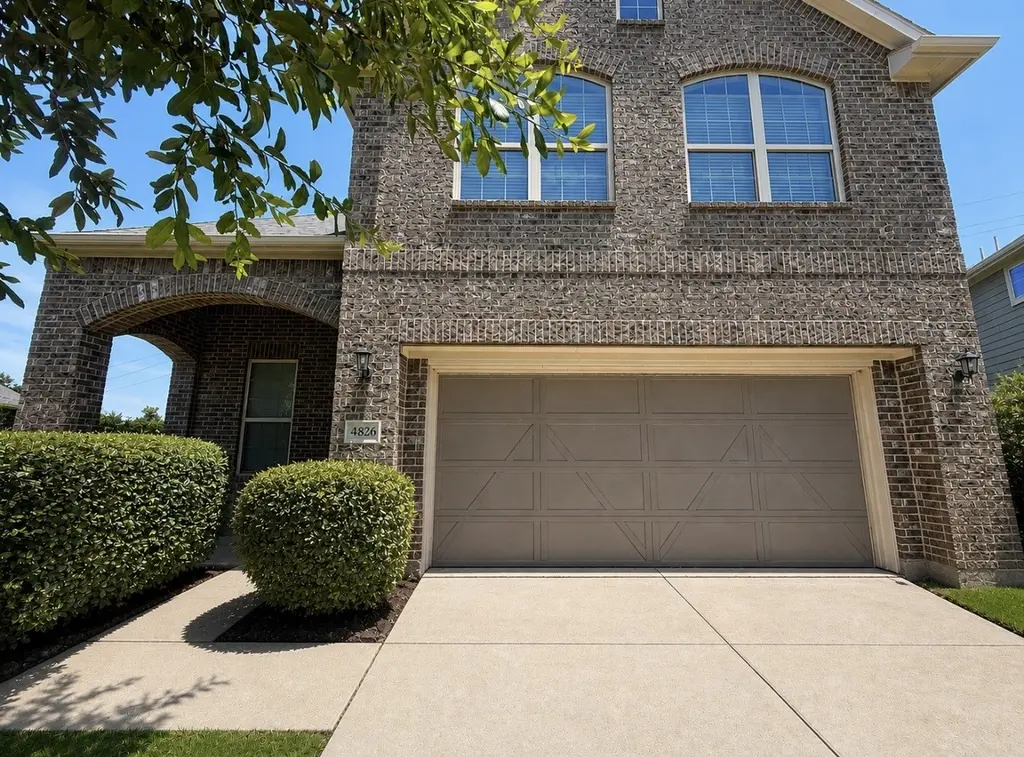
Investment property situated on a spacious corner lot with a scenic walking trail directly behind the property, this 4-bedroom, 2.5-bath home offers an exceptional combination of location, size, and potential. The home features numerous updates throughout, including an updated interior, modern finishes, and a well-appointed kitchen with stainless steel appliances. The functional floor plan provides generous living spaces, comfortable bedrooms, and plenty of room for entertaining both indoors and out. The large lot offers added privacy and outdoor enjoyment, while the trail access creates a unique connection to nature right from your backyard. Please note that the home experienced a plumbing
Key facts
- Updated interior
- Modern finishes
- Corner lot
Tags
Property features AI
Finance
- HOA & community: Community managed by Lakecrest Village / Real Manage; Annual HOA fee of $600
Exterior
- Parking: Attached garage with 2 spaces
- Utilities: Public water; Public sewer
- Home design: Residential property; Single-family design; Built in 2015; Slab foundation
- Construction: Brick construction; Composition roof
- Exterior features: Corner lot in a subdivision
Interior
- Kitchen: Dishwasher; Disposal; Gas range; Microwave
- Bedrooms: Primary bedroom on the first floor (approx. 14 x 17); Three secondary bedrooms on the second floor (approx. 11 x 13, 11 x 13, 10 x 13)
- Bathrooms: Two full bathrooms; One half bathroom
- Heating & cooling: Central heating (electric); Central cooling (electric and gas)
- Interior features: Separate shower; Game room
Neighborhood map
What this means for you Summary
Snapshot
- This is a 4-bed/2.5-bath single-family listed at $255k.
Deal economics
- At list price, monthly cash flow is $-108 ($-1k/yr) — negative.
- To cash-flow at today's rent, offer at most $236k (7.5% below list).
- Meets the 1% rule at list price ($3k rent vs $255k).
- Recommended offer: $236k (7.5% below list) — sets the bar for cash-flow.
- Cap rate 5.8% vs local median 3.2% in Houston — top-decile yield for the area; either an underpriced asset or a hidden risk that comps aren't pricing in. Stress-test before assuming the spread holds.
Location & tenants
- Location reads 74/100 on livability (#184 in TX, #4,771 nationally) — a middle-class / working-renter tenant base. Strengths: amenities A+, cost of living A+, housing A+; Watch: crime F.
- Katy ISD (suburban): math 61% / reading 63% proficiency, ranked #29 of 826 in TX (top 4%) — acceptable for families but not a draw, mixed tenant base, ~2y average lease.
- Zoned schools: Robert King El (math 41% / reading 44%, grade F, #1,313 of 4,322 statewide, top 31%, 981 students, 68% FRL); Katy J H (math 52% / reading 51%, grade C, #318 of 1,662 statewide, top 20%, 1,094 students, 53% FRL); Katy H S (math 62% / reading 74%, grade B, #150 of 1,632 statewide, top 10%, 3,330 students, 38% FRL) — zoned schools average 53% FRL vs 27% district-wide (25 pts higher); higher-poverty schools than district average — tighter screening recommended.
- Market conditions: Rents soft (-0.8%/yr); 2729 active listings in the ZIP; 11 comparable units currently listed for rent nearby; rentals at typical pace (median 21d on market — plan ~3-4 weeks tenant-placement turnaround); high-income renter base; 29,883 units permitted in Harris County in 2024 (8,621 in 5+ unit buildings).
Forward outlook
- Local home prices are declining (-3.0%/yr); year-one equity from $2k of loan paydown is wiped out by about $8k of value loss. Plan a longer hold.
- Harris County population projected at +47% by 2050 — long-run rental-demand tailwind backs the buy-and-hold thesis.
Negotiation context
- It's been on market 16 days — a 2% lower offer ($251k) is reasonable based on typical stale-listing flexibility.
Risks & watch-outs
- Watch-outs: property tax is 3.1% of price.
- Climate carrying-cost: severe wind risk, 99% chance of damaging wind over 30y; extreme-heat days projected 7→24/yr by 2055 (HVAC capex compounding) — expect insurance premiums to compound above CPI over the hold.
Questions for the listing agent
- What do current leases actually rent for vs. the listed asking? Can we see a recent rent roll and the last 12 months of T-12 income?
- Property tax is high relative to price — has the assessment been appealed recently, and will the sale trigger a re-assessment?
- What does the HOA fee cover, when was the last increase, and are there any pending special assessments or reserve-fund shortfalls?
- Is there a deadline driving the sale (1031 exchange, divorce, estate, relocation)? That informs how much negotiation room exists.
- Schools are D-rated, which usually means shorter tenancies and higher turnover. Who's the typical renter profile here, and what's been the actual vacancy rate?
- Crime grade is F in this area — have there been break-ins, vandalism, or insurance claims at this property in the last 3 years? What carrier currently insures it and at what premium?
- The area grade is low — what's the realistic commute time and amenity access for the typical tenant pool here? Any planned neighborhood developments (good or bad) we should know about?
- What's the average days-on-market for RENTAL listings here right now (not sales)? A rising rental-DOM trend means longer vacancies and softer asking-rent achievability than the comps imply.
- What's the recent tenant-quality profile in this submarket — average credit score on applications, eviction rate, late-payment / NSF rate, and stable-employment percentage? A property-management company in the area should have these aggregated.
- How much new for-sale + rental construction is in the pipeline within 1–3 miles? Heavy new supply typically softens prices + rents 12–24 months out; constrained supply supports both.
Investment metrics
- 1% rule
- 1.01% ✓
- Cap rate
- 5.78%
- Cash-on-cash
- -1.82%
- DSCR
- 0.92
- GRM
- 8.2
CMA / ARV
- ARV (on-the-fly)
- $319,060
- Comps found
- 12
Show comp detail 12 sales within ~0.75 mi
| Address | Dist | Beds/Ba | Sqft | Sold | Price | $/sf | Match |
|---|---|---|---|---|---|---|---|
| 2559 Pines Pointe Dr | 0.21mi | 4/2.5 | 2,206 (-3%) | 5mo | $298,500 | $135 | 80 |
| 24307 Forest Canopy Dr | 0.19mi | 4/2.5 | 2,207 (-3%) | 7mo | $309,900 | $140 | 80 |
| 2214 Parkside Trace Ct | 0.19mi | 3/2.0 (-1) | 2,166 (-5%) | 2mo | $345,000 | $159 | 74 |
| 2542 Pines Pointe Dr | 0.17mi | 3/2.0 (-1) | 2,055 (-10%) | 6mo | $315,000 | $153 | 64 |
| 24419 Lakecrest Bend Dr | 0.47mi | 4/2.5 | 2,458 (+8%) | 2mo | $299,000 | $122 | 64 |
| 2919 Acorn Oaks Dr | 0.72mi | 3/2.0 (-1) | 2,304 (+1%) | 1mo | $325,000 | $141 | 57 |
| 2218 Auburn Dr | 0.52mi | 4/2.5 | 2,519 (+10%) | 5mo | $299,990 | $119 | 54 |
| 25007 Lenora Dr | 0.67mi | 4/2.5 | 2,443 (+7%) | 6mo | $324,990 | $133 | 51 |
| 24930 Lakecrest Manor Dr | 0.69mi | 4/2.5 | 2,443 (+7%) | 8mo | $305,000 | $125 | 49 |
| 24139 Orange Orchard Ln | 0.64mi | 3/2.0 (-1) | 2,409 (+6%) | 8mo | $350,000 | $145 | 47 |
| 24418 Lakecrest Bend Dr | 0.46mi | 3/2.0 (-1) | 1,953 (-14%) | 3mo | $305,000 | $156 | 45 |
| 2213 Baylor Dr | 0.62mi | 4/3.0 | 1,942 (-15%) | 6mo | $250,000 | $129 | 40 |
Match score weights: distance 35% · size 25% · config 20% · recency 20%. Top-matched comps best support the ARV.
Projected returns pro-forma
-3.0% appreciation · 0.0% rent growth · sell at horizon
- IRR
- -23.4%
- Equity multiple
- 0.22×
- Total profit
- $-55,502
- Equity at exit
- $38,021
- IRR
- -33.1%
- Equity multiple
- -0.19×
- Total profit
- $-85,317
- Equity at exit
- $22,048
Cash invested: $71,400 (down + closing). Projections, not guarantees.
Landlord ↔ Tenant lean methodology
- Overall (STATE)
- 87 Strongly Landlord-Friendly
- State Texas
- 87 Strongly Landlord-Friendly · R+5
- County
- — inherits STATE
- City
- — inherits STATE
ZIP-level market 77493
- Rents YoY
- -0.8%
- Active inventory
- 2729
- Price-to-rent
- 8.2×
Monthly cashflow live
- Estimated rent
- $2,581 high interval (Pro) →
- Mortgage (P&I)
- −$1,337
- Tax from tax record
- −$654 /mo · $7,843/yr
- Insurance
- −$106
- HOA
- −$50
- Vacancy / Maint / Mgmt
- −$542
- Net cashflow
- $-108
Break-even live
Sensitivity live
| Price | -10% $36 | -5% $-36 | +0% $-108 | +5% $-180 | +10% $-253 |
|---|---|---|---|---|---|
| Rent | -10% $-312 | -5% $-210 | +0% $-108 | +5% $-6 | +10% $96 |
| Rate | -1.0pp $20 | -0.5pp $-43 | base $-108 | +0.5pp $-174 | +1.0pp $-242 |
UW: 25.0% down · 7.5% · 30yr · 1.5% tax · 5.0% vac · 8.0% maint · 8.0% mgmt
Financing live
Cash to close
- Down payment
- $63,750
- Closing costs
- $7,650
- Reserves months
- —
- Total cash needed
- —
Loan-product check · same deal, 3 products live
Conventional
25% down · 7.5% · 30yr
- Down + closing
- —
- Monthly P&I
- —
- Monthly cashflow
- —
- DSCR
- —
- Eligible?
- —
Personal DTI + credit; lowest rate.
DSCR
20% down · 8.5% · 30yr
- Down + closing
- —
- Monthly P&I
- —
- Monthly cashflow
- —
- DSCR
- —
- Eligible?
- —
No personal income docs; deal must DSCR.
Hard money
10% down · 12.0% · 12mo
- Down + closing
- —
- Monthly P&I
- —
- Monthly cashflow
- —
- DSCR
- —
- Eligible?
- —
Short-term bridge; refi at stabilization.
Rent comps 11 comps
| Address | Beds | Baths | Sqft | Rent | $/sqft | DOM | Units | Dist |
|---|---|---|---|---|---|---|---|---|
| 24414 Leachwood Dr Katy, TX | 4.0 | 2.0 | 1701 | $2,195 | $1.29 | 20d | 1 | 0.70mi |
| 1739 Palmetto Park Dr Katy, TX | 4.0 | 3.5 | 2998 | $3,100 | $1.03 | 45d | 1 | 0.84mi |
| 24907 Bastiani Canvas Ln Katy, TX | 4.0 | 2.5 | 2018 | $2,200 | $1.09 | 45d | 1 | 0.91mi |
| 3031 Bugatti Dr Katy, TX | 3.0 | 2.5 | 2100 | $1,700 | $0.81 | 26d | 1 | 1.00mi |
| 24714 Scarlatti Cantata Dr Katy, TX | 4.0 | 3.0 | 2660 | $3,000 | $1.13 | 45d | 1 | 1.18mi |
| 1508 Colonial Gorge Dr Katy, TX | 4.0 | 2.5 | 1904 | $2,650 | $1.39 | 18d | 1 | 1.21mi |
| 2222 Princess Snow Cir Katy, TX | 4.0 | 2.5 | 2958 | $2,425 | $0.82 | 14d | 1 | 1.22mi |
| 3106 Thicket Path Way Katy, TX | 4.0 | 2.5 | 3086 | $2,121 | $0.69 | 14d | 1 | 1.30mi |
| 3719 Don Giovanni Pl Katy, TX | 4.0 | 2.5 | 2730 | $2,400 | $0.88 | 0d | 1 | 1.38mi |
| 24938 Pavarotti Pl Katy, TX | 4.0 | 4.0 | 2839 | $2,450 | $0.86 | 45d | 1 | 1.44mi |
| 24703 Lorenzo Glaze Trl Katy, TX | 4.0 | 2.5 | 2650 | $2,336 | $0.88 | 14d | 1 | 1.46mi |
HOA detail
- Monthly dues
- $50 · $600/yr
Listing history 11 events
-
2026-06-15days on market $255,000 Pending 16 DOM
-
2026-06-13statusdays on market $255,000 Pending 14 DOM
-
2026-06-09days on market $255,000 Active 10 DOM
-
2026-06-08days on market $255,000 Active 9 DOM
-
2026-06-07days on market $255,000 Active 8 DOM
-
2026-06-04days on market $255,000 Active 5 DOM
-
2026-06-03days on market $255,000 Active 4 DOM
-
2026-06-02days on market $255,000 Active 3 DOM
-
2026-06-01days on market $255,000 Active 2 DOM
-
2026-05-31remarks 699-char remark
-
2026-05-31$255,000 Active 1 DOM
ⓘ Source: listings_history table (triggers on properties + properties_extension) + one-shot
backfill from property_details.listing_events for pre-trigger history.
Tax reassessment forecast TX · Resets to sale price
- Current annual tax
- $7,843 · $654/mo
- Projected year-2 tax
- $7,843 · $654/mo
- Expected delta
- $0/yr ($0/mo · 0.0%)
ⓘ Screening estimate from a state-policy table — verify with the county assessor before closing.
Climate risk First Street
- Flood 1/10 Low FEMA zone X (unshaded) · 0% chance over 30 yrs
- Wildfire 3/10 Moderate
- Heat 9/10 Extreme 7 d/yr ≥111°F today · 24 d/yr by 30 yrs out
- Wind 9/10 Extreme 99% chance of damaging wind over 30 yrs
- Air quality 2/10 Low 1 unhealthy d/yr today · 2 by 30 yrs out
Nearby sold comps map
Loading sold comps map…
Walkable amenities ~0.75 mi
Loading nearby amenities…
Taxation est. · year 1
- Rental income
- $30,970
- − Mortgage interest
- −$14,284
- − Property taxes
- −$7,843
- − Insurance
- −$1,275
- − Repairs & maintenance
- −$2,478
- − Management
- −$2,478
- − HOA
- −$600
- − Depreciation
- −$7,418
- Taxable loss
- −$5,405
- Est. tax savings @ 24.0%
- +$1,297
- After-tax cash flow
- $-1/yr
For passive investors: Depreciation is non-cash, so a rental often shows a tax loss while cash-flowing — sheltering income. Rental losses are passive: they offset passive income freely, and up to $25,000/yr can offset ordinary (W-2) income if you actively participate and your MAGI is under $100k (phasing out to $0 by $150k); unused losses carry forward. On sale, claimed depreciation is recaptured at up to 25%, and gains may owe capital-gains tax (a 1031 exchange can defer both). Figures are a year-1 estimate at your 24.0% rate — not tax advice; consult a CPA.
Schools (NCES district)
- District
- Katy ISD
- NCES district ID
- 4825170
- Math proficiency
- 61% ▼ -7.00%
- Reading proficiency
- 63% ▼ -3.00%
- Median HH income
- $90,312
- Composite
- 56.59/100
- National rank
- #1146
- State rank
- #29 of 826 in TX
Livability — Houston
- Score
- 74/100
- State rank
- #184
- US rank
- #4771
Category grades
Schools grade is shown separately in the Schools card above.
Census & demographics
- County
- Harris County · 4,702,590 people
- City population
- 3,226,434
- Metro
- Houston-The Woodlands-Sugar Land, TX
- Population (ZIP)
- 71,484
- Household income
- $118,464
- Rent vs Own
- Severe rent burden
- 913.0
Population outlook (Harris County) Hauer SSP2
- Today (2025)
- 5,571,493 people
- By 2030
- 6,089,821 · +9.3%
- By 2040
- 7,142,806 · +28.2%
- By 2050
- 8,185,864 · +46.9%
- By 2075
- 10,574,329 · +89.8%
- By 2100
- 12,109,958 · +117.4%
Race, ethnicity, and origin ACS 2023
- Neighborhood character
- Highly diverse neighborhood (Simpson 0.73)
- Race & ethnicity
- White 36% Hispanic / Latino 33% Two or more races 16% Black 15% Asian 12%
- Hispanic origin (detail)
- Mexican 20%
- Common ancestry
- Lithuanian 2% Slovak 1% Italian 1%
- Foreign-born
- 21% · Canada, Vietnam, Jamaica
- Languages at home
- 64% English-only · Spanish 22% Vietnamese 5% French/Haitian/Cajun 4%
Political lean MEDSL · Harris
- 2024 margin
- Lean D (+5.5) · D 52.0% · R 46.4% · Other 1.6%
- 2008→2024 swing
- +3.9pp toward D · 2008: 1.6pp · 2024: 5.5pp
- All cycles
- 2024: D+5.5 2020: D+13.3 2016: D+12.4 2012: D+0.1 2008: D+1.6
Not yet ingested
- Civics
- —
Market trends
- HPI YoY
- ▼ -140.65%
- Current HPI
- 233.1683
- Rent YoY
- ▼ -0.80%
- Metro
- Houston-The Woodlands-Sugar Land, TX
- State GDP YoY
- ▲ 3.95%
- F500 in state
- 110
Industry mix (Fortune 500 HQ in TX)
| Industry | F500 HQs | Revenue |
|---|---|---|
| Energy | 16 | $1,198B |
|
||
| Technology | 5 | $198B |
|
||
| Engineering / Construction | 4 | $72B |
|
||
| Energy Services | 3 | $60B |
|
||
| Utilities | 3 | $41B |
|
||
| Healthcare | 2 | $330B |
|
||
Price history
1 event — show timeline
- 2026-05-30 Listed $255,000 HARMLS
Property tax history
+26.1%/yrLatest (2025): $7,843 · -4.3% YoY. Source: county tax records.
Cash-flow waterfall
monthlySold comps — $/sqft
last 12 mo · ≤1 miLoading sold comps…