 Duplex
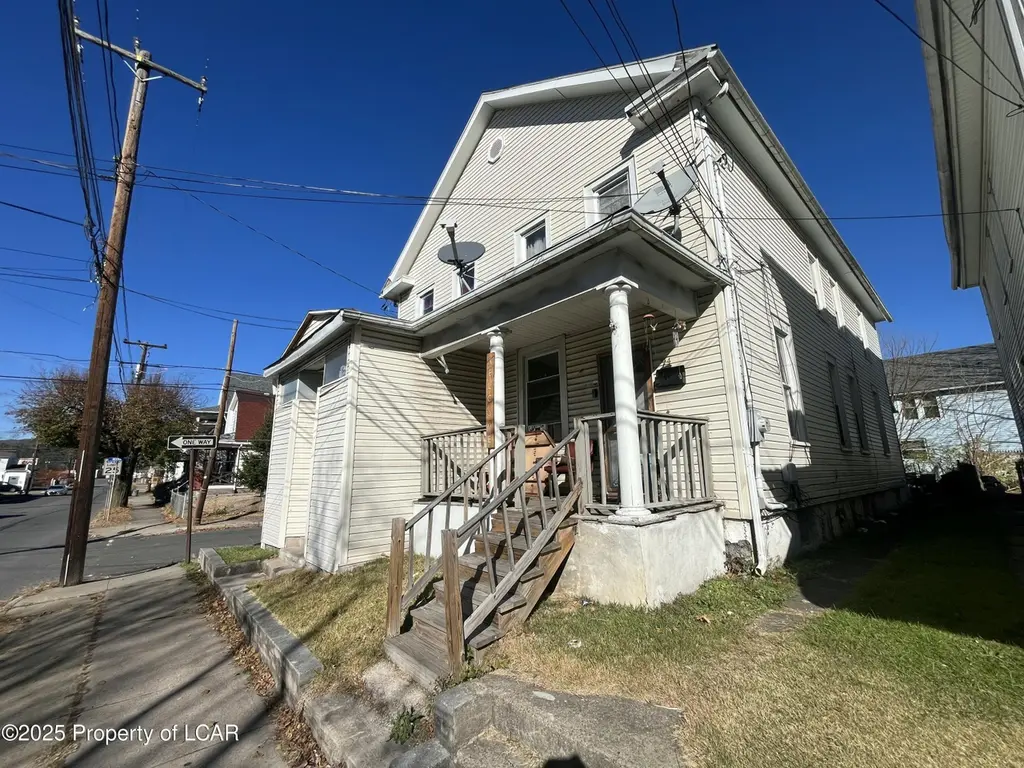
94 Oxford St · Wilkes-Barre, PA
Flood risk 7/10 · Major
- FEMA flood zone
- AE
- Chance of flooding over 30 yrs
- 0.77%
- Est. flood insurance / yr
- $1,737 – $8,500
Fire risk 3/10 · Minor
- Est. fire insurance / yr
- $511 – $949
Heat risk 4/10 · Minor
- Hot days now (above 94°F)
- 7 days/yr
- Hot days in 30 yrs
- 16 days/yr
Wind risk 3/10 · Minor
- Chance of severe wind over 30 yrs
- 4.0%
Air-quality risk 2/10 · Minimal
- Unhealthy air days now
- 1 days/yr
- Unhealthy air days in 30 yrs
- 2 days/yr
Risk factors via First Street. Map © Google.
Why this score? — see what drove the B- grade
The composite is a weighted blend of 9 inputs, each scored 0–100. Each bar is that input's sub-score; the figure is the points it added to the 100-point composite (weight × sub-score).
- Cash flow +30.0/30.0
- ARV discount +10.6/15.0
- DSCR +10.0/10.0
- 1% rule +8.5/10.0
- Rent growth +2.5/5.0
- Livability +2.5/5.0
- Condition / age +2.2/5.0
- Schools +1.9/10.0
- Appreciation +0.0/10.0
$199,000
🖨 Deal sheet 📄 Offer letter ✓ Due diligence
Multi-family units
County records classify this as Multi-Family (2-4 Unit). Listing-text estimate: 2 units. confirmed
Listing remarks MLS
Schedule your showing at this 2 unit side by side double in Hanover township. Each unit is 3 bed 1 bath with separated utilities , one is vacant and one is tenant occupied on a month to month lease. Add this to your portfolio or live in one side and collect rent from the other. Call today!
Key facts
- 2,500 sq ft lot
- Listed 384 days
Neighborhood map
What this means for you Summary
Snapshot
- This is a 2 × 3-bed/1.0-bath units multifamily listed at $199k. Condition is rated fair.
Deal economics
- At list price, monthly cash flow is $314 ($4k/yr) — positive. Per door: $157/mo.
- The deal already cash-flows at list — no discount required.
- Meets the 1% rule at list price ($3k rent vs $199k).
- Recommended offer: $175k (12.0% below list) — sets the bar for market timing.
- Cap rate 10.8% vs local median 5.7% in Wilkes-Barre — top-decile yield for the area; either an underpriced asset or a hidden risk that comps aren't pricing in. Stress-test before assuming the spread holds.
Location & tenants
- Location reads: area grade B — affects rentability + tenant quality, not the cash-flow math above.
- Hanover Area SD (suburban): math 19% / reading 25% proficiency, ranked #484 of 539 in PA (top 90%) — low school quality limits family demand, transient renter base, plan for 1-2y turnover.
- Market conditions: 81 active listings in the ZIP; 3 comparable units currently listed for rent nearby; rentals lingering (median 44d on market — plan ~5-8 weeks vacancy on turnover, expect pricing pressure); 67% of comp listings sitting > 30 days — soft ceiling on asking rent; 349 units permitted in Luzerne County in 2024 (16 in 5+ unit buildings).
- At $2,678/mo this rent would consume 55% of the median local household income ($59k/yr) (locally 568% of renters already pay >50% of income on rent) — very limited rent-growth headroom before tenants either downsize or default.
Forward outlook
- Local home prices are declining (-3.0%/yr); year-one equity from $1k of loan paydown is wiped out by about $6k of value loss. Plan a longer hold.
- Luzerne County population projected at +4% by 2050 — modest demand growth; plan on rents tracking national, not racing it.
Negotiation context
- It's been on market 384 days — a 12% lower offer ($175k) is reasonable based on typical stale-listing flexibility.
- 2 sale attempts; this cycle's ask has dropped $15k (7%) from the opening price — seller is motivated, your offer sets the floor, not the list.
Risks & watch-outs
- Watch-outs: flood insurance adds $427/mo.
- Climate carrying-cost: in FEMA flood zone AE (mandatory federal flood insurance) — expect insurance premiums to compound above CPI over the hold.
Questions for the listing agent
- It's been on market 384 days. Have you received any prior offers? Is the seller open to a 12% concession, seller financing, or rate buy-down credit?
- Can we see the unit-by-unit rent roll, current vacancy, and any below-market leases? What's the average tenancy length?
- What capital expenditures (roof, boiler, parking lot, exteriors) have been made in the last 5 years, and what's planned in the next 2?
- Have any recent inspections been done? Can we get a copy of the seller's disclosures and any deferred-maintenance estimates?
- What's the actual annual flood-insurance premium (NFIP or private), and is the property in a SFHA with mandatory coverage?
- Why hasn't it sold? Are there any deal-killer items the seller is aware of (foundation, flood, title, zoning, code violations)?
- Is there a deadline driving the sale (1031 exchange, divorce, estate, relocation)? That informs how much negotiation room exists.
- What's the average days-on-market for RENTAL listings here right now (not sales)? A rising rental-DOM trend means longer vacancies and softer asking-rent achievability than the comps imply.
- What's the recent tenant-quality profile in this submarket — average credit score on applications, eviction rate, late-payment / NSF rate, and stable-employment percentage? A property-management company in the area should have these aggregated.
- How much new apartment / multifamily construction is in the pipeline within 1–3 miles? Heavy new supply (>2% of stock underway) typically softens rents 12–24 months out; light construction supports rent growth.
Investment metrics
- 1% rule
- 1.35% ✓
- Cap rate
- 10.76%
- Cash-on-cash
- 15.94%
- DSCR
- 1.71
- GRM
- 6.2
CMA / ARV
- ARV (median comp)
- $213,821
- List price
- $199,000
- Delta
- -6.93%
- Verdict
- FAIR
- Comps
- 20 within 1.0 mi
Show comp detail 9 sales within ~0.75 mi
| Address | Dist | Beds/Ba | Sqft | Sold | Price | $/sf | Match |
|---|---|---|---|---|---|---|---|
| 13-15 Luzerne St | 0.17mi | 6/2.0 | 2,460 (+5%) | 13mo | $219,900 | $89 | 74 |
| 1431 1433 South Main St | 0.55mi | 6/2.0 | 2,400 (+2%) | 6mo | $230,000 | $96 | 66 |
| 284 Barney St | 0.34mi | 6/2.0 | 2,140 (-9%) | 10mo | $217,000 | $101 | 62 |
| 247 249 Lee Park Ave | 0.41mi | 6/3.0 | 2,400 (+2%) | 17mo | $180,000 | $75 | 59 |
| 192-194 194 Boland Ave | 0.37mi | 6/2.0 | 2,592 (+10%) | 12mo | $172,000 | $66 | 55 |
| 141-143 Horton St | 0.49mi | 6/2.0 | 2,670 (+14%) | 10mo | $175,000 | $66 | 46 |
| 1258 1259 Sively St | 0.72mi | 6/2.0 | 2,464 (+5%) | 19mo | $237,500 | $96 | 42 |
| 380 Old River Rd | 0.56mi | 7/4.0 (+1) | 2,550 (+9%) | 6mo | $259,000 | $102 | 42 |
| 100-102 Westminster St | 0.69mi | 7/2.0 (+1) | 2,682 (+14%) | 5mo | $155,000 | $58 | 35 |
Match score weights: distance 35% · size 25% · config 20% · recency 20%. Top-matched comps best support the ARV.
Projected returns pro-forma
-3.0% appreciation · 3.0% rent growth · sell at horizon
- IRR
- -5.8%
- Equity multiple
- 0.79×
- Total profit
- $-11,956
- Equity at exit
- $29,672
- IRR
- 4.1%
- Equity multiple
- 1.30×
- Total profit
- $16,556
- Equity at exit
- $17,206
Cash invested: $55,720 (down + closing). Projections, not guarantees.
Landlord ↔ Tenant lean methodology
- Overall (STATE)
- 62 Landlord-Friendly
- State Pennsylvania
- 62 Landlord-Friendly · EVEN
- County
- — inherits STATE
- City
- — inherits STATE
ZIP-level market 18706
- Active inventory
- 81
- Price-to-rent
- 12.4×
Monthly cashflow live
- Estimated rent
- $2,678 high interval (Pro) →
- Mortgage (P&I)
- −$1,044
- Tax est. 1.5%
- −$249 /mo · $2,985/yr
- Insurance
- −$83
- Flood insurance flood zone
- −$427 /mo · $5,118/yr
- HOA
- −$0
- Vacancy / Maint / Mgmt
- −$562
- Net cashflow
- $314
Break-even live
2-unit breakdown (identical units grouped — click to expand)
| Units | Beds | Baths | Est. rent |
|---|---|---|---|
| 2× units | 3 | 1 | $2,678 |
| #1 | 3 | 1 | $1,339 |
| #2 | 3 | 1 | $1,339 |
| Total (2 units) | $2,678 | ||
UW: 25.0% down · 7.5% · 30yr · 1.5% tax · 5.0% vac · 8.0% maint · 8.0% mgmt
Financing live
Cash to close
- Down payment
- $49,750
- Closing costs
- $5,970
- Reserves months
- —
- Total cash needed
- —
Loan-product check · same deal, 3 products live
Conventional
25% down · 7.5% · 30yr
- Down + closing
- —
- Monthly P&I
- —
- Monthly cashflow
- —
- DSCR
- —
- Eligible?
- —
Personal DTI + credit; lowest rate.
DSCR
20% down · 8.5% · 30yr
- Down + closing
- —
- Monthly P&I
- —
- Monthly cashflow
- —
- DSCR
- —
- Eligible?
- —
No personal income docs; deal must DSCR.
Hard money
10% down · 12.0% · 12mo
- Down + closing
- —
- Monthly P&I
- —
- Monthly cashflow
- —
- DSCR
- —
- Eligible?
- —
Short-term bridge; refi at stabilization.
Rent comps 3 comps
| Address | Beds | Baths | Sqft | Rent | $/sqft | DOM | Units | Dist |
|---|---|---|---|---|---|---|---|---|
| 533 S Franklin St Wilkes Barre, PA | 6.0 | 3.0 | 2810 | $3,000 | $1.07 | 43d | 1 | 1.05mi |
| 249 Parrish St Wilkes Barre, PA | 5.0 | 2.0 | 2214 | $2,000 | $0.90 | 13d | 1 | 1.13mi |
| 381 S River St Wilkes-Barre, PA | 6.0 | 2.0 | 1908 | $2,400 | $1.26 | 43d | 1 | 1.32mi |
Listing history 15 events
-
2026-06-14statusdays on market $199,000 Pending 384 DOM
-
2026-06-13days on market $199,000 Active 383 DOM
-
2026-06-10days on market $199,000 Active 381 DOM
-
2026-06-09days on market $199,000 Active 380 DOM
-
2026-06-08days on market $199,000 Active 379 DOM
-
2026-06-07days on market $199,000 Active 378 DOM
-
2026-06-02days on market $199,000 Active 373 DOM
-
2026-05-31days on market $199,000 Active 371 DOM
-
2026-05-30days on market $199,000 Active 370 DOM
-
2026-03-06price $199,000 290-char remark
Show marketing remark (290 chars)
Schedule your showing at this 2 unit side by side double in Hanover township. Each unit is 3 bed 1 bath with separated utilities , one is vacant and one is tenant occupied on a month to month lease. Add this to your portfolio or live in one side and collect rent from the other. Call today!
-
2026-01-02status Active 290-char remark
Show marketing remark (290 chars)
Schedule your showing at this 2 unit side by side double in Hanover township. Each unit is 3 bed 1 bath with separated utilities , one is vacant and one is tenant occupied on a month to month lease. Add this to your portfolio or live in one side and collect rent from the other. Call today!
-
2025-12-24historical 290-char remark
Show marketing remark (290 chars)
Schedule your showing at this 2 unit side by side double in Hanover township. Each unit is 3 bed 1 bath with separated utilities , one is vacant and one is tenant occupied on a month to month lease. Add this to your portfolio or live in one side and collect rent from the other. Call today!
-
2025-08-01price $196,000 290-char remark
Show marketing remark (290 chars)
Schedule your showing at this 2 unit side by side double in Hanover township. Each unit is 3 bed 1 bath with separated utilities , one is vacant and one is tenant occupied on a month to month lease. Add this to your portfolio or live in one side and collect rent from the other. Call today!
-
2025-06-16price $199,000 290-char remark
Show marketing remark (290 chars)
Schedule your showing at this 2 unit side by side double in Hanover township. Each unit is 3 bed 1 bath with separated utilities , one is vacant and one is tenant occupied on a month to month lease. Add this to your portfolio or live in one side and collect rent from the other. Call today!
-
2025-05-16$214,000 Active 290-char remark
Show marketing remark (290 chars)
Schedule your showing at this 2 unit side by side double in Hanover township. Each unit is 3 bed 1 bath with separated utilities , one is vacant and one is tenant occupied on a month to month lease. Add this to your portfolio or live in one side and collect rent from the other. Call today!
ⓘ Source: listings_history table (triggers on properties + properties_extension) + one-shot
backfill from property_details.listing_events for pre-trigger history.
Climate risk First Street
- Flood 7/10 Severe FEMA zone AE · 77% chance over 30 yrs
- Wildfire 3/10 Moderate
- Heat 4/10 Moderate 7 d/yr ≥94°F today · 16 d/yr by 30 yrs out
- Wind 3/10 Moderate 4% chance of damaging wind over 30 yrs
- Air quality 2/10 Low 1 unhealthy d/yr today · 2 by 30 yrs out
Nearby sold comps map
Loading sold comps map…
Walkable amenities ~0.75 mi
Loading nearby amenities…
Taxation est. · year 1
- Rental income
- $32,136
- − Mortgage interest
- −$11,147
- − Property taxes
- −$2,985
- − Insurance
- −$6,114
- − Repairs & maintenance
- −$2,571
- − Management
- −$2,571
- − Depreciation
- −$5,789
- Taxable income
- $960
- Est. tax owed @ 24.0%
- −$230
- After-tax cash flow
- $3,536/yr
For passive investors: Depreciation is non-cash, so a rental often shows a tax loss while cash-flowing — sheltering income. Rental losses are passive: they offset passive income freely, and up to $25,000/yr can offset ordinary (W-2) income if you actively participate and your MAGI is under $100k (phasing out to $0 by $150k); unused losses carry forward. On sale, claimed depreciation is recaptured at up to 25%, and gains may owe capital-gains tax (a 1031 exchange can defer both). Figures are a year-1 estimate at your 24.0% rate — not tax advice; consult a CPA.
Condition & rehab AI · 12 photos
This 2-unit property requires moderate renovations to improve its condition and increase its value. The exterior and interior need significant attention, and updating the kitchen and bathrooms will significantly enhance its appeal.
Repairs flagged
- Major siding — Missing or damaged trim
- Major exterior trim — Missing or damaged trim
- Major paint — Peeling paint
- Major kitchen appliances — Outdated and cluttered
- Major bathroom fixtures — Outdated and cluttered
- Major flooring — Worn and outdated
- Major interior walls — Paint peeling
Value-add opportunities
- Both Paint and reorganize — Fresh paint and organized space will attract buyers and renters
- Both Replace flooring — New flooring will improve the overall look and feel of the home
- Both Replace kitchen appliances — Modern appliances will make the kitchen more appealing to buyers and renters
- Both Replace bathroom fixtures — Up-to-date fixtures will make the bathrooms more appealing to buyers and renters
- Both Landscaping — A well-maintained lawn and landscaping will improve curb appeal and attract more potential buyers and renters
Renovation cost estimate screening
| Repair item | Severity | Est. cost |
|---|---|---|
| siding · Missing or damaged trim | Major | $15,000–50,000 |
| exterior trim · Missing or damaged trim | Major | $15,000–50,000 |
| paint · Peeling paint | Major | $15,000–50,000 |
| kitchen appliances · Outdated and cluttered | Major | $15,000–50,000 |
| bathroom fixtures · Outdated and cluttered | Major | $15,000–50,000 |
| flooring · Worn and outdated | Major | $15,000–50,000 |
| interior walls · Paint peeling | Major | $15,000–50,000 |
| Total estimated repair cost · 7 items | $105,000–350,000 |
Value-add ROI direction
- Both Paint and reorganize — Fresh paint and organized space will attract buyers and renters ↑
- Both Replace flooring — New flooring will improve the overall look and feel of the home ↑
- Both Replace kitchen appliances — Modern appliances will make the kitchen more appealing to buyers and renters ↑
- Both Replace bathroom fixtures — Up-to-date fixtures will make the bathrooms more appealing to buyers and renters ↑
- Both Landscaping — A well-maintained lawn and landscaping will improve curb appeal and attract more potential buyers and renters ↑
ⓘ Cost ranges are severity-bucket heuristics (US national rule-of-thumb). Get contractor quotes + a written scope before underwriting a rehab budget.
Schools (NCES district)
- District
- Hanover Area SD
- NCES district ID
- 4211420
- Math proficiency
- 19% ▼ -3.00%
- Reading proficiency
- 25% ▼ -21.00%
- Median HH income
- $40,015
- Composite
- 18.6/100
- National rank
- #8903
- State rank
- #484 of 539 in PA
Livability — Wilkes-Barre
No livability data for this city. (Only ~50 U.S. cities are tracked.)
Census & demographics
- County
- Luzerne County · 118,885 people
- City population
- 73,981
- Metro
- Scranton--Wilkes-Barre, PA
- Population (ZIP)
- 16,387
- Household income
- $58,558
- Rent vs Own
- Severe rent burden
- 568.0
Population outlook (Luzerne County) Hauer SSP2
- Today (2025)
- 319,505 people
- By 2030
- 319,943 · +0.1%
- By 2040
- 322,643 · +1.0%
- By 2050
- 330,817 · +3.5%
- By 2075
- 379,145 · +18.7%
- By 2100
- 431,908 · +35.2%
Race, ethnicity, and origin ACS 2023
- Neighborhood character
- Predominantly White (76%)
- Race & ethnicity
- White 76% Hispanic / Latino 17% Two or more races 11% Black 3%
- Hispanic origin (detail)
- Puerto Rican 9% Dominican 4%
- Common ancestry
- Romanian 18% Scotch-Irish 3% Subsaharan African 1%
- Foreign-born
- 6% · Canada
- Languages at home
- 88% English-only · Spanish 10% Other Asian/Pacific 1%
Political lean MEDSL · Luzerne
- 2024 margin
- R (+19.2) · D 40.0% · R 59.2%
- 2008→2024 swing
- -27.6pp toward R · 2008: 8.4pp · 2024: -19.2pp
- All cycles
- 2024: R+19.2 2020: R+14.4 2016: R+19.6 2012: D+4.8 2008: D+8.4
Not yet ingested
- Civics
- —
Market trends
- HPI YoY
- ▼ -150.02%
- Current HPI
- 196.19
- Rent YoY
- —
- Metro
- Scranton--Wilkes-Barre, PA
- State GDP YoY
- ▲ 1.68%
- F500 in state
- 34
Industry mix (Fortune 500 HQ in PA)
| Industry | F500 HQs | Revenue |
|---|---|---|
| Healthcare | 2 | $309B |
|
||
| Insurance | 2 | $27B |
|
||
| Telecommunications / Media | 1 | $124B |
|
||
| Industrial Distribution | 1 | $22B |
|
||
| Financial Services | 1 | $20B |
|
||
| Chemicals / Materials | 1 | $18B |
|
||
Price history
-7.0% since first listed6 events — show timeline
- 2026-03-06 Price Changed $199,000 LCAR
- 2026-01-02 Relisted — LCAR
- 2025-12-24 Delisted — LCAR
- 2025-08-01 Price Changed $196,000 LCAR
- 2025-06-16 Price Changed $199,000 LCAR
- 2025-05-16 Listed $214,000 LCAR
Cash-flow waterfall
monthlySold comps — $/sqft
last 12 mo · ≤1 miLoading sold comps…