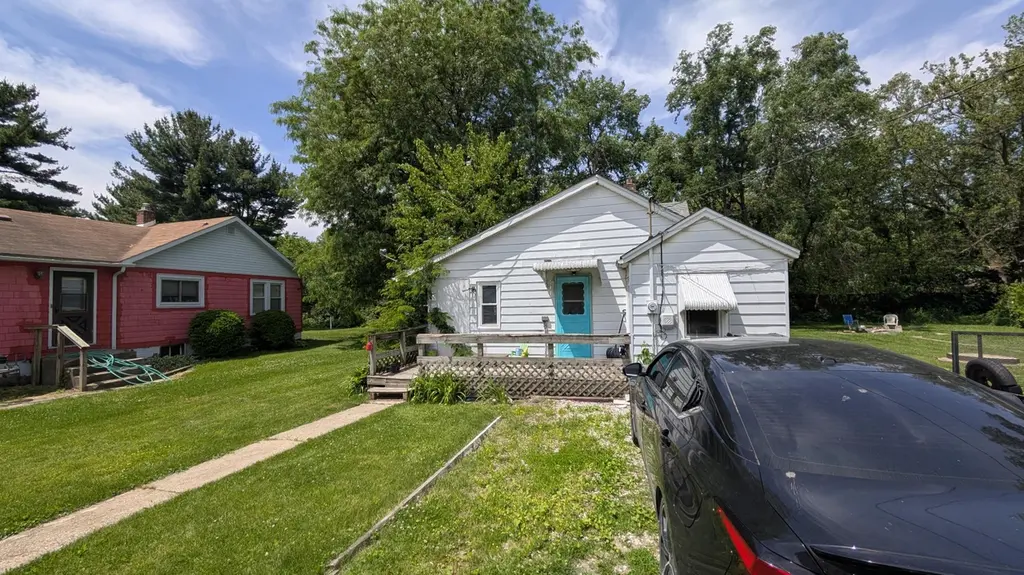
405 Maple Ave · Wheeler, IN
Flood risk 1/10 · Minimal
- FEMA flood zone
- X (unshaded)
- Chance of flooding over 30 yrs
- 0.0%
- Est. flood insurance / yr
- $507 – $1,088
Fire risk 2/10 · Minimal
- Est. fire insurance / yr
- $717 – $1,331
Heat risk 2/10 · Minimal
- Hot days now (above 101°F)
- 7 days/yr
- Hot days in 30 yrs
- 15 days/yr
Wind risk 2/10 · Minimal
- Chance of severe wind over 30 yrs
- 1.0%
Air-quality risk 2/10 · Minimal
- Unhealthy air days now
- 1 days/yr
- Unhealthy air days in 30 yrs
- 2 days/yr
Risk factors via First Street. Map © Google.
Why this score? — see what drove the B grade
The composite is a weighted blend of 9 inputs, each scored 0–100. Each bar is that input's sub-score; the figure is the points it added to the 100-point composite (weight × sub-score).
- Cash flow +25.1/30.0
- ARV discount +15.0/15.0
- DSCR +8.2/10.0
- 1% rule +5.3/10.0
- Schools +5.0/10.0
- Appreciation +4.6/10.0
- Rent growth +2.5/5.0
- Condition / age +2.5/5.0
- Livability +2.4/5.0
$130,000
🖨 Deal sheet (PDF) 📄 Offer letter ✓ Due diligence
Listing remarks MLS
Plenty of storage. This 3 Bedroom 1 bath home is just perfect for those who are in need of more space for their stuff. Featuring a 2 car Detached Garage, a Storage Shed in the back , and a Car Port for protection from weather. Perfect for anyone with boats, ATV's, a second Car. Hardwood floors in the Foyer and the upper level.
Key facts
- Spacious kitchen
- Bonus room
- Outdoor space
Tags
Property features AI
Finance
- Other: Occupant type: Owner
Exterior
- Parking: Detached parking
- Utilities: Public water; Public sewer
- Home design: Two-story property; Built in 1900; Property listed in fixer condition
- Construction: Year built: 1900
- Exterior features: No notable view
Interior
- Kitchen: No kitchen-specific appliances listed
- Bedrooms: Primary bedroom; Bedroom 2; Bedroom 3
- Bathrooms: 1 full bathroom
- Heating & cooling: Central air conditioning; Forced air heating powered by natural gas
- Interior features: No special interior features listed; Bonus room; Living room
- Laundry & utility: Washer and dryer on the main level
Neighborhood map
What this means for you Summary
Snapshot
- This is a 3-bed/1.0-bath single-family listed at $130k.
Deal economics
- At list price, monthly cash flow is $287 ($3k/yr) — positive.
- The deal already cash-flows at list — no discount required.
- Meets the 1% rule at list price ($1k rent vs $130k).
- Recommended offer: $128k (1.5% below list) — sets the bar for market timing.
Location & tenants
- Location reads 47/100 on livability (#658 in IN) — a working-class tenant base; expect higher turnover. Strengths: cost of living A+, crime A, health & safety A; Watch: schools F, amenities F, commute F.
- Union Township School Corporation (rural): math 52% / reading 58% proficiency, ranked #22 of 301 in IN (top 7%) — acceptable for families but not a draw, mixed tenant base, ~2y average lease; only 18% free/reduced lunch — higher-income household profile.
- Market conditions: 4 active listings in the ZIP; 542 units permitted in Porter County in 2024 (0 in 5+ unit buildings).
Forward outlook
- Local home prices are declining (-0.7%/yr); year-one equity from $899 of loan paydown is wiped out by about $955 of value loss. Plan a longer hold.
- Porter County population projected at +6% by 2050 — modest demand growth; plan on rents tracking national, not racing it.
- At projected returns (-0.7% appreciation + 3.0% rent growth), your $36k cash investment doubles in ~8 years — after that, you're playing with house money.
Negotiation context
- It's been on market 20 days — a 2% lower offer ($128k) is reasonable based on typical stale-listing flexibility.
- 7 sale attempts since 17y ago with the ask held roughly flat each time — persistent listings suggest the price (not the market) is what's stuck; bring a comps-based counter.
- Current owner paid $90k; 44% above their basis — modest negotiation headroom, anchor on the comps not their cost.
Risks & watch-outs
- Watch-outs: built in 1900 — expect roof / HVAC / electrical / plumbing capex.
Questions for the listing agent
- Built in 1900 — when were the roof, HVAC, electrical panel, plumbing, and water heater last replaced?
- Is there a deadline driving the sale (1031 exchange, divorce, estate, relocation)? That informs how much negotiation room exists.
- Schools are F-rated, which usually means shorter tenancies and higher turnover. Who's the typical renter profile here, and what's been the actual vacancy rate?
- What's the average days-on-market for RENTAL listings here right now (not sales)? A rising rental-DOM trend means longer vacancies and softer asking-rent achievability than the comps imply.
- What's the recent tenant-quality profile in this submarket — average credit score on applications, eviction rate, late-payment / NSF rate, and stable-employment percentage? A property-management company in the area should have these aggregated.
- How much new for-sale + rental construction is in the pipeline within 1–3 miles? Heavy new supply typically softens prices + rents 12–24 months out; constrained supply supports both.
Investment metrics
- 1% rule
- 1.03% ✓
- Cap rate
- 8.94%
- Cash-on-cash
- 9.45%
- DSCR
- 1.42
- GRM
- 8.1
CMA / ARV
- ARV (on-the-fly)
- $204,561
- Comps found
- 4
Show comp detail 4 sales within ~0.75 mi
| Address | Dist | Beds/Ba | Sqft | Sold | Price | $/sf | Match |
|---|---|---|---|---|---|---|---|
| 106 5th St | 0.38mi | 3/1.0 | 1,376 (+3%) | 19mo | $181,000 | $132 | 62 |
| 605 St Rd 130 | 0.44mi | 3/1.0 | 1,440 (+8%) | 17mo | $220,000 | $153 | 52 |
| 107 6th St | 0.41mi | 4/1.0 (+1) | 1,166 (-13%) | 16mo | $145,500 | $125 | 42 |
| 572 W 450 N | 0.63mi | 2/2.0 (-1) | 1,431 (+7%) | 23mo | $290,000 | $203 | 30 |
Match score weights: distance 35% · size 25% · config 20% · recency 20%. Top-matched comps best support the ARV.
Projected returns pro-forma
-0.73% appreciation · 3.0% rent growth · sell at horizon
- IRR
- 6.0%
- Equity multiple
- 1.27×
- Total profit
- $9,975
- Equity at exit
- $33,043
- IRR
- 12.0%
- Equity multiple
- 2.21×
- Total profit
- $44,189
- Equity at exit
- $36,136
Cash invested: $36,400 (down + closing). Projections, not guarantees.
Landlord ↔ Tenant lean methodology
- Overall (STATE)
- 90 Strongly Landlord-Friendly
- State Indiana
- 90 Strongly Landlord-Friendly · R+11
- County
- — inherits STATE
- City
- — inherits STATE
ZIP-level market 46393
- Home prices YoY
- -0.4%
- Active inventory
- 4
- Price-to-rent
- 8.1×
Monthly cashflow live
- Estimated rent
- $1,344 medium interval (Pro) →
- Mortgage (P&I)
- −$682
- Tax from tax record
- −$39 /mo · $474/yr
- Insurance
- −$54
- HOA
- −$0
- Vacancy / Maint / Mgmt
- −$282
- Net cashflow
- $287
Break-even live
Sensitivity live
| Price | -10% $360 | -5% $323 | +0% $287 | +5% $250 | +10% $213 |
|---|---|---|---|---|---|
| Rent | -10% $180 | -5% $234 | +0% $287 | +5% $340 | +10% $393 |
| Rate | -1.0pp $352 | -0.5pp $320 | base $287 | +0.5pp $253 | +1.0pp $219 |
UW: 25.0% down · 7.5% · 30yr · 1.5% tax · 5.0% vac · 8.0% maint · 8.0% mgmt
Financing live
Cash to close
- Down payment
- $32,500
- Closing costs
- $3,900
- Reserves months
- —
- Total cash needed
- —
Loan-product check · same deal, 3 products live
Conventional
25% down · 7.5% · 30yr
- Down + closing
- —
- Monthly P&I
- —
- Monthly cashflow
- —
- DSCR
- —
- Eligible?
- —
Personal DTI + credit; lowest rate.
DSCR
20% down · 8.5% · 30yr
- Down + closing
- —
- Monthly P&I
- —
- Monthly cashflow
- —
- DSCR
- —
- Eligible?
- —
No personal income docs; deal must DSCR.
Hard money
10% down · 12.0% · 12mo
- Down + closing
- —
- Monthly P&I
- —
- Monthly cashflow
- —
- DSCR
- —
- Eligible?
- —
Short-term bridge; refi at stabilization.
Listing history 14 events
-
2026-06-21days on market $130,000 Active 20 DOM
-
2026-06-18days on market $130,000 Active 17 DOM
-
2026-06-17days on market $130,000 Active 16 DOM
-
2026-06-16days on market $130,000 Active 15 DOM
-
2026-06-15days on market $130,000 Active 14 DOM
-
2026-06-13days on market $130,000 Active 12 DOM
-
2026-06-13days on market $130,000 Active 11 DOM
-
2026-06-09days on market $130,000 Active 8 DOM
-
2026-06-08days on market $130,000 Active 7 DOM
-
2026-06-07days on market $130,000 Active 6 DOM
-
2026-06-04days on market $130,000 Active 3 DOM
-
2026-06-03days on market $130,000 Active 2 DOM
-
2026-06-02remarks 691-char remark
-
2026-06-02$130,000 Active 1 DOM
ⓘ Source: listings_history table (triggers on properties + properties_extension) + one-shot
backfill from property_details.listing_events for pre-trigger history.
Tax reassessment forecast IN · Partial reset (capped growth)
- Current annual tax
- $474 · $39/mo
- Projected year-2 tax
- $789 · $66/mo
- Expected delta
- +$316/yr (+$26/mo · 66.6%)
ⓘ Screening estimate from a state-policy table — verify with the county assessor before closing.
Climate risk First Street
- Flood 1/10 Low FEMA zone X (unshaded) · 0% chance over 30 yrs
- Wildfire 2/10 Low
- Heat 2/10 Low 7 d/yr ≥101°F today · 15 d/yr by 30 yrs out
- Wind 2/10 Low 100% chance of damaging wind over 30 yrs
- Air quality 2/10 Low 1 unhealthy d/yr today · 2 by 30 yrs out
Nearby sold comps map
Loading sold comps map…
Walkable amenities ~0.75 mi
Loading nearby amenities…
Taxation est. · year 1
- Rental income
- $16,132
- − Mortgage interest
- −$7,282
- − Property taxes
- −$474
- − Insurance
- −$650
- − Repairs & maintenance
- −$1,291
- − Management
- −$1,291
- − Depreciation
- −$3,782
- Taxable income
- $1,363
- Est. tax owed @ 24.0%
- −$327
- After-tax cash flow
- $3,112/yr
For passive investors: Depreciation is non-cash, so a rental often shows a tax loss while cash-flowing — sheltering income. Rental losses are passive: they offset passive income freely, and up to $25,000/yr can offset ordinary (W-2) income if you actively participate and your MAGI is under $100k (phasing out to $0 by $150k); unused losses carry forward. On sale, claimed depreciation is recaptured at up to 25%, and gains may owe capital-gains tax (a 1031 exchange can defer both). Figures are a year-1 estimate at your 24.0% rate — not tax advice; consult a CPA.
Schools (NCES district)
- District
- Union Township School Corporation
- NCES district ID
- 1811700
- Math proficiency
- 52% ▼ -12.00%
- Reading proficiency
- 58% ▼ -10.00%
- Median HH income
- $78,021
- Composite
- 49.59/100
- National rank
- #1983
- State rank
- #22 of 301 in IN
Livability — Wheeler
- Score
- 47/100
- State rank
- #658
- US rank
- #26233
Category grades
Schools grade is shown separately in the Schools card above.
Census & demographics
- Census place
- Wheeler, IN
- City population
- 128
- Population (ZIP)
- 128
Population outlook (Porter County) Hauer SSP2
- Today (2025)
- 177,804 people
- By 2030
- 181,552 · +2.1%
- By 2040
- 185,830 · +4.5%
- By 2050
- 187,498 · +5.5%
- By 2075
- 189,585 · +6.6%
- By 2100
- 183,722 · +3.3%
Race, ethnicity, and origin ACS 2023
- Neighborhood character
- Predominantly White (100%)
- Race & ethnicity
- White 100%
- Common ancestry
- Iranian 14% Romanian 8% Portuguese 5%
Political lean MEDSL · Porter
- 2024 margin
- R (+10.5) · D 43.8% · R 54.3% · Other 1.8%
- 2008→2024 swing
- -17.7pp toward R · 2008: 7.2pp · 2024: -10.5pp
- All cycles
- 2024: R+10.5 2020: R+6.1 2016: R+6.8 2012: D+3.8 2008: D+7.2
Not yet ingested
- Civics
- —
Market trends
- HPI YoY
- ▼ -0.73%
- Current HPI
- 167.4984
- Rent YoY
- —
- Metro
- —
- State GDP YoY
- ▲ 2.90%
- F500 in state
- 18
Industry mix (Fortune 500 HQ in IN)
| Industry | F500 HQs | Revenue |
|---|---|---|
| Industrial Machinery | 2 | $37B |
|
||
| Healthcare | 1 | $177B |
|
||
| Pharmaceuticals | 1 | $45B |
|
||
| Metals / Steel | 1 | $18B |
|
||
| Agriculture | 1 | $17B |
|
||
| Packaging | 1 | $12B |
|
||
Price history
+188.9% since first listed12 events — show timeline
- 2026-06-01 Listed $130,000 NIRA MLS as Distributed by MLS Grid
- 2018-04-11 Sold (MLS) $90,000 NIRA MLS as Distributed by MLS Grid
- 2017-10-18 Listed $87,500 NIRA MLS as Distributed by MLS Grid
- 2012-11-11 Listing Removed — NIRA MLS as Distributed by MLS Grid
- 2012-05-14 Listed $84,900 NIRA MLS as Distributed by MLS Grid
- 2012-05-01 Listing Removed — NIRA MLS as Distributed by MLS Grid
- 2011-10-10 Listed $90,000 NIRA MLS as Distributed by MLS Grid
- 2010-04-30 Listed $30,000 NIRA MLS as Distributed by MLS Grid
- 2010-04-24 Listing Removed — NIRA MLS as Distributed by MLS Grid
- 2010-01-21 Listed $30,000 NIRA MLS as Distributed by MLS Grid
- 2010-01-14 Listing Removed — NIRA MLS as Distributed by MLS Grid
- 2009-10-13 Listed $45,000 NIRA MLS as Distributed by MLS Grid
Property tax history
+2.6%/yrLatest (2024): $474 · -0.6% YoY. Source: county tax records.
Cash-flow waterfall
monthlySold comps — $/sqft
last 12 mo · ≤1 miLoading sold comps…