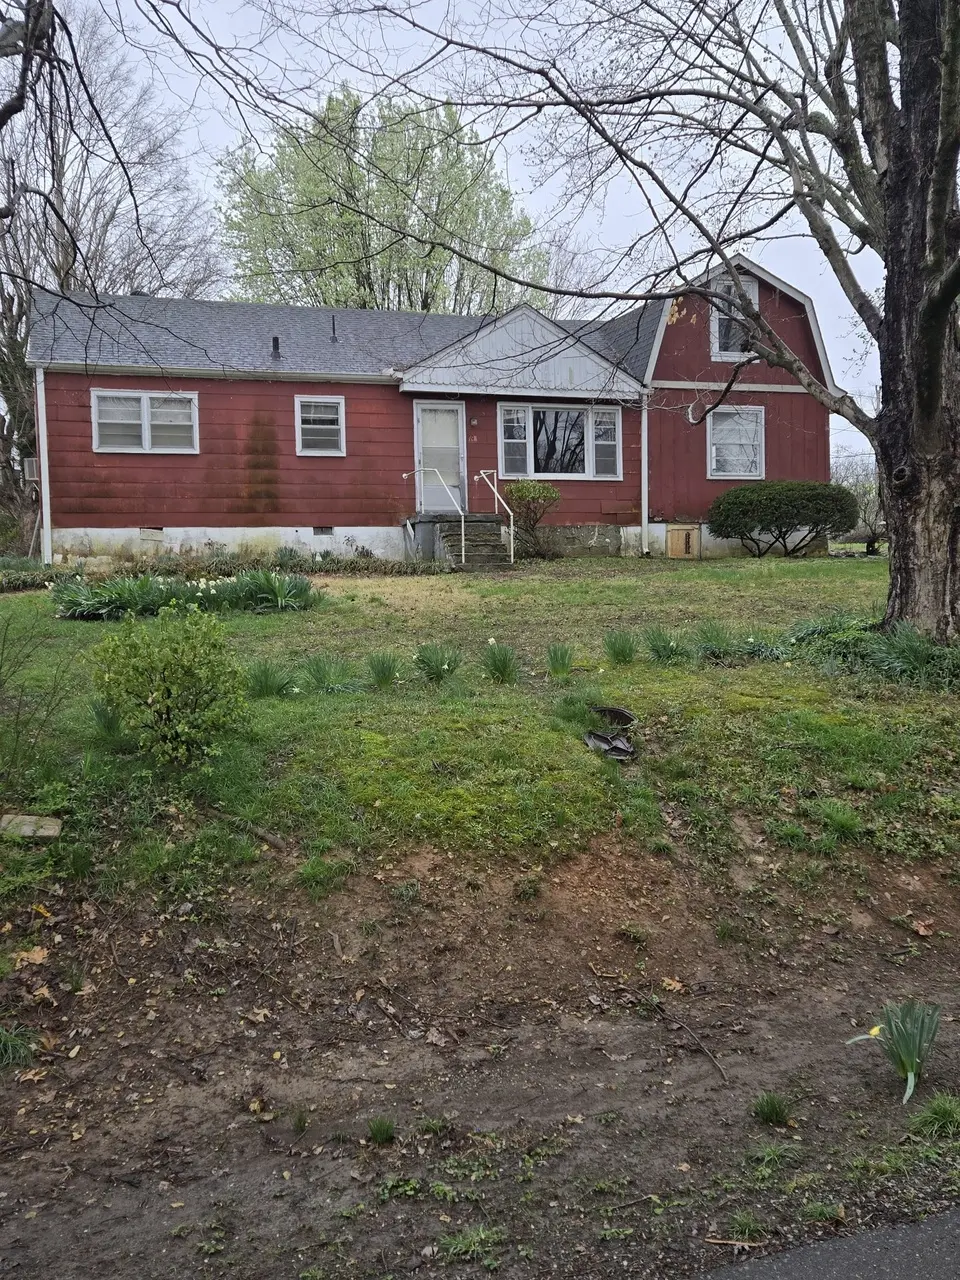
790 Draughon Dr · Greenbrier, TN
Flood risk 1/10 · Minimal
- FEMA flood zone
- X (unshaded)
- Chance of flooding over 30 yrs
- 0.0%
- Est. flood insurance / yr
- $507 – $1,088
Fire risk 3/10 · Minor
- Est. fire insurance / yr
- $949 – $1,763
Heat risk 5/10 · Moderate
- Hot days now (above 105°F)
- 7 days/yr
- Hot days in 30 yrs
- 19 days/yr
Wind risk 4/10 · Minor
- Chance of severe wind over 30 yrs
- 8.0%
Air-quality risk 2/10 · Minimal
- Unhealthy air days now
- 0 days/yr
- Unhealthy air days in 30 yrs
- 1 days/yr
Risk factors via First Street. Map © Google.
Why this score? — see what drove the C grade
The composite is a weighted blend of 9 inputs, each scored 0–100. Each bar is that input's sub-score; the figure is the points it added to the 100-point composite (weight × sub-score).
- Cash flow +22.4/30.0
- ARV discount +15.0/15.0
- DSCR +7.2/10.0
- 1% rule +5.1/10.0
- Livability +3.2/5.0
- Rent growth +2.5/5.0
- Condition / age +2.5/5.0
- Schools +2.2/10.0
- Appreciation +0.0/10.0
$195,000
🖨 Deal sheet 📄 Offer letter ✓ Due diligence
Listing remarks MLS
Great investment opportunity or fixer upper for yourself.
Key facts
- 0.32 acre lot
- 2 parking spots
- Built 1958
Property features AI
Finance
- Financial info: Annual tax information available
Exterior
- Parking: 2 total parking spaces (2 open); No covered parking
- Utilities: Public water; Public sewer; Water available
- Home design: Single-family residence; One story
- Construction: Fiber cement and wood siding; Block foundation; Existing (previously built) structure
- Exterior features: Lot approximately 0.32 acres; Lot dimensions 80 x 175; Lot size calculated from plat
Interior
- Kitchen: Electric oven
- Bedrooms: 3 bedrooms (all on the main level)
- Flooring: Wood flooring
- Bathrooms: 1 full bathroom
- Heating & cooling: Baseboard heating; Wall/window air conditioning units
- Interior features: Electric oven; Wood flooring; Crawl space basement
- Laundry & utility: Washer hookup; Electric dryer hookup
Neighborhood map
What this means for you Summary
Snapshot
- This is a 3-bed/1.0-bath single-family listed at $195k.
Deal economics
- At list price, monthly cash flow is $324 ($4k/yr) — positive.
- The deal already cash-flows at list — no discount required.
- Meets the 1% rule at list price ($2k rent vs $195k).
- Cap rate 8.3% vs local median 3.4% in Greenbrier — top-decile yield for the area; either an underpriced asset or a hidden risk that comps aren't pricing in. Stress-test before assuming the spread holds.
Location & tenants
- Location reads 63/100 on livability (#187 in TN) — a middle-class / working-renter tenant base. Strengths: crime A+, cost of living A+, housing A+; Watch: amenities F, commute F, health & safety F.
- Robertson County (rural): math 22% / reading 26% proficiency, ranked #82 of 139 in TN (top 59%) — low school quality limits family demand, transient renter base, plan for 1-2y turnover.
- Zoned schools: Greenbrier Elementary (math 41% / reading 36%, grade F, #260 of 952 statewide, top 28%, 624 students, 0% FRL); Greenbrier High School (math 15% / reading 22%, grade F, #208 of 332 statewide, top 63%, 812 students, 0% FRL) — zoned schools average 0% FRL vs 42% district-wide (42 pts lower); this property's tenant base skews higher-income than the district average.
- Market conditions: 122 active listings in the ZIP; 3 comparable units currently listed for rent nearby; rentals leasing fast (median 8d on market — plan ~1-2 weeks tenant-placement turnaround); 983 units permitted in Robertson County in 2024 (0 in 5+ unit buildings).
Forward outlook
- Local home prices are declining (-3.0%/yr); year-one equity from $1k of loan paydown is wiped out by about $6k of value loss. Plan a longer hold.
- Robertson County population projected at +7% by 2050 — modest demand growth; plan on rents tracking national, not racing it.
Negotiation context
- Only 13 days on market — expect competitive offers; lowballing is unlikely to land.
- 3 sale attempts with the ask held roughly flat each time — persistent listings suggest the price (not the market) is what's stuck; bring a comps-based counter.
Risks & watch-outs
- Watch-outs: built in 1958 — expect roof / HVAC / electrical / plumbing capex.
- Climate carrying-cost: extreme-heat days projected 7→19/yr by 2055 (HVAC capex compounding) — expect insurance premiums to compound above CPI over the hold.
Questions for the listing agent
- Built in 1958 — when were the roof, HVAC, electrical panel, plumbing, and water heater last replaced?
- Is there a deadline driving the sale (1031 exchange, divorce, estate, relocation)? That informs how much negotiation room exists.
- Schools are F-rated, which usually means shorter tenancies and higher turnover. Who's the typical renter profile here, and what's been the actual vacancy rate?
- What's the average days-on-market for RENTAL listings here right now (not sales)? A rising rental-DOM trend means longer vacancies and softer asking-rent achievability than the comps imply.
- What's the recent tenant-quality profile in this submarket — average credit score on applications, eviction rate, late-payment / NSF rate, and stable-employment percentage? A property-management company in the area should have these aggregated.
- How much new for-sale + rental construction is in the pipeline within 1–3 miles? Heavy new supply typically softens prices + rents 12–24 months out; constrained supply supports both.
Investment metrics
- 1% rule
- 1.01% ✓
- Cap rate
- 8.29%
- Cash-on-cash
- 7.12%
- DSCR
- 1.32
- GRM
- 8.3
CMA / ARV
- ARV (median comp)
- $303,691
- List price
- $195,000
- Delta
- -32.50%
- Verdict
- UNDERPRICED
- Comps
- 20 within 1.0 mi
Show comp detail 12 sales within ~0.75 mi
| Address | Dist | Beds/Ba | Sqft | Sold | Price | $/sf | Match |
|---|---|---|---|---|---|---|---|
| 952 Draughon Dr | 0.12mi | 3/1.0 | 1,400 (-0%) | 8mo | $275,000 | $196 | 87 |
| 1093 Main St | 0.45mi | 3/2.0 | 1,436 (+2%) | 0mo | $333,000 | $232 | 71 |
| 2567 Old Greenbrier Pike | 0.30mi | 3/2.0 | 1,319 (-6%) | 2mo | $364,900 | $277 | 71 |
| 2509 Nunley St | 0.41mi | 3/2.0 | 1,300 (-8%) | 0mo | $335,000 | $258 | 64 |
| 1016 W College St | 0.50mi | 3/2.0 | 1,362 (-3%) | 8mo | $344,000 | $253 | 61 |
| 596 E College St E | 0.50mi | 3/2.0 | 1,320 (-6%) | 5mo | $339,900 | $258 | 58 |
| 1162 W College St | 0.48mi | 3/2.0 | 1,285 (-8%) | 9mo | $340,000 | $265 | 52 |
| 1357 Main St | 0.54mi | 3/2.0 | 1,284 (-9%) | 6mo | $265,000 | $206 | 51 |
| 3033 Maitland Dr | 0.45mi | 3/2.0 | 1,250 (-11%) | 6mo | $288,000 | $230 | 51 |
| 3091 Rawls Dr | 0.48mi | 3/2.0 | 1,218 (-13%) | 1mo | $347,000 | $285 | 51 |
| 3029 Derby Town Dr | 0.63mi | 3/2.0 | 1,240 (-12%) | 9mo | $285,000 | $230 | 39 |
| 1010 Sunday Silence Dr | 0.74mi | 3/2.0 | 1,222 (-13%) | 3mo | $335,000 | $274 | 37 |
Match score weights: distance 35% · size 25% · config 20% · recency 20%. Top-matched comps best support the ARV.
Projected returns pro-forma
-3.0% appreciation · 3.0% rent growth · sell at horizon
- IRR
- -5.4%
- Equity multiple
- 0.80×
- Total profit
- $-11,010
- Equity at exit
- $29,075
- IRR
- 4.2%
- Equity multiple
- 1.31×
- Total profit
- $16,809
- Equity at exit
- $16,860
Cash invested: $54,600 (down + closing). Projections, not guarantees.
Landlord ↔ Tenant lean methodology
- Overall (STATE)
- 87 Strongly Landlord-Friendly
- State Tennessee
- 87 Strongly Landlord-Friendly · R+13
- County
- — inherits STATE
- City
- — inherits STATE
ZIP-level market 37073
- Home prices YoY
- -24.7%
- Active inventory
- 122
- Price-to-rent
- 8.3×
Monthly cashflow live
- Estimated rent
- $1,969 medium interval (Pro) →
- Mortgage (P&I)
- −$1,023
- Tax from tax record
- −$128 /mo · $1,533/yr
- Insurance
- −$81
- HOA
- −$0
- Vacancy / Maint / Mgmt
- −$413
- Net cashflow
- $324
Break-even live
UW: 25.0% down · 7.5% · 30yr · 1.5% tax · 5.0% vac · 8.0% maint · 8.0% mgmt
Financing live
Cash to close
- Down payment
- $48,750
- Closing costs
- $5,850
- Reserves months
- —
- Total cash needed
- —
Loan-product check · same deal, 3 products live
Conventional
25% down · 7.5% · 30yr
- Down + closing
- —
- Monthly P&I
- —
- Monthly cashflow
- —
- DSCR
- —
- Eligible?
- —
Personal DTI + credit; lowest rate.
DSCR
20% down · 8.5% · 30yr
- Down + closing
- —
- Monthly P&I
- —
- Monthly cashflow
- —
- DSCR
- —
- Eligible?
- —
No personal income docs; deal must DSCR.
Hard money
10% down · 12.0% · 12mo
- Down + closing
- —
- Monthly P&I
- —
- Monthly cashflow
- —
- DSCR
- —
- Eligible?
- —
Short-term bridge; refi at stabilization.
Rent comps 3 comps
| Address | Beds | Baths | Sqft | Rent | $/sqft | DOM | Units | Dist |
|---|---|---|---|---|---|---|---|---|
| 2126 Nunley St Greenbrier, TN | 3.0 | 2.0 | 1462 | $1,600 | $1.09 | 7d | 1 | 0.38mi |
| 1022 W College St Unit 2 Greenbrier, TN | 3.0 | 2.0 | 1120 | $2,400 | $2.14 | 4d | 1 | 0.49mi |
| 2017 Smith Cir Greenbrier, TN | 3.0 | 2.0 | 1442 | $2,200 | $1.53 | 7d | 1 | 0.99mi |
Listing history 14 events
-
2026-06-18days on market $195,000 Active 13 DOM
-
2026-06-17days on market $195,000 Active 12 DOM
-
2026-06-16days on market $195,000 Active 11 DOM
-
2026-06-15days on market $195,000 Active 10 DOM
-
2026-06-13days on market $195,000 Active 8 DOM
-
2026-06-13days on market $195,000 Active 7 DOM
-
2026-06-09days on market $195,000 Active 4 DOM
-
2026-06-08days on market $195,000 Active 3 DOM
-
2026-06-07pricedays on market $195,000 Active 2 DOM
-
2026-05-31days on market $205,000 Active 45 DOM
-
2026-04-16$205,000 Active 57-char remark
Show marketing remark (57 chars)
Great investment opportunity or fixer upper for yourself.
-
2026-04-09status Pending
-
2026-04-09historical
-
2026-03-12$220,000 Active
ⓘ Source: listings_history table (triggers on properties + properties_extension) + one-shot
backfill from property_details.listing_events for pre-trigger history.
Tax reassessment forecast TN · Resets to sale price
- Current annual tax
- $1,533 · $128/mo
- Projected year-2 tax
- $1,533 · $128/mo
- Expected delta
- $0/yr ($0/mo · 0.0%)
ⓘ Screening estimate from a state-policy table — verify with the county assessor before closing.
Climate risk First Street
- Flood 1/10 Low FEMA zone X (unshaded) · 0% chance over 30 yrs
- Wildfire 3/10 Moderate
- Heat 5/10 Major 7 d/yr ≥105°F today · 19 d/yr by 30 yrs out
- Wind 4/10 Moderate 8% chance of damaging wind over 30 yrs
- Air quality 2/10 Low 0 unhealthy d/yr today · 1 by 30 yrs out
Nearby sold comps map
Loading sold comps map…
Walkable amenities ~0.75 mi
Loading nearby amenities…
Taxation est. · year 1
- Rental income
- $23,628
- − Mortgage interest
- −$10,923
- − Property taxes
- −$1,533
- − Insurance
- −$975
- − Repairs & maintenance
- −$1,890
- − Management
- −$1,890
- − Depreciation
- −$5,673
- Taxable income
- $744
- Est. tax owed @ 24.0%
- −$179
- After-tax cash flow
- $3,708/yr
For passive investors: Depreciation is non-cash, so a rental often shows a tax loss while cash-flowing — sheltering income. Rental losses are passive: they offset passive income freely, and up to $25,000/yr can offset ordinary (W-2) income if you actively participate and your MAGI is under $100k (phasing out to $0 by $150k); unused losses carry forward. On sale, claimed depreciation is recaptured at up to 25%, and gains may owe capital-gains tax (a 1031 exchange can defer both). Figures are a year-1 estimate at your 24.0% rate — not tax advice; consult a CPA.
Schools (NCES district)
- District
- Robertson County
- NCES district ID
- 4703600
- Math proficiency
- 22% ▼ -11.00%
- Reading proficiency
- 26% ▼ -5.00%
- Median HH income
- $53,503
- Composite
- 21.55/100
- National rank
- #8313
- State rank
- #82 of 139 in TN
Livability — Greenbrier
- Score
- 63/100
- State rank
- #187
- US rank
- #15098
Category grades
Schools grade is shown separately in the Schools card above.
Census & demographics
- Census place
- Greenbrier, TN
- City population
- 14,312
- Population (ZIP)
- 14,312
Population outlook (Robertson County) Hauer SSP2
- Today (2025)
- 72,786 people
- By 2030
- 74,478 · +2.3%
- By 2040
- 76,948 · +5.7%
- By 2050
- 77,618 · +6.6%
- By 2075
- 77,545 · +6.5%
- By 2100
- 72,836 · +0.1%
Race, ethnicity, and origin ACS 2023
- Neighborhood character
- Predominantly White (93%)
- Race & ethnicity
- White 93% Hispanic / Latino 4% Two or more races 2%
- Common ancestry
- Slovak 3% Italian 2% Scotch-Irish 2%
- Foreign-born
- 2% · Canada, South Korea
- Languages at home
- 97% English-only · Spanish 2% Korean 1%
Political lean MEDSL · Robertson
- 2024 margin
- Solid R (+50.9) · D 24.0% · R 74.9% · Other 1.1%
- 2008→2024 swing
- -19.8pp toward R · 2008: -31.1pp · 2024: -50.9pp
- All cycles
- 2024: R+50.9 2020: R+47.0 2016: R+47.2 2012: R+35.6 2008: R+31.1
Not yet ingested
- Civics
- —
Market trends
- HPI YoY
- ▼ -96.44%
- Current HPI
- 293.5595
- Rent YoY
- —
- Metro
- —
- State GDP YoY
- ▲ 2.78%
- F500 in state
- 22
Industry mix (Fortune 500 HQ in TN)
| Industry | F500 HQs | Revenue |
|---|---|---|
| Healthcare | 3 | $91B |
|
||
| Retail | 3 | $72B |
|
||
| Transportation / Logistics | 1 | $88B |
|
||
| Paper / Packaging | 1 | $19B |
|
||
| Insurance | 1 | $13B |
|
||
| Energy | 1 | $12B |
|
||
Price history
-11.4% since first listed6 events — show timeline
- 2026-06-05 Listed $195,000 REALTRACS as Distributed by MLS Grid
- 2026-06-01 Listing Removed — REALTRACS as Distributed by MLS Grid
- 2026-04-16 Listed $205,000 REALTRACS as Distributed by MLS Grid
- 2026-04-09 Pending — REALTRACS as Distributed by MLS Grid
- 2026-04-09 Listing Removed — REALTRACS as Distributed by MLS Grid
- 2026-03-12 Listed $220,000 REALTRACS as Distributed by MLS Grid
Property tax history
+7.4%/yrLatest (2025): $1,533 · +0.0% YoY. Source: county tax records.
Cash-flow waterfall
monthlySold comps — $/sqft
last 12 mo · ≤1 miLoading sold comps…