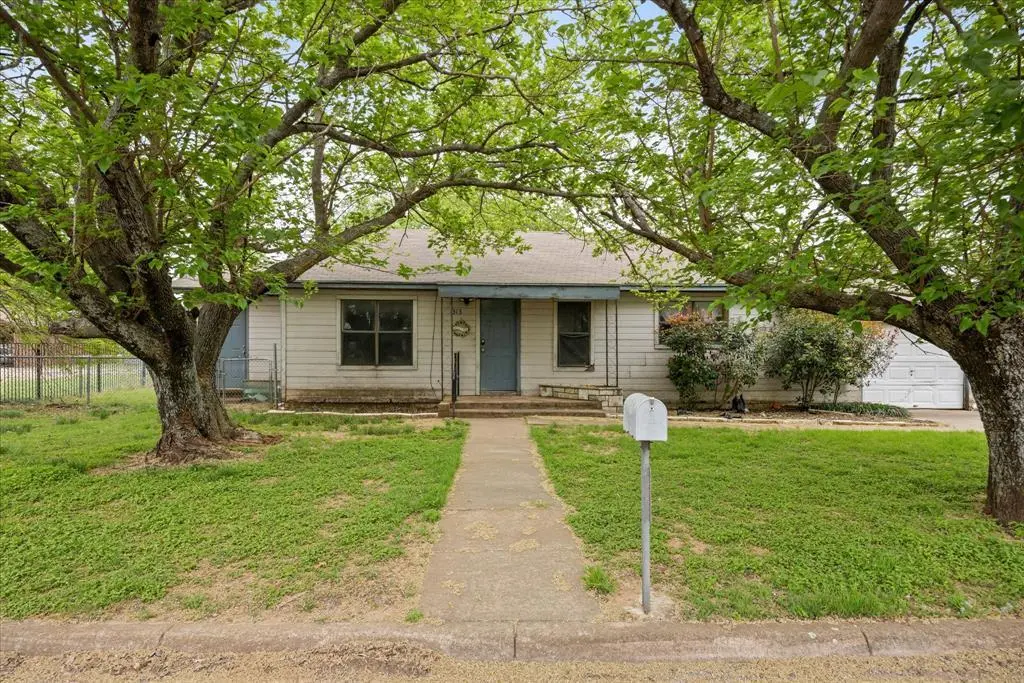
1313 Lipan Hwy · Granbury, TX
Flood risk 1/10 · Minimal
- FEMA flood zone
- X (unshaded)
- Chance of flooding over 30 yrs
- 0.0%
- Est. flood insurance / yr
- $507 – $1,088
Fire risk 6/10 · Moderate
- Est. fire insurance / yr
- $1,222 – $2,270
Heat risk 7/10 · Major
- Hot days now (above 108°F)
- 7 days/yr
- Hot days in 30 yrs
- 23 days/yr
Wind risk 6/10 · Moderate
- Chance of severe wind over 30 yrs
- 27.0%
Air-quality risk 2/10 · Minimal
- Unhealthy air days now
- 1 days/yr
- Unhealthy air days in 30 yrs
- 2 days/yr
Risk factors via First Street. Map © Google.
Why this score? — see what drove the C grade
The composite is a weighted blend of 9 inputs, each scored 0–100. Each bar is that input's sub-score; the figure is the points it added to the 100-point composite (weight × sub-score).
- Cash flow +18.4/30.0
- ARV discount +15.0/15.0
- DSCR +5.8/10.0
- 1% rule +4.7/10.0
- Schools +4.0/10.0
- Livability +3.3/5.0
- Rent growth +2.8/5.0
- Condition / age +2.5/5.0
- Appreciation +0.0/10.0
$175,000
🖨 Deal sheet (PDF) 📄 Offer letter ✓ Due diligence
Listing remarks MLS
INVESTOR SPECIAL. This is an awesome opportunity to invest in Granbury real estate. This home was built in 1968 and has a lot of old-world charm. Located on Lipan HWY on almost half an acre, the possibilities for this one are endless. Purchase and flip it for profit or turn it into a rental for positive monthly income. OR purchase it and remodel it into your dream home. With a huge backyard that backs onto a large field, the views of the countryside are gorgeous. Put a little TLC into this one and make it your own. Already connected to city sewer and water, no septic required. ***Home is being sold through an estate and will be sold as-is*** Come see this great deal while you can, won't last long!
Key facts
- 0.48 acre lot
- Garage
- Built 1968
Neighborhood map
What this means for you Summary
Snapshot
- This is a 3-bed/1.0-bath single-family listed at $175k.
Deal economics
- At list price, monthly cash flow is $162 ($2k/yr) — positive.
- The deal already cash-flows at list — no discount required.
- To meet the 1% rule (rent ≥ 1% of price), the offer needs to be $171k (2.5% below list).
- Recommended offer: $164k (6.0% below list) — sets the bar for market timing.
- Cap rate 7.4% vs local median 3.8% in Granbury — top-decile yield for the area; either an underpriced asset or a hidden risk that comps aren't pricing in. Stress-test before assuming the spread holds.
Location & tenants
- Location reads 66/100 on livability (#628 in TX) — a middle-class / working-renter tenant base. Strengths: cost of living A+, housing A+, health & safety A+; Watch: employment C-, crime D+, schools D.
- Granbury ISD (town): math 46% / reading 46% proficiency, ranked #237 of 826 in TX (top 29%) — families likely to look elsewhere, expect single-tenant / working-renter base with shorter leases.
- Market conditions: Rents rising (+1.1%/yr); 929 active listings in the ZIP; 11 comparable units currently listed for rent nearby; rentals at typical pace (median 25d on market — plan ~3-4 weeks tenant-placement turnaround); 45% of comp listings sitting > 30 days — soft ceiling on asking rent; 125 units permitted in Hood County in 2024 (0 in 5+ unit buildings).
Forward outlook
- Local home prices are declining (-3.0%/yr); year-one equity from $1k of loan paydown is wiped out by about $5k of value loss. Plan a longer hold.
- Hood County population projected at +29% by 2050 — long-run rental-demand tailwind backs the buy-and-hold thesis.
Negotiation context
- It's been on market 71 days — a 6% lower offer ($164k) is reasonable based on typical stale-listing flexibility.
- 2 sale attempts with the ask held roughly flat each time — persistent listings suggest the price (not the market) is what's stuck; bring a comps-based counter.
Risks & watch-outs
- Climate carrying-cost: major wind risk, 27% chance of damaging wind over 30y; major wildfire risk; extreme-heat days projected 7→23/yr by 2055 (HVAC capex compounding) — expect insurance premiums to compound above CPI over the hold.
Questions for the listing agent
- It's been on market 71 days. Have you received any prior offers? Is the seller open to a 6% concession, seller financing, or rate buy-down credit?
- Built in 1968 — when were the roof, HVAC, electrical panel, plumbing, and water heater last replaced?
- Why hasn't it sold? Are there any deal-killer items the seller is aware of (foundation, flood, title, zoning, code violations)?
- Is there a deadline driving the sale (1031 exchange, divorce, estate, relocation)? That informs how much negotiation room exists.
- Schools are D-rated, which usually means shorter tenancies and higher turnover. Who's the typical renter profile here, and what's been the actual vacancy rate?
- Crime grade is D in this area — have there been break-ins, vandalism, or insurance claims at this property in the last 3 years? What carrier currently insures it and at what premium?
- What's the average days-on-market for RENTAL listings here right now (not sales)? A rising rental-DOM trend means longer vacancies and softer asking-rent achievability than the comps imply.
- What's the recent tenant-quality profile in this submarket — average credit score on applications, eviction rate, late-payment / NSF rate, and stable-employment percentage? A property-management company in the area should have these aggregated.
- How much new for-sale + rental construction is in the pipeline within 1–3 miles? Heavy new supply typically softens prices + rents 12–24 months out; constrained supply supports both.
Investment metrics
- 1% rule
- 0.97% ✗
- Cap rate
- 7.41%
- Cash-on-cash
- 3.98%
- DSCR
- 1.18
- GRM
- 8.6
CMA / ARV
- ARV (median comp)
- $248,571
- List price
- $175,000
- Delta
- -29.60%
- Verdict
- UNDERPRICED
- Comps
- 20 within 1.0 mi
Show comp detail 3 sales within ~0.75 mi
| Address | Dist | Beds/Ba | Sqft | Sold | Price | $/sf | Match |
|---|---|---|---|---|---|---|---|
| 719 Lipan Dr | 0.45mi | 3/2.0 | 1,457 (+8%) | 8mo | $328,900 | $226 | 56 |
| 804 Switzer St | 0.69mi | 3/2.5 | 1,331 (-1%) | 18mo | $289,900 | $218 | 44 |
| 720 N Stockton St | 0.73mi | 3/2.0 | 1,203 (-11%) | 10mo | $350,000 | $291 | 36 |
Match score weights: distance 35% · size 25% · config 20% · recency 20%. Top-matched comps best support the ARV.
Projected returns pro-forma
-3.0% appreciation · 1.1% rent growth · sell at horizon
- IRR
- -12.2%
- Equity multiple
- 0.57×
- Total profit
- $-21,207
- Equity at exit
- $26,093
- IRR
- -6.1%
- Equity multiple
- 0.64×
- Total profit
- $-17,748
- Equity at exit
- $15,131
Cash invested: $49,000 (down + closing). Projections, not guarantees.
Landlord ↔ Tenant lean methodology
- Overall (STATE)
- 87 Strongly Landlord-Friendly
- State Texas
- 87 Strongly Landlord-Friendly · R+5
- County
- — inherits STATE
- City
- — inherits STATE
ZIP-level market 76048
- Home prices YoY
- -23.4%
- Rents YoY
- 1.1%
- Active inventory
- 929
- Price-to-rent
- 8.6×
Monthly cashflow live
- Estimated rent
- $1,706 high interval (Pro) →
- Mortgage (P&I)
- −$918
- Tax from tax record
- −$194 /mo · $2,333/yr
- Insurance
- −$73
- HOA
- −$0
- Vacancy / Maint / Mgmt
- −$358
- Net cashflow
- $162
Break-even live
Sensitivity live
| Price | -10% $261 | -5% $212 | +0% $162 | +5% $113 | +10% $63 |
|---|---|---|---|---|---|
| Rent | -10% $28 | -5% $95 | +0% $162 | +5% $230 | +10% $297 |
| Rate | -1.0pp $250 | -0.5pp $207 | base $162 | +0.5pp $117 | +1.0pp $71 |
UW: 25.0% down · 7.5% · 30yr · 1.5% tax · 5.0% vac · 8.0% maint · 8.0% mgmt
Financing live
Cash to close
- Down payment
- $43,750
- Closing costs
- $5,250
- Reserves months
- —
- Total cash needed
- —
Loan-product check · same deal, 3 products live
Conventional
25% down · 7.5% · 30yr
- Down + closing
- —
- Monthly P&I
- —
- Monthly cashflow
- —
- DSCR
- —
- Eligible?
- —
Personal DTI + credit; lowest rate.
DSCR
20% down · 8.5% · 30yr
- Down + closing
- —
- Monthly P&I
- —
- Monthly cashflow
- —
- DSCR
- —
- Eligible?
- —
No personal income docs; deal must DSCR.
Hard money
10% down · 12.0% · 12mo
- Down + closing
- —
- Monthly P&I
- —
- Monthly cashflow
- —
- DSCR
- —
- Eligible?
- —
Short-term bridge; refi at stabilization.
Rent comps 11 comps
| Address | Beds | Baths | Sqft | Rent | $/sqft | DOM | Units | Dist |
|---|---|---|---|---|---|---|---|---|
| 1114 Thorpe Springs Rd Granbury, TX | 2.0 | 1.0 | 920 | $1,500 | $1.63 | 8d | 1 | 0.11mi |
| 316 W Rucker St Granbury, TX | 3.0 | 2.0 | 1219 | $2,100 | $1.72 | 44d | 1 | 0.60mi |
| 814 W Bridge St Granbury, TX | 3.0 | 1.5 | 1360 | $1,695 | $1.25 | 44d | 1 | 0.72mi |
| 902 W Bridge St Granbury, TX | 2.0 | 1.0 | 1375 | $1,695 | $1.23 | 3d | 1 | 0.73mi |
| 907 W Bridge St Granbury, TX | 3.0 | 1.5 | 1161 | $1,700 | $1.46 | 44d | 1 | 0.76mi |
| 400 E Pearl St Granbury, TX | 2.0 | 2.0 | 1170 | $1,450 | $1.24 | 44d | 1 | 1.03mi |
| 400 E Pearl St Apt 108 Granbury, TX | 2.0 | 2.0 | 1200 | $1,450 | $1.21 | 25d | 1 | 1.03mi |
| 105 W Doyle St Granbury, TX | 2.0 | 1.0 | 980 | $1,675 | $1.71 | 18d | 1 | 1.03mi |
| 900 Elizabeth Blvd Granbury, TX | 3.0 | 1.0 | 1112 | $1,500 | $1.35 | 44d | 1 | 1.08mi |
| 1113 Gifford Dr Granbury, TX | 3.0 | 2.0 | 1248 | $1,749 | $1.40 | 25d | 1 | 1.36mi |
| 1000 Quiet Cv Granbury, TX | 1.0–2.0 | 1.0–2.0 | 841 | $1,700 | $2.02 | 2d | 29 | 1.46mi |
Listing history 11 events
-
2026-06-08status $175,000 Pending 71 DOM
-
2026-06-07days on market $175,000 Active Option Contract 71 DOM
-
2026-06-04days on market $175,000 Active Option Contract 68 DOM
-
2026-06-03days on market $175,000 Active Option Contract 67 DOM
-
2026-06-02days on market $175,000 Active Option Contract 66 DOM
-
2026-06-02days on market $175,000 Active Option Contract 65 DOM
-
2026-05-31days on market $175,000 Active Option Contract 64 DOM
-
2026-04-30status Active 706-char remark
Show marketing remark (706 chars)
INVESTOR SPECIAL. This is an awesome opportunity to invest in Granbury real estate. This home was built in 1968 and has a lot of old-world charm. Located on Lipan HWY on almost half an acre, the possibilities for this one are endless. Purchase and flip it for profit or turn it into a rental for positive monthly income. OR purchase it and remodel it into your dream home. With a huge backyard that backs onto a large field, the views of the countryside are gorgeous. Put a little TLC into this one and make it your own. Already connected to city sewer and water, no septic required. ***Home is being sold through an estate and will be sold as-is*** Come see this great deal while you can, won't last long!
-
2026-04-23historical Active Option Contract 706-char remark
Show marketing remark (706 chars)
INVESTOR SPECIAL. This is an awesome opportunity to invest in Granbury real estate. This home was built in 1968 and has a lot of old-world charm. Located on Lipan HWY on almost half an acre, the possibilities for this one are endless. Purchase and flip it for profit or turn it into a rental for positive monthly income. OR purchase it and remodel it into your dream home. With a huge backyard that backs onto a large field, the views of the countryside are gorgeous. Put a little TLC into this one and make it your own. Already connected to city sewer and water, no septic required. ***Home is being sold through an estate and will be sold as-is*** Come see this great deal while you can, won't last long!
-
2026-03-28$175,000 Active 706-char remark
Show marketing remark (706 chars)
INVESTOR SPECIAL. This is an awesome opportunity to invest in Granbury real estate. This home was built in 1968 and has a lot of old-world charm. Located on Lipan HWY on almost half an acre, the possibilities for this one are endless. Purchase and flip it for profit or turn it into a rental for positive monthly income. OR purchase it and remodel it into your dream home. With a huge backyard that backs onto a large field, the views of the countryside are gorgeous. Put a little TLC into this one and make it your own. Already connected to city sewer and water, no septic required. ***Home is being sold through an estate and will be sold as-is*** Come see this great deal while you can, won't last long!
-
1996-01-25soldstatus
ⓘ Source: listings_history table (triggers on properties + properties_extension) + one-shot
backfill from property_details.listing_events for pre-trigger history.
Tax reassessment forecast TX · Resets to sale price
- Current annual tax
- $2,333 · $194/mo
- Projected year-2 tax
- $3,202 · $267/mo
- Expected delta
- +$870/yr (+$72/mo · 37.3%)
ⓘ Screening estimate from a state-policy table — verify with the county assessor before closing.
Climate risk First Street
- Flood 1/10 Low FEMA zone X (unshaded) · 0% chance over 30 yrs
- Wildfire 6/10 Major
- Heat 7/10 Severe 7 d/yr ≥108°F today · 23 d/yr by 30 yrs out
- Wind 6/10 Major 27% chance of damaging wind over 30 yrs
- Air quality 2/10 Low 1 unhealthy d/yr today · 2 by 30 yrs out
Nearby sold comps map
Loading sold comps map…
Walkable amenities ~0.75 mi
Loading nearby amenities…
Taxation est. · year 1
- Rental income
- $20,467
- − Mortgage interest
- −$9,803
- − Property taxes
- −$2,333
- − Insurance
- −$875
- − Repairs & maintenance
- −$1,637
- − Management
- −$1,637
- − Depreciation
- −$5,091
- Taxable loss
- −$910
- Est. tax savings @ 24.0%
- +$218
- After-tax cash flow
- $2,166/yr
For passive investors: Depreciation is non-cash, so a rental often shows a tax loss while cash-flowing — sheltering income. Rental losses are passive: they offset passive income freely, and up to $25,000/yr can offset ordinary (W-2) income if you actively participate and your MAGI is under $100k (phasing out to $0 by $150k); unused losses carry forward. On sale, claimed depreciation is recaptured at up to 25%, and gains may owe capital-gains tax (a 1031 exchange can defer both). Figures are a year-1 estimate at your 24.0% rate — not tax advice; consult a CPA.
Schools (NCES district)
- District
- Granbury ISD
- NCES district ID
- 4821390
- Math proficiency
- 46% ▬ 0.00%
- Reading proficiency
- 46% ▲ 4.00%
- Median HH income
- $55,856
- Composite
- 40.04/100
- National rank
- #3820
- State rank
- #237 of 826 in TX
Livability — Granbury
- Score
- 66/100
- State rank
- #628
- US rank
- #11998
Category grades
Schools grade is shown separately in the Schools card above.
Census & demographics
- Census place
- Granbury, TX
- County
- Hood County · 58,506 people
- Metro
- Granbury, TX
- Population (ZIP)
- 27,000
- Household income
- $70,346
- Rent vs Own
- Severe rent burden
- 612.0
Population outlook (Hood County) Hauer SSP2
- Today (2025)
- 63,502 people
- By 2030
- 67,459 · +6.2%
- By 2040
- 74,958 · +18.0%
- By 2050
- 81,922 · +29.0%
- By 2075
- 98,872 · +55.7%
- By 2100
- 107,796 · +69.8%
Race, ethnicity, and origin ACS 2023
- Neighborhood character
- Predominantly White (80%)
- Race & ethnicity
- White 80% Hispanic / Latino 14% Two or more races 11% Black 1%
- Hispanic origin (detail)
- Mexican 13%
- Common ancestry
- Italian 2% Slovak 2% Portuguese 1%
- Foreign-born
- 4% · Canada
- Languages at home
- 89% English-only · Spanish 10%
Political lean MEDSL · Hood
- 2024 margin
- Solid R (+66.0) · D 16.6% · R 82.6%
- 2008→2024 swing
- -11.9pp toward R · 2008: -54.0pp · 2024: -66.0pp
- All cycles
- 2024: R+66.0 2020: R+64.1 2016: R+66.5 2012: R+64.7 2008: R+54.0
Not yet ingested
- Civics
- —
Market trends
- HPI YoY
- ▼ -83.25%
- Current HPI
- 272.2126
- Rent YoY
- ▲ 1.10%
- Metro
- Granbury, TX
- State GDP YoY
- ▲ 3.95%
- F500 in state
- 110
Industry mix (Fortune 500 HQ in TX)
| Industry | F500 HQs | Revenue |
|---|---|---|
| Energy | 16 | $1,198B |
|
||
| Technology | 5 | $198B |
|
||
| Engineering / Construction | 4 | $72B |
|
||
| Energy Services | 3 | $60B |
|
||
| Utilities | 3 | $41B |
|
||
| Healthcare | 2 | $330B |
|
||
Price history
4 events — show timeline
- 2026-04-30 Relisted — NTREIS
- 2026-04-23 Contingent — NTREIS
- 2026-03-28 Listed $175,000 NTREIS
- 1996-01-25 Sold (Public Records) — Public Records
Property tax history
+2.5%/yrLatest (2025): $2,333 · +13.1% YoY. Source: county tax records.
Cash-flow waterfall
monthlySold comps — $/sqft
last 12 mo · ≤1 miLoading sold comps…