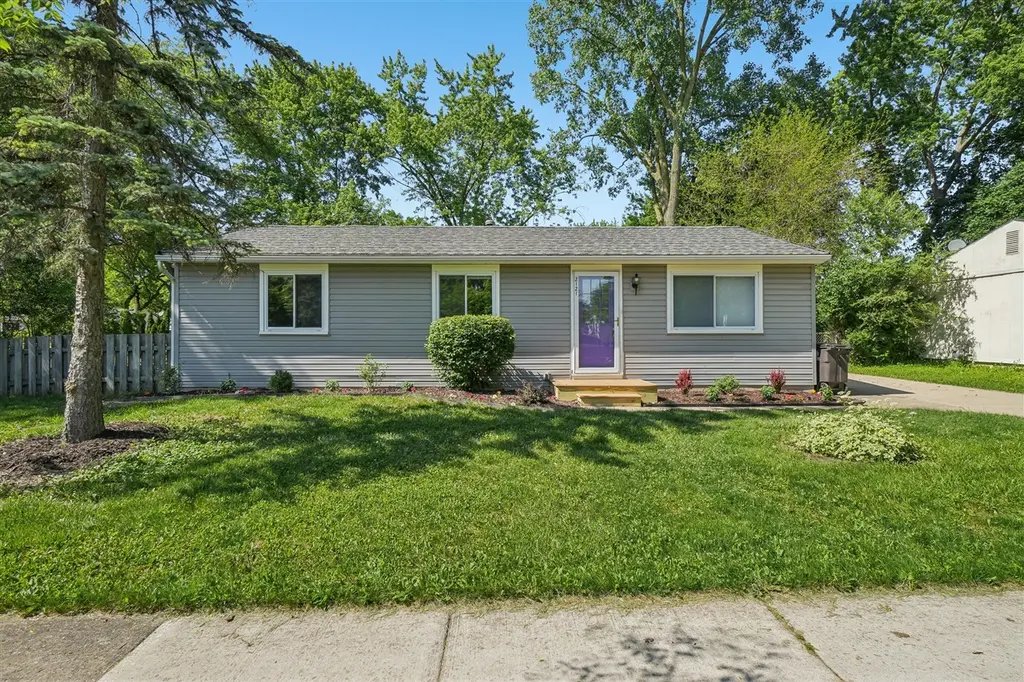
2121 Champagne Dr · Ann Arbor, MI
Flood risk 5/10 · Moderate
- FEMA flood zone
- X (unshaded)
- Chance of flooding over 30 yrs
- 0.47%
- Est. flood insurance / yr
- $507 – $1,088
Fire risk 1/10 · Minimal
- Est. fire insurance / yr
- $784 – $1,456
Heat risk 3/10 · Minor
- Hot days now (above 100°F)
- 7 days/yr
- Hot days in 30 yrs
- 15 days/yr
Wind risk 2/10 · Minimal
- Chance of severe wind over 30 yrs
- —
Air-quality risk 2/10 · Minimal
- Unhealthy air days now
- 1 days/yr
- Unhealthy air days in 30 yrs
- 3 days/yr
Risk factors via First Street. Map © Google.
Why this score? — see what drove the C- grade
The composite is a weighted blend of 9 inputs, each scored 0–100. Each bar is that input's sub-score; the figure is the points it added to the 100-point composite (weight × sub-score).
- ARV discount +13.1/15.0
- Cash flow +12.9/30.0
- Schools +6.5/10.0
- Livability +4.4/5.0
- DSCR +3.9/10.0
- Rent growth +3.9/5.0
- 1% rule +3.0/10.0
- Condition / age +2.5/5.0
- Appreciation +0.0/10.0
$240,000
🖨 Deal sheet 📄 Offer letter ✓ Due diligence
Listing remarks MLS
THIS HOME QUALIFIES FOR THE HOWARD HANNA 100% MONEY BACK GUARANTEE! Welcome home to this charming ranch nestled on a quiet street in an established Ann Arbor neighborhood! This well-maintained home offers the perfect combination of comfort, convenience, and opportunity with a functional layout, spacious living areas, and abundant natural light throughout. The kitchen provides plenty of cabinet and counter space and flows nicely into the main living area, making it ideal for everyday living and entertaining. Generously sized bedrooms offer flexibility for families, guests, or a home office setup. Step outside to enjoy the large yard with ample space for outdoor activities, gardening, or relaxing summer evenings. Conveniently located near parks, shopping, dining, schools, and major highways, this home is perfect for first-time buyers, investors, or anyone looking to add their personal touches to a great property. Schedule your private showing today!
Key facts
- 8,276 sq ft lot
- Built 1971
- Listed 2 days
Property features AI
Exterior
- Utilities: Public water; Natural gas connected
- Home design: Ranch-style single-family home; Single story; Built in 1971
- Construction: Vinyl siding; Metal roof; Crawl space foundation
- Exterior features: Corner lot; Paved road access; Shed(s) on property
Interior
- Kitchen: Range; Refrigerator
- Bedrooms: Primary bedroom; Bedroom 2; Bedroom 3; Bedroom 4
- Bathrooms: 1 full bathroom
- Heating & cooling: Forced air heating; Cooling available
- Interior features: Eat-in kitchen; Pantry; Total of 7 rooms; Crawl space basement
- Laundry & utility: Washer; Dryer; Natural gas water heater
Neighborhood map
What this means for you Summary
Snapshot
- This is a 3-bed/1.0-bath single-family listed at $240k.
Deal economics
- At list price, monthly cash flow is $-16 ($-195/yr) — negative.
- To cash-flow at today's rent, offer at most $237k (1.2% below list).
- To meet the 1% rule (rent ≥ 1% of price), the offer needs to be $191k (20.3% below list).
- Recommended offer: $191k (20.3% below list) — sets the bar for 1% rule.
- Cap rate 6.2% vs local median 2.5% in Ann Arbor — top-decile yield for the area; either an underpriced asset or a hidden risk that comps aren't pricing in. Stress-test before assuming the spread holds.
Location & tenants
- Location reads 88/100 on livability (#10 in MI, #155 nationally) — a professional / high-income tenant draw. Strengths: schools A+, amenities A+, commute A+; Watch: cost of living D.
- Ann Arbor Public Schools (urban): math 71% / reading 81% proficiency, ranked #6 of 540 in MI (top 1%) — strong family-tenant draw, lease renewals of 3-5y typical.
- Market conditions: Rents rising fast (+5.7%/yr); 151 active listings in the ZIP; 13 comparable units currently listed for rent nearby; rentals lingering (median 44d on market — plan ~5-8 weeks vacancy on turnover, expect pricing pressure); 54% of comp listings sitting > 30 days — soft ceiling on asking rent; solid renter incomes; 996 units permitted in Washtenaw County in 2024 (492 in 5+ unit buildings).
Forward outlook
- Local home prices are declining (-3.0%/yr); year-one equity from $2k of loan paydown is wiped out by about $7k of value loss. Plan a longer hold.
- Washtenaw County population projected at +25% by 2050 — long-run rental-demand tailwind backs the buy-and-hold thesis.
Negotiation context
- Only 2 days on market — expect competitive offers; lowballing is unlikely to land.
- Current owner paid $29k; list at $240k implies a 728% gain — meaningful room to come down on a strong offer.
Risks & watch-outs
- Climate carrying-cost: moderate flood risk — expect insurance premiums to compound above CPI over the hold.
Questions for the listing agent
- What do current leases actually rent for vs. the listed asking? Can we see a recent rent roll and the last 12 months of T-12 income?
- Built in 1971 — when were the roof, HVAC, electrical panel, plumbing, and water heater last replaced?
- Is there a deadline driving the sale (1031 exchange, divorce, estate, relocation)? That informs how much negotiation room exists.
- Schools are A-rated — typically a magnet for longer-tenancy family renters. What's the average tenant stay here, and is there a school-zone premium baked into asking?
- What's the average days-on-market for RENTAL listings here right now (not sales)? A rising rental-DOM trend means longer vacancies and softer asking-rent achievability than the comps imply.
- What's the recent tenant-quality profile in this submarket — average credit score on applications, eviction rate, late-payment / NSF rate, and stable-employment percentage? A property-management company in the area should have these aggregated.
- How much new for-sale + rental construction is in the pipeline within 1–3 miles? Heavy new supply typically softens prices + rents 12–24 months out; constrained supply supports both.
Investment metrics
- 1% rule
- 0.80% ✗
- Cap rate
- 6.21%
- Cash-on-cash
- -0.29%
- DSCR
- 0.99
- GRM
- 10.5
CMA / ARV
- ARV (on-the-fly)
- $274,176
- Comps found
- 12
Show comp detail 12 sales within ~0.75 mi
| Address | Dist | Beds/Ba | Sqft | Sold | Price | $/sf | Match |
|---|---|---|---|---|---|---|---|
| 12 Blain Ct | 0.17mi | 3/1.0 | 974 (-3%) | 15mo | $210,000 | $216 | 74 |
| 11 Metroview Ct | 0.06mi | 3/1.0 | 864 (-14%) | 5mo | $230,000 | $266 | 69 |
| 2110 Champagne Dr | 0.11mi | 3/1.0 | 864 (-14%) | 12mo | $325,001 | $376 | 61 |
| 14 Blain Court Ct | 0.16mi | 3/1.0 | 864 (-14%) | 12mo | $195,000 | $226 | 59 |
| 3141 Mc Comb St | 0.71mi | 3/1.0 | 1,044 (+4%) | 3mo | $310,000 | $297 | 58 |
| 16 Jay Lee Ct | 0.30mi | 3/1.5 | 1,080 (+7%) | 16mo | $300,000 | $278 | 58 |
| 10 Blain Ct | 0.18mi | 2/1.0 (-1) | 864 (-14%) | 9mo | $220,000 | $255 | 56 |
| 3195 Nordman Rd | 0.72mi | 3/1.0 | 988 (-2%) | 11mo | $320,000 | $324 | 54 |
| 2148 Champagne Dr | 0.15mi | 3/1.0 | 864 (-14%) | 20mo | $235,000 | $272 | 53 |
| 2935 Marshall St | 0.63mi | 3/1.5 | 980 (-3%) | 19mo | $334,900 | $342 | 48 |
| 2188 Hemlock Dr | 0.28mi | 3/1.0 | 864 (-14%) | 22mo | $194,000 | $225 | 45 |
| 2931 Shady Ln | 0.65mi | 2/1.0 (-1) | 960 (-5%) | 16mo | $240,000 | $250 | 44 |
Match score weights: distance 35% · size 25% · config 20% · recency 20%. Top-matched comps best support the ARV.
Projected returns pro-forma
-3.0% appreciation · 5.72% rent growth · sell at horizon
- IRR
- -14.0%
- Equity multiple
- 0.49×
- Total profit
- $-34,597
- Equity at exit
- $35,785
- IRR
- -1.6%
- Equity multiple
- 0.88×
- Total profit
- $-8,332
- Equity at exit
- $20,751
Cash invested: $67,200 (down + closing). Projections, not guarantees.
Landlord ↔ Tenant lean methodology
- Overall (STATE)
- 62 Landlord-Friendly
- State Michigan
- 62 Landlord-Friendly · EVEN
- County
- — inherits STATE
- City
- — inherits STATE
ZIP-level market 48108
- Rents YoY
- 5.7%
- Active inventory
- 151
- Price-to-rent
- 10.5×
Monthly cashflow live
- Estimated rent
- $1,913 high interval (Pro) →
- Mortgage (P&I)
- −$1,259
- Tax from tax record
- −$169 /mo · $2,028/yr
- Insurance
- −$100
- HOA
- −$0
- Vacancy / Maint / Mgmt
- −$402
- Net cashflow
- $-16
Break-even live
UW: 25.0% down · 7.5% · 30yr · 1.5% tax · 5.0% vac · 8.0% maint · 8.0% mgmt
Financing live
Cash to close
- Down payment
- $60,000
- Closing costs
- $7,200
- Reserves months
- —
- Total cash needed
- —
Loan-product check · same deal, 3 products live
Conventional
25% down · 7.5% · 30yr
- Down + closing
- —
- Monthly P&I
- —
- Monthly cashflow
- —
- DSCR
- —
- Eligible?
- —
Personal DTI + credit; lowest rate.
DSCR
20% down · 8.5% · 30yr
- Down + closing
- —
- Monthly P&I
- —
- Monthly cashflow
- —
- DSCR
- —
- Eligible?
- —
No personal income docs; deal must DSCR.
Hard money
10% down · 12.0% · 12mo
- Down + closing
- —
- Monthly P&I
- —
- Monthly cashflow
- —
- DSCR
- —
- Eligible?
- —
Short-term bridge; refi at stabilization.
Rent comps 13 comps
| Address | Beds | Baths | Sqft | Rent | $/sqft | DOM | Units | Dist |
|---|---|---|---|---|---|---|---|---|
| 3032 Forest Creek Ct Ann Arbor, MI | 2.0 | 2.0 | 966 | $1,750 | $1.81 | 44d | 1 | 0.30mi |
| 3510 Pheasant Run Cir Ann Arbor, MI | 1.0–2.0 | 1.0 | 825 | $1,405 | $1.70 | 14d | 10 | 0.32mi |
| 3510 Pheasant Run Cir Ann Arbor, MI | 1.0–2.0 | 1.0 | 825 | $1,445 | $1.75 | 44d | 13 | 0.32mi |
| 2040 Cloverly Ln Ann Arbor, MI | 2.0 | 2.5 | 1555 | $2,292 | $1.47 | 14d | 2 | 0.37mi |
| 2960 Birch Hollow Dr Ann Arbor, MI | 1.0–2.0 | 1.0 | 718 | $1,299 | $1.81 | 14d | 3 | 0.39mi |
| 2716 Packard St Ann Arbor, MI | 1.0–2.0 | 1.0 | 862 | $1,350 | $1.57 | 44d | 1 | 0.49mi |
| 3238 Platt Rd Ann Arbor, MI | 3.0 | 1.5 | 1488 | $2,500 | $1.68 | 44d | 1 | 0.84mi |
| 2511 Packard St Ann Arbor, MI | 2.0–3.0 | 2.0 | 1200 | $2,539 | $2.12 | 14d | 7 | 1.01mi |
| 799 Addington Ln Ann Arbor, MI | 2.0 | 2.0 | 1299 | $2,150 | $1.66 | 14d | 1 | 1.08mi |
| 1533 Pine Valley Blvd Ann Arbor, MI | 1.0–2.0 | 1.0–1.5 | 827 | $1,725 | $2.09 | 44d | 1 | 1.20mi |
| 2315 Packard St Ann Arbor, MI | 2.0 | 1.0 | 848 | $1,500 | $1.77 | 14d | 1 | 1.34mi |
| 2315 Packard St Ann Arbor, MI | 2.0 | 1.0 | 869 | $1,500 | $1.73 | 44d | 2 | 1.35mi |
| 3029 Charing Cross Rd Unit 3029 Ann Arbor, MI | 3.0 | 2.5 | 1400 | $2,400 | $1.71 | 44d | 1 | 1.46mi |
Listing history 5 events
-
2026-06-09status $240,000 Pending 2 DOM
-
2026-06-08days on market $240,000 Active 2 DOM
-
2026-06-07status $240,000 Active 1 DOM
-
2026-06-03remarks 699-char remark
-
2026-06-03$240,000 Coming Soon 1 DOM
ⓘ Source: listings_history table (triggers on properties + properties_extension) + one-shot
backfill from property_details.listing_events for pre-trigger history.
Tax reassessment forecast MI · Partial reset (capped growth)
- Current annual tax
- $2,028 · $169/mo
- Projected year-2 tax
- $2,862 · $239/mo
- Expected delta
- +$834/yr (+$69/mo · 41.1%)
ⓘ Screening estimate from a state-policy table — verify with the county assessor before closing.
Climate risk First Street
- Flood 5/10 Major FEMA zone X (unshaded) · 47% chance over 30 yrs
- Wildfire 1/10 Low
- Heat 3/10 Moderate 7 d/yr ≥100°F today · 15 d/yr by 30 yrs out
- Wind 2/10 Low
- Air quality 2/10 Low 1 unhealthy d/yr today · 3 by 30 yrs out
Nearby sold comps map
Loading sold comps map…
Walkable amenities ~0.75 mi
Loading nearby amenities…
Taxation est. · year 1
- Rental income
- $22,957
- − Mortgage interest
- −$13,444
- − Property taxes
- −$2,028
- − Insurance
- −$1,200
- − Repairs & maintenance
- −$1,837
- − Management
- −$1,837
- − Depreciation
- −$6,982
- Taxable loss
- −$4,369
- Est. tax savings @ 24.0%
- +$1,049
- After-tax cash flow
- $854/yr
For passive investors: Depreciation is non-cash, so a rental often shows a tax loss while cash-flowing — sheltering income. Rental losses are passive: they offset passive income freely, and up to $25,000/yr can offset ordinary (W-2) income if you actively participate and your MAGI is under $100k (phasing out to $0 by $150k); unused losses carry forward. On sale, claimed depreciation is recaptured at up to 25%, and gains may owe capital-gains tax (a 1031 exchange can defer both). Figures are a year-1 estimate at your 24.0% rate — not tax advice; consult a CPA.
Schools (NCES district)
- District
- Ann Arbor Public Schools
- NCES district ID
- 2602820
- Math proficiency
- 71% ▲ 5.00%
- Reading proficiency
- 81% ▲ 11.00%
- Median HH income
- $60,768
- Composite
- 65.34/100
- National rank
- #487
- State rank
- #6 of 540 in MI
Livability — Ann Arbor
- Score
- 88/100
- State rank
- #10
- US rank
- #155
Category grades
Schools grade is shown separately in the Schools card above.
Census & demographics
- Census place
- Ann Arbor, MI
- County
- Washtenaw County · 306,860 people
- City population
- 163,747
- Metro
- Ann Arbor, MI
- Population (ZIP)
- 27,666
- Household income
- $89,355
- Rent vs Own
- Severe rent burden
- 1390.0
Population outlook (Washtenaw County) Hauer SSP2
- Today (2025)
- 402,878 people
- By 2030
- 424,104 · +5.3%
- By 2040
- 464,633 · +15.3%
- By 2050
- 504,728 · +25.3%
- By 2075
- 614,463 · +52.5%
- By 2100
- 676,181 · +67.8%
Race, ethnicity, and origin ACS 2023
- Neighborhood character
- Diverse neighborhood (Simpson 0.62)
- Race & ethnicity
- White 58% Black 16% Asian 14% Two or more races 8% Hispanic / Latino 6%
- Hispanic origin (detail)
- Mexican 4%
- Common ancestry
- Romanian 5% Italian 2% Slovak 2%
- Foreign-born
- 23% · China, Canada, South Korea
- Languages at home
- 72% English-only · Arabic 5% Other Indo-European 5% Chinese 5%
Political lean MEDSL · Washtenaw
- 2024 margin
- Solid D (+44.4) · D 71.0% · R 26.6% · Other 2.4%
- 2008→2024 swing
- +3.5pp toward D · 2008: 41.0pp · 2024: 44.4pp
- All cycles
- 2024: D+44.4 2020: D+46.6 2016: D+41.5 2012: D+36.0 2008: D+41.0
Not yet ingested
- Civics
- —
Market trends
- HPI YoY
- ▼ -221.96%
- Current HPI
- 216.8067
- Rent YoY
- ▲ 5.72%
- Metro
- Ann Arbor, MI
- State GDP YoY
- ▲ 1.37%
- F500 in state
- 28
Industry mix (Fortune 500 HQ in MI)
| Industry | F500 HQs | Revenue |
|---|---|---|
| Automotive Parts | 3 | $48B |
|
||
| Automotive | 2 | $372B |
|
||
| Chemicals | 1 | $45B |
|
||
| Automotive Retail | 1 | $29B |
|
||
| Healthcare / Medical Devices | 1 | $23B |
|
||
| Automotive Technology | 1 | $20B |
|
||
Price history
+727.6% since first listed3 events — show timeline
- 2026-06-02 Coming Soon $240,000 MiRealSource-MiMLS
- 2026-06-02 Coming Soon $240,000 SW Michigan MLS
- 1988-08-01 Sold (Public Records) $29,000 Public Records
Property tax history
+1.9%/yrLatest (2025): $2,028 · -20.3% YoY. Source: county tax records.
Cash-flow waterfall
monthlySold comps — $/sqft
last 12 mo · ≤1 miLoading sold comps…