 16-Plex
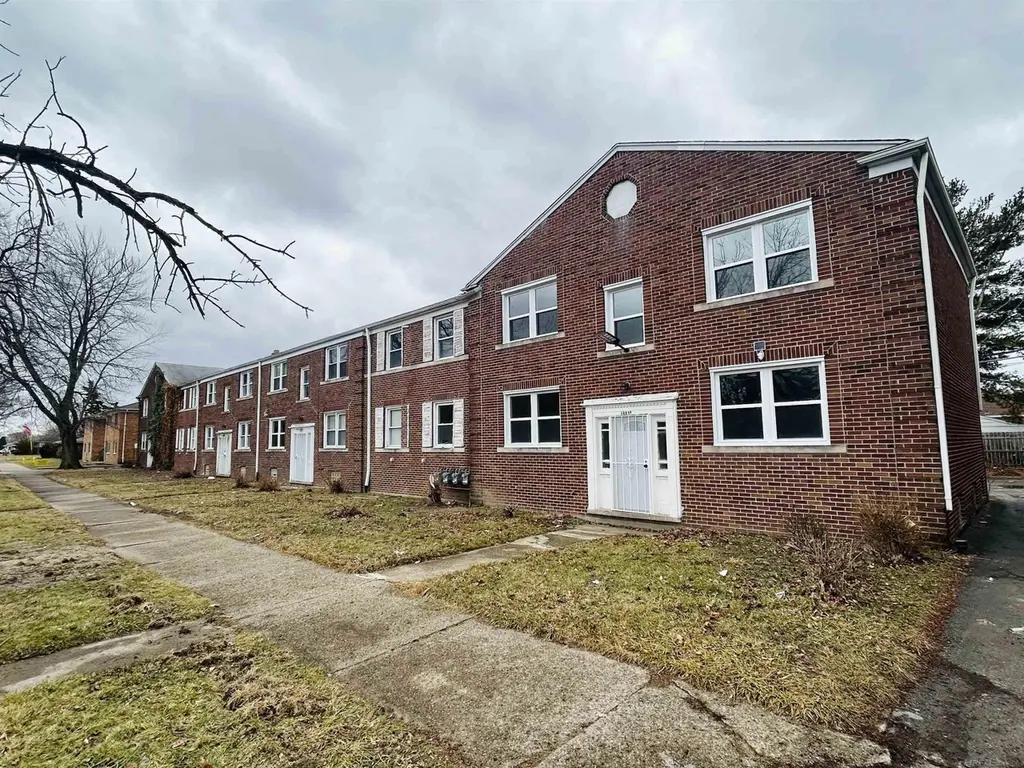
18059 Hoover St · Detroit, MI
Flood risk 3/10 · Minor
- FEMA flood zone
- X (unshaded)
- Chance of flooding over 30 yrs
- 0.1%
- Est. flood insurance / yr
- $473 – $860
Fire risk 1/10 · Minimal
- Est. fire insurance / yr
- $784 – $1,456
Heat risk 3/10 · Minor
- Hot days now (above 96°F)
- 7 days/yr
- Hot days in 30 yrs
- 15 days/yr
Wind risk 2/10 · Minimal
- Chance of severe wind over 30 yrs
- —
Air-quality risk 3/10 · Minor
- Unhealthy air days now
- 2 days/yr
- Unhealthy air days in 30 yrs
- 5 days/yr
Risk factors via First Street. Map © Google.
Why this score? — see what drove the C+ grade
The composite is a weighted blend of 9 inputs, each scored 0–100. Each bar is that input's sub-score; the figure is the points it added to the 100-point composite (weight × sub-score).
- Cash flow +30.0/30.0
- 1% rule +10.0/10.0
- DSCR +10.0/10.0
- ARV discount +3.8/15.0
- Livability +3.7/5.0
- Rent growth +2.8/5.0
- Condition / age +2.5/5.0
- Schools +1.3/10.0
- Appreciation +0.0/10.0
$1,000,000
🖨 Deal sheet 📄 Offer letter ✓ Due diligence
Multi-family units
County records classify this as Multi-Family (5+ Unit). Listing-text estimate: 16 units. confirmed
5+ unit building — per-unit beds/baths from public records are typically unavailable; the breakdown below (if shown) is an estimate from the listing text.
Listing remarks MLS
Calling all investors! 16-unit apartment complex featuring all one-bedroom, one-bath units. Extensively updated with new plumbing, updated electrical, newer windows, and brand-new furnaces. Half the units offer electric baseboard heat, while the others have individual furnaces. Tenants pay gas and electric, keeping operating costs low. Units have been renovated with updated kitchens and baths, new flooring, fresh paint, and stainless steel appliances. 90%+ occupied and generating a strong 12% cap rate. Property has completed Step 1 of the Pilot Program, with seller working toward full approval with two steps remaining. Don't miss this great investment opportunity!
Key facts
- Updated electrical
- Brand new furnaces
- Newer windows
Tags
Neighborhood map
What this means for you Summary
Snapshot
- This is a 16 × 1-bed/1-bath units multifamily listed at $1.00M.
Deal economics
- At list price, monthly cash flow is $6k ($76k/yr) — positive. Per door: $394/mo.
- The deal already cash-flows at list — no discount required.
- Meets the 1% rule at list price ($17k rent vs $1.00M).
- Recommended offer: $910k (9.0% below list) — sets the bar for market timing.
- Cap rate 13.9% vs local median 10.2% in Detroit — top-decile yield for the area; either an underpriced asset or a hidden risk that comps aren't pricing in. Stress-test before assuming the spread holds.
Location & tenants
- Location reads 73/100 on livability (#218 in MI) — a middle-class / working-renter tenant base. Strengths: amenities A+, commute A+, cost of living A+; Watch: schools F, crime F, employment F.
- Detroit Public Schools Community District (urban): math 10% / reading 24% proficiency, ranked #499 of 540 in MI (top 92%) — low school quality limits family demand, transient renter base, plan for 1-2y turnover; 90% free/reduced lunch — lower-income household profile, screen leases tightly.
- Market conditions: Rents rising (+1.3%/yr); 373 active listings in the ZIP; 40 comparable units currently listed for rent nearby; rentals at typical pace (median 25d on market — plan ~3-4 weeks tenant-placement turnaround); 40% of comp listings sitting > 30 days — soft ceiling on asking rent; lower-income renter base — watch delinquency; 2,639 units permitted in Wayne County in 2024 (1,216 in 5+ unit buildings).
- At $16,735/mo this rent would consume 515% of the median local household income ($39k/yr) (locally 2121% of renters already pay >50% of income on rent) — very limited rent-growth headroom before tenants either downsize or default.
Forward outlook
- Local home prices are declining (-3.0%/yr); year-one equity from $7k of loan paydown is wiped out by about $30k of value loss. Plan a longer hold.
- Wayne County population projected at -17% by 2050 — secular population decline; favor cash flow + early exit over multi-decade hold.
- At projected returns (-3.0% appreciation + 1.3% rent growth), your $280k cash investment doubles in ~5 years — after that, you're playing with house money.
Negotiation context
- It's been on market 118 days — a 9% lower offer ($910k) is reasonable based on typical stale-listing flexibility.
- 7 sale attempts since 5y ago with the ask held roughly flat each time — persistent listings suggest the price (not the market) is what's stuck; bring a comps-based counter.
- Current owner paid $380k; list at $1.00M implies a 163% gain — meaningful room to come down on a strong offer.
Risks & watch-outs
- Watch-outs: built in 1948 — expect roof / HVAC / electrical / plumbing capex.
Questions for the listing agent
- It's been on market 118 days. Have you received any prior offers? Is the seller open to a 9% concession, seller financing, or rate buy-down credit?
- Can we see the unit-by-unit rent roll, current vacancy, and any below-market leases? What's the average tenancy length?
- What capital expenditures (roof, boiler, parking lot, exteriors) have been made in the last 5 years, and what's planned in the next 2?
- Built in 1948 — when were the roof, HVAC, electrical panel, plumbing, and water heater last replaced?
- Why hasn't it sold? Are there any deal-killer items the seller is aware of (foundation, flood, title, zoning, code violations)?
- Is there a deadline driving the sale (1031 exchange, divorce, estate, relocation)? That informs how much negotiation room exists.
- Schools are F-rated, which usually means shorter tenancies and higher turnover. Who's the typical renter profile here, and what's been the actual vacancy rate?
- Crime grade is F in this area — have there been break-ins, vandalism, or insurance claims at this property in the last 3 years? What carrier currently insures it and at what premium?
- What's the average days-on-market for RENTAL listings here right now (not sales)? A rising rental-DOM trend means longer vacancies and softer asking-rent achievability than the comps imply.
- What's the recent tenant-quality profile in this submarket — average credit score on applications, eviction rate, late-payment / NSF rate, and stable-employment percentage? A property-management company in the area should have these aggregated.
- How much new apartment / multifamily construction is in the pipeline within 1–3 miles? Heavy new supply (>2% of stock underway) typically softens rents 12–24 months out; light construction supports rent growth.
Investment metrics
- 1% rule
- 1.67% ✓
- Cap rate
- 13.86%
- Cash-on-cash
- 27.04%
- DSCR
- 2.20
- GRM
- 5.0
CMA / ARV
- ARV (median comp)
- $923,272
- List price
- $1,000,000
- Delta
- 8.31%
- Verdict
- FAIR
- Comps
- 3 within 2.0 mi
Show comp detail 2 sales within ~0.75 mi
| Address | Dist | Beds/Ba | Sqft | Sold | Price | $/sf | Match |
|---|---|---|---|---|---|---|---|
| 17318 Waltham St | 0.56mi | 3/2.0 (+3) | 1,500 | 10mo | $86,000 | $57 | 33 |
| 19350 Hoover St | 0.62mi | 4/2.0 (+4) | 1,682 | 21mo | $48,000 | $29 | 21 |
Match score weights: distance 35% · size 25% · config 20% · recency 20%. Top-matched comps best support the ARV.
Projected returns pro-forma
-3.0% appreciation · 1.33% rent growth · sell at horizon
- IRR
- 19.1%
- Equity multiple
- 1.76×
- Total profit
- $212,428
- Equity at exit
- $149,103
- IRR
- 26.2%
- Equity multiple
- 3.12×
- Total profit
- $593,732
- Equity at exit
- $86,462
Cash invested: $280,000 (down + closing). Projections, not guarantees.
Landlord ↔ Tenant lean methodology
- Overall (STATE)
- 62 Landlord-Friendly
- State Michigan
- 62 Landlord-Friendly · EVEN
- County
- — inherits STATE
- City
- — inherits STATE
ZIP-level market 48205
- Home prices YoY
- -28.1%
- Rents YoY
- 1.3%
- Active inventory
- 373
- Price-to-rent
- 79.7×
Monthly cashflow live
- Estimated rent
- $16,735 high interval (Pro) →
- Mortgage (P&I)
- −$5,244
- Tax est. 1.5%
- −$1,250 /mo · $15,000/yr
- Insurance
- −$417
- HOA
- −$0
- Vacancy / Maint / Mgmt
- −$3,514
- Net cashflow
- $6,310
Break-even live
16-unit breakdown (identical units grouped — click to expand)
| Units | Beds | Baths | Est. rent |
|---|---|---|---|
| 16× units | 1 | 1 | $16,736 |
| #1 | 1 | 1 | $1,046 |
| #2 | 1 | 1 | $1,046 |
| #3 | 1 | 1 | $1,046 |
| #4 | 1 | 1 | $1,046 |
| #5 | 1 | 1 | $1,046 |
| #6 | 1 | 1 | $1,046 |
| #7 | 1 | 1 | $1,046 |
| #8 | 1 | 1 | $1,046 |
| #9 | 1 | 1 | $1,046 |
| #10 | 1 | 1 | $1,046 |
| #11 | 1 | 1 | $1,046 |
| #12 | 1 | 1 | $1,046 |
| #13 | 1 | 1 | $1,046 |
| #14 | 1 | 1 | $1,046 |
| #15 | 1 | 1 | $1,046 |
| #16 | 1 | 1 | $1,046 |
| Total (16 units) | $16,735 | ||
UW: 25.0% down · 7.5% · 30yr · 1.5% tax · 5.0% vac · 8.0% maint · 8.0% mgmt
Financing live
Cash to close
- Down payment
- $250,000
- Closing costs
- $30,000
- Reserves months
- —
- Total cash needed
- —
Loan-product check · same deal, 3 products live
Conventional
25% down · 7.5% · 30yr
- Down + closing
- —
- Monthly P&I
- —
- Monthly cashflow
- —
- DSCR
- —
- Eligible?
- —
Personal DTI + credit; lowest rate.
DSCR
20% down · 8.5% · 30yr
- Down + closing
- —
- Monthly P&I
- —
- Monthly cashflow
- —
- DSCR
- —
- Eligible?
- —
No personal income docs; deal must DSCR.
Hard money
10% down · 12.0% · 12mo
- Down + closing
- —
- Monthly P&I
- —
- Monthly cashflow
- —
- DSCR
- —
- Eligible?
- —
Short-term bridge; refi at stabilization.
Rent comps 40 comps
| Address | Beds | Baths | Sqft | Rent | $/sqft | DOM | Units | Dist |
|---|---|---|---|---|---|---|---|---|
| 11513 Greiner St Unit 11521 Greiner Detroit, MI | 2.0 | 1.0 | 942 | $1,050 | $1.11 | 43d | 1 | 0.04mi |
| 18457 Hoover St Unit 57 Detroit, MI | 2.0 | 1.0 | 1950 | $850 | $0.44 | 15d | 1 | 0.14mi |
| 11314 Greiner St Detroit, MI | 2.0 | 1.0 | — | $950 | — | 43d | 1 | 0.21mi |
| 18611 Runyon St Detroit, MI | 3.0 | 2.0 | — | $1,375 | — | 43d | 1 | 0.24mi |
| 17851 Strasburg St Detroit, MI | 3.0 | 1.0 | 1079 | $1,100 | $1.02 | 17d | 1 | 0.35mi |
| 12419 Greiner St Detroit, MI | 2.0 | 1.0 | — | $1,100 | — | 44d | 1 | 0.37mi |
| 18947 Runyon St Detroit, MI | 3.0 | 1.0 | 1614 | $1,100 | $0.68 | 43d | 1 | 0.38mi |
| 18667 Algonac St Detroit, MI | 1.0 | 1.0 | 680 | $1,999 | $2.94 | 17d | 1 | 0.39mi |
| 17241 Rowe St Detroit, MI | 3.0 | 1.5 | 1316 | $1,450 | $1.10 | 17d | 1 | 0.40mi |
| 17335 Teppert St Detroit, MI | 2.0 | 1.0 | — | $1,100 | — | 17d | 1 | 0.40mi |
| 18961 Teppert St Detroit, MI | 3.0 | 1.5 | 2015 | $1,250 | $0.62 | 12d | 1 | 0.42mi |
| 18951 Beland St Detroit, MI | 3.0 | 1.0 | — | $1,300 | — | 43d | 1 | 0.44mi |
| 18681 Barlow St Detroit, MI | 3.0 | 1.0 | 1041 | $1,400 | $1.34 | 24d | 1 | 0.53mi |
| 18955 Hamburg St Detroit, MI | 3.0 | 1.0 | — | $1,450 | — | 43d | 1 | 0.54mi |
| 18703 Waltham St Detroit, MI | 2.0 | 1.0 | 1000 | $1,100 | $1.10 | 43d | 1 | 0.60mi |
| 19335 Hoover St Detroit, MI | 2.0 | 1.0 | 620 | $1,099 | $1.77 | 43d | 1 | 0.61mi |
| 19335 Hoover St Detroit, MI | 2.0 | 1.0 | 620 | $1,099 | $1.77 | 17d | 1 | 0.61mi |
| 11700 Engleside St Detroit, MI | 3.0 | 1.0 | 1000 | $1,175 | $1.18 | 43d | 1 | 0.73mi |
| 11785 Nashville St Detroit, MI | 3.0 | 2.0 | 1360 | $1,450 | $1.07 | 3d | 1 | 0.76mi |
| 18624 Fairport St Detroit, MI | 3.0 | 1.0 | 874 | $1,450 | $1.66 | 22d | 1 | 0.77mi |
| 18624 Fairport St Unit NA Detroit, MI | 3.0 | 1.0 | 924 | $1,450 | $1.57 | 24d | 1 | 0.77mi |
| 18119 Joann St Detroit, MI | 2.0 | 1.0 | 800 | $1,100 | $1.38 | 24d | 1 | 0.77mi |
| 11760 Nashville St Detroit, MI | 3.0 | 1.0 | 1200 | $1,250 | $1.04 | 17d | 1 | 0.79mi |
| 11074 Kennebec St Detroit, MI | 3.0 | 1.0 | 1200 | $1,350 | $1.12 | 43d | 1 | 0.80mi |
| 13218 Greiner St Detroit, MI | 3.0 | 1.0 | 1162 | $1,195 | $1.03 | 18d | 1 | 0.83mi |
| 5150 E Outer Dr Detroit, MI | 2.0 | 1.0 | — | $1,100 | — | 17d | 1 | 0.86mi |
| 19143 Fairport St Detroit, MI | 3.0 | 1.0 | 1070 | $1,225 | $1.14 | 17d | 1 | 0.86mi |
| 11728 Minden St Detroit, MI | 3.0 | 1.0 | — | $1,525 | — | 3d | 1 | 0.92mi |
| 19785 Rowe St Detroit, MI | 3.0 | 1.0 | — | $1,200 | — | 43d | 1 | 0.92mi |
| 19587 Waltham St Detroit, MI | 3.0 | 1.0 | — | $1,050 | — | 43d | 1 | 0.94mi |
| 19419 Westphalia St Detroit, MI | 3.0 | 1.0 | 1293 | $1,325 | $1.02 | 17d | 1 | 0.94mi |
| 19419 Westphalia St Detroit, MI | 3.0 | 1.0 | — | $1,325 | — | 15d | 1 | 0.94mi |
| 5043 Outer Dr E Detroit, MI | 1.0–2.0 | 1.0 | — | $829 | — | 12d | 1 | 0.97mi |
| 12112 Christy St Unit 12110 Detroit, MI | 2.0 | 1.0 | 950 | $1,200 | $1.26 | 43d | 1 | 0.98mi |
| 12110 Christy St Detroit, MI | 2.0 | 1.5 | 950 | $1,200 | $1.26 | 17d | 1 | 0.98mi |
| 13503 E McNichols Rd Detroit, MI | 1.0 | 1.0 | 5400 | $900 | $0.17 | 22d | 1 | 0.99mi |
| 13503 E McNichols Rd Unit 7 Detroit, MI | 1.0 | 1.0 | 750 | $800 | $1.07 | 18d | 1 | 0.99mi |
| 13503 E McNichols Rd Apt 1 Detroit, MI | 1.0 | 1.0 | — | $800 | — | 43d | 1 | 0.99mi |
| 13503 E McNichols Rd Apt 1 Detroit, MI | 1.0 | 1.0 | — | $850 | — | 24d | 1 | 0.99mi |
| 8060 House St Detroit, MI | 3.0 | 1.5 | — | $1,350 | — | 43d | 1 | 1.02mi |
Listing history 29 events
-
2026-06-18days on market $1,000,000 Active 118 DOM
-
2026-06-17days on market $1,000,000 Active 117 DOM
-
2026-06-15days on market $1,000,000 Active 115 DOM
-
2026-06-13days on market $1,000,000 Active 113 DOM
-
2026-06-13days on market $1,000,000 Active 112 DOM
-
2026-06-09days on market $1,000,000 Active 109 DOM
-
2026-06-08days on market $1,000,000 Active 108 DOM
-
2026-06-07days on market $1,000,000 Active 107 DOM
-
2026-06-04days on market $1,000,000 Active 104 DOM
-
2026-06-03days on market $1,000,000 Active 103 DOM
-
2026-06-01days on market $1,000,000 Active 101 DOM
-
2026-05-31days on market $1,000,000 Active 100 DOM
-
2026-02-20$1,000,000 Active 672-char remark
Show marketing remark (678 chars)
Calling all investors! 16-unit apartment complex featuring all one-bedroom, one-bath units. Extensively updated with new plumbing, updated electrical, newer windows, and brand-new furnaces. Half the units offer electric baseboard heat, while the others have individual furnaces. Tenants pay gas and electric, keeping operating costs low. Units have been renovated with updated kitchens and baths, new flooring, fresh paint, and stainless steel appliances. 90%+ occupied and generating a strong 12% cap rate. Property has completed Step 1 of the Pilot Program, with seller working toward full approval with two steps remaining. Don’t miss this great investment opportunity!
-
2026-02-20$1,000,000 Active 678-char remark
Show marketing remark (678 chars)
Calling all investors! 16-unit apartment complex featuring all one-bedroom, one-bath units. Extensively updated with new plumbing, updated electrical, newer windows, and brand-new furnaces. Half the units offer electric baseboard heat, while the others have individual furnaces. Tenants pay gas and electric, keeping operating costs low. Units have been renovated with updated kitchens and baths, new flooring, fresh paint, and stainless steel appliances. 90%+ occupied and generating a strong 12% cap rate. Property has completed Step 1 of the Pilot Program, with seller working toward full approval with two steps remaining. Don’t miss this great investment opportunity!
-
2025-07-10soldstatus $380,000 Closed
-
2025-07-10soldstatus $380,000 Closed
-
2025-03-18status Pending
-
2025-03-18status Pending
-
2025-02-18historical Accepting Backup Offers
-
2025-02-18historical Active Under Contract
-
2025-01-13$499,900 Active
-
2025-01-13$499,900 Active
-
2022-02-18historical
-
2022-02-18historical
-
2021-12-31status Active
-
2021-12-23historical
-
2021-12-07$850,000 Active
-
2021-12-07$850,000 Active
-
2016-10-05soldstatus $645,000
ⓘ Source: listings_history table (triggers on properties + properties_extension) + one-shot
backfill from property_details.listing_events for pre-trigger history.
Climate risk First Street
- Flood 3/10 Moderate FEMA zone X (unshaded) · 10% chance over 30 yrs
- Wildfire 1/10 Low
- Heat 3/10 Moderate 7 d/yr ≥96°F today · 15 d/yr by 30 yrs out
- Wind 2/10 Low
- Air quality 3/10 Moderate 2 unhealthy d/yr today · 5 by 30 yrs out
Nearby sold comps map
Loading sold comps map…
Walkable amenities ~0.75 mi
Loading nearby amenities…
Taxation est. · year 1
- Rental income
- $200,820
- − Mortgage interest
- −$56,016
- − Property taxes
- −$15,000
- − Insurance
- −$5,000
- − Repairs & maintenance
- −$16,066
- − Management
- −$16,066
- − Depreciation
- −$29,091
- Taxable income
- $63,582
- Est. tax owed @ 24.0%
- −$15,260
- After-tax cash flow
- $60,459/yr
For passive investors: Depreciation is non-cash, so a rental often shows a tax loss while cash-flowing — sheltering income. Rental losses are passive: they offset passive income freely, and up to $25,000/yr can offset ordinary (W-2) income if you actively participate and your MAGI is under $100k (phasing out to $0 by $150k); unused losses carry forward. On sale, claimed depreciation is recaptured at up to 25%, and gains may owe capital-gains tax (a 1031 exchange can defer both). Figures are a year-1 estimate at your 24.0% rate — not tax advice; consult a CPA.
Schools (NCES district)
- District
- Detroit Public Schools Community District
- NCES district ID
- 2601103
- Math proficiency
- 10% ▼ -2.00%
- Reading proficiency
- 24% ▲ 6.00%
- Median HH income
- $25,815
- Composite
- 13.06/100
- National rank
- #9564
- State rank
- #499 of 540 in MI
Livability — Detroit
- Score
- 73/100
- State rank
- #218
- US rank
- #5427
Category grades
Schools grade is shown separately in the Schools card above.
Census & demographics
- Census place
- Detroit, MI
- County
- Wayne County · 1,562,939 people
- City population
- 572,865
- Metro
- Detroit-Warren-Dearborn, MI
- Population (ZIP)
- 34,187
- Household income
- $38,966
- Rent vs Own
- Severe rent burden
- 2121.0
Population outlook (Wayne County) Hauer SSP2
- Today (2025)
- 1,675,273 people
- By 2030
- 1,620,300 · -3.3%
- By 2040
- 1,502,341 · -10.3%
- By 2050
- 1,384,039 · -17.4%
- By 2075
- 1,124,592 · -32.9%
- By 2100
- 881,193 · -47.4%
Race, ethnicity, and origin ACS 2023
- Neighborhood character
- Predominantly Black (93%)
- Race & ethnicity
- Black 93% White 3% Two or more races 2%
- Foreign-born
- 1% · Canada
- Languages at home
- 98% English-only · Spanish 1%
Political lean MEDSL · Wayne
- 2024 margin
- Strong D (+29.0) · D 62.7% · R 33.7% · Other 3.6%
- 2008→2024 swing
- -20.5pp toward R · 2008: 49.5pp · 2024: 29.0pp
- All cycles
- 2024: D+29.0 2020: D+38.1 2016: D+37.3 2012: D+46.9 2008: D+49.5
Not yet ingested
- Civics
- —
Market trends
- HPI YoY
- ▼ -91.80%
- Current HPI
- 235.0926
- Rent YoY
- ▲ 1.33%
- Metro
- Detroit-Warren-Dearborn, MI
- State GDP YoY
- ▲ 1.37%
- F500 in state
- 28
Industry mix (Fortune 500 HQ in MI)
| Industry | F500 HQs | Revenue |
|---|---|---|
| Automotive Parts | 3 | $48B |
|
||
| Automotive | 2 | $372B |
|
||
| Chemicals | 1 | $45B |
|
||
| Automotive Retail | 1 | $29B |
|
||
| Healthcare / Medical Devices | 1 | $23B |
|
||
| Automotive Technology | 1 | $20B |
|
||
Price history
+55.0% since first listed17 events — show timeline
- 2026-02-20 Listed $1,000,000 REALCOMP
- 2026-02-20 Listed $1,000,000 MiRealSource-MiMLS
- 2025-07-10 Sold (MLS) $380,000 MiRealSource-MiMLS
- 2025-07-10 Sold (MLS) $380,000 REALCOMP
- 2025-03-18 Pending — MiRealSource-MiMLS
- 2025-03-18 Pending — REALCOMP
- 2025-02-18 Contingent — MiRealSource-MiMLS
- 2025-02-18 Contingent — REALCOMP
- 2025-01-13 Listed $499,900 REALCOMP
- 2025-01-13 Listed $499,900 MiRealSource-MiMLS
- 2022-02-18 Listing Removed — REALCOMP
- 2022-02-18 Listing Removed — MiRealSource-MiMLS
- 2021-12-31 Relisted — MiRealSource-MiMLS
- 2021-12-23 Listing Removed — MiRealSource-MiMLS
- 2021-12-07 Listed $850,000 MiRealSource-MiMLS
- 2021-12-07 Listed $850,000 REALCOMP
- 2016-10-05 Sold (Public Records) $645,000 Public Records
Cash-flow waterfall
monthlySold comps — $/sqft
last 12 mo · ≤1 miLoading sold comps…