 Duplex
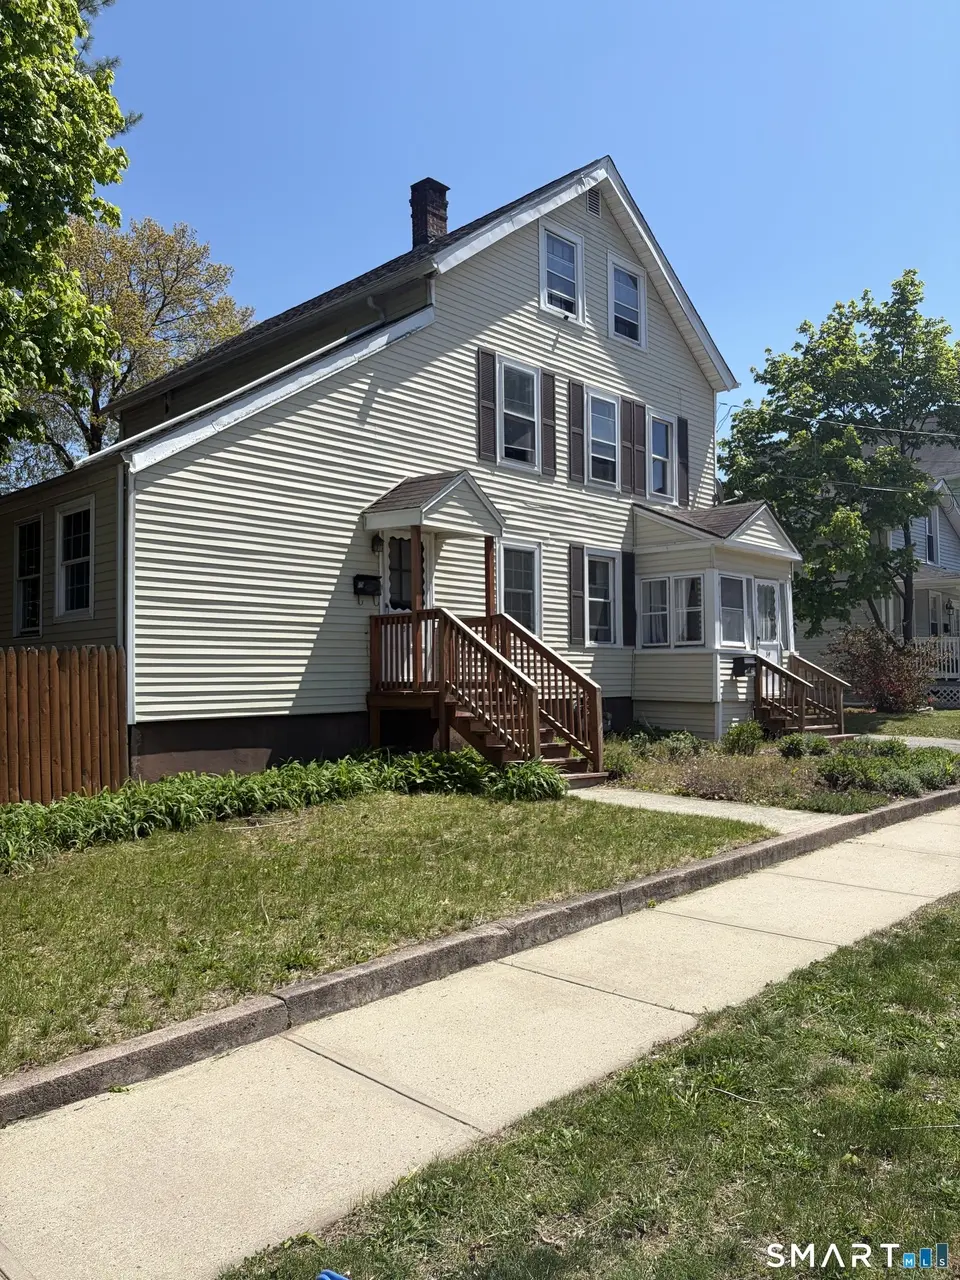
39 Webb St · New Haven, CT
Flood risk 1/10 · Minimal
- FEMA flood zone
- X (unshaded)
- Chance of flooding over 30 yrs
- 0.0%
- Est. flood insurance / yr
- $473 – $860
Fire risk 3/10 · Minor
- Est. fire insurance / yr
- $829 – $1,539
Heat risk 6/10 · Moderate
- Hot days now (above 99°F)
- 7 days/yr
- Hot days in 30 yrs
- 16 days/yr
Wind risk 6/10 · Moderate
- Chance of severe wind over 30 yrs
- 54.0%
Air-quality risk 5/10 · Moderate
- Unhealthy air days now
- 6 days/yr
- Unhealthy air days in 30 yrs
- 8 days/yr
Risk factors via First Street. Map © Google.
Why this score? — see what drove the C+ grade
The composite is a weighted blend of 9 inputs, each scored 0–100. Each bar is that input's sub-score; the figure is the points it added to the 100-point composite (weight × sub-score).
- Cash flow +24.2/30.0
- ARV discount +10.2/15.0
- DSCR +7.8/10.0
- 1% rule +7.1/10.0
- Livability +4.0/5.0
- Schools +3.3/10.0
- Rent growth +2.6/5.0
- Condition / age +2.5/5.0
- Appreciation +0.0/10.0
$350,000
🖨 Deal sheet 📄 Offer letter ✓ Due diligence
Multi-family units
County records classify this as Multi-Family (2-4 Unit). Listing-text estimate: 2 units. confirmed
Listing remarks
2-family investment property for sale in Hamden! Come put your own spin on this hgihly unique two family. Upgrades where it counts, electric panels have been upgraded with seperate owners meter, as well as new furnaces are being installed. Come put your own design on this centrally located 2 family!
Key facts
- 9,147 sq ft lot
- 2 garage spots
- Built 1925
Property features AI
Finance
- Financial info: Assessed value listed
Exterior
- Parking: Detached garage; 2-car garage
- Utilities: Public water connected; Public sewer connected
- Home design: Multi-family (2-family)
- Construction: Frame construction; Brick foundation; Asphalt shingle roof; Built as multi-family (living area per public record: 2076)
- Exterior features: Level lot; Vinyl siding
Interior
- Bedrooms: 4 bedrooms
- Bathrooms: 3 full bathrooms
- Heating & cooling: Hot air heat; Natural gas heating
- Interior features: 8 total rooms; Full basement; Walk-up attic
Neighborhood map
What this means for you Summary
Snapshot
- This is a 2 × 2-bed/1.5-bath units multifamily listed at $350k.
Deal economics
- At list price, monthly cash flow is $696 ($8k/yr) — positive. Per door: $348/mo.
- The deal already cash-flows at list — no discount required.
- Meets the 1% rule at list price ($4k rent vs $350k).
- Cap rate 8.7% vs local median 4.8% in New Haven — top-decile yield for the area; either an underpriced asset or a hidden risk that comps aren't pricing in. Stress-test before assuming the spread holds.
Location & tenants
- Location reads 79/100 on livability (#31 in CT, #2,190 nationally) — a middle-class / working-renter tenant base. Strengths: amenities A+, commute A+, health & safety A+; Watch: schools D+, employment D, crime F.
- Hamden School District (suburban): math 30% / reading 43% proficiency, ranked #106 of 153 in CT (top 69%) — families likely to look elsewhere, expect single-tenant / working-renter base with shorter leases.
- Market conditions: Rents flat; 84 active listings in the ZIP; 22 comparable units currently listed for rent nearby; rentals at typical pace (median 24d on market — plan ~3-4 weeks tenant-placement turnaround); 41% of comp listings sitting > 30 days — soft ceiling on asking rent; solid renter incomes; 1,059 units permitted in South Central Connecticut Planning Region in 2024 (779 in 5+ unit buildings).
- At $4,227/mo this rent would consume 49% of the median local household income ($105k/yr) (locally 531% of renters already pay >50% of income on rent) — very limited rent-growth headroom before tenants either downsize or default.
Forward outlook
- Local home prices are declining (-3.0%/yr); year-one equity from $2k of loan paydown is wiped out by about $10k of value loss. Plan a longer hold.
Negotiation context
- Only 3 days on market — expect competitive offers; lowballing is unlikely to land.
- Current owner paid $240k; 46% above their basis — modest negotiation headroom, anchor on the comps not their cost.
Risks & watch-outs
- Watch-outs: built in 1925 — expect roof / HVAC / electrical / plumbing capex.
- Climate carrying-cost: major wind risk, 54% chance of damaging wind over 30y; extreme-heat days projected 7→16/yr by 2055 (HVAC capex compounding) — expect insurance premiums to compound above CPI over the hold.
Questions for the listing agent
- Can we see the unit-by-unit rent roll, current vacancy, and any below-market leases? What's the average tenancy length?
- What capital expenditures (roof, boiler, parking lot, exteriors) have been made in the last 5 years, and what's planned in the next 2?
- Built in 1925 — when were the roof, HVAC, electrical panel, plumbing, and water heater last replaced?
- Is there a deadline driving the sale (1031 exchange, divorce, estate, relocation)? That informs how much negotiation room exists.
- Schools are D-rated, which usually means shorter tenancies and higher turnover. Who's the typical renter profile here, and what's been the actual vacancy rate?
- Crime grade is F in this area — have there been break-ins, vandalism, or insurance claims at this property in the last 3 years? What carrier currently insures it and at what premium?
- What's the average days-on-market for RENTAL listings here right now (not sales)? A rising rental-DOM trend means longer vacancies and softer asking-rent achievability than the comps imply.
- What's the recent tenant-quality profile in this submarket — average credit score on applications, eviction rate, late-payment / NSF rate, and stable-employment percentage? A property-management company in the area should have these aggregated.
- How much new apartment / multifamily construction is in the pipeline within 1–3 miles? Heavy new supply (>2% of stock underway) typically softens rents 12–24 months out; light construction supports rent growth.
Investment metrics
- 1% rule
- 1.21% ✓
- Cap rate
- 8.68%
- Cash-on-cash
- 8.52%
- DSCR
- 1.38
- GRM
- 6.9
CMA / ARV
- ARV (median comp)
- $372,477
- List price
- $350,000
- Delta
- -6.03%
- Verdict
- FAIR
- Comps
- 16 within 1.0 mi
Show comp detail 3 sales within ~0.75 mi
| Address | Dist | Beds/Ba | Sqft | Sold | Price | $/sf | Match |
|---|---|---|---|---|---|---|---|
| 30 Atlas St | 0.10mi | 3/2.0 (-1) | 1,890 (-9%) | 11mo | $330,000 | $175 | 66 |
| 1656 State St | 0.34mi | 4/2.0 | 1,928 (-7%) | 8mo | $440,000 | $228 | 66 |
| 1691 State St | 0.24mi | 5/2.0 (+1) | 2,229 (+7%) | 9mo | $400,000 | $179 | 64 |
Match score weights: distance 35% · size 25% · config 20% · recency 20%. Top-matched comps best support the ARV.
Projected returns pro-forma
-3.0% appreciation · 0.21% rent growth · sell at horizon
- IRR
- -6.8%
- Equity multiple
- 0.76×
- Total profit
- $-23,746
- Equity at exit
- $52,186
- IRR
- -1.3%
- Equity multiple
- 0.92×
- Total profit
- $-7,600
- Equity at exit
- $30,262
Cash invested: $98,000 (down + closing). Projections, not guarantees.
Landlord ↔ Tenant lean methodology
- Overall (STATE)
- 27 Tenant-Leaning
- State Connecticut
- 27 Tenant-Leaning · D+7
- County
- — inherits STATE
- City
- — inherits STATE
ZIP-level market 06517
- Rents YoY
- 0.2%
- Active inventory
- 84
- Price-to-rent
- 13.8×
Monthly cashflow live
- Estimated rent
- $4,227 high interval (Pro) →
- Mortgage (P&I)
- −$1,835
- Tax from tax record
- −$662 /mo · $7,948/yr
- Insurance
- −$146
- HOA
- −$0
- Vacancy / Maint / Mgmt
- −$888
- Net cashflow
- $696
Break-even live
2-unit breakdown (identical units grouped — click to expand)
| Units | Beds | Baths | Est. rent |
|---|---|---|---|
| 2× units | 2 | 1.5 | $4,226 |
| #1 | 2 | 1.5 | $2,113 |
| #2 | 2 | 1.5 | $2,113 |
| Total (2 units) | $4,227 | ||
UW: 25.0% down · 7.5% · 30yr · 1.5% tax · 5.0% vac · 8.0% maint · 8.0% mgmt
Financing live
Cash to close
- Down payment
- $87,500
- Closing costs
- $10,500
- Reserves months
- —
- Total cash needed
- —
Loan-product check · same deal, 3 products live
Conventional
25% down · 7.5% · 30yr
- Down + closing
- —
- Monthly P&I
- —
- Monthly cashflow
- —
- DSCR
- —
- Eligible?
- —
Personal DTI + credit; lowest rate.
DSCR
20% down · 8.5% · 30yr
- Down + closing
- —
- Monthly P&I
- —
- Monthly cashflow
- —
- DSCR
- —
- Eligible?
- —
No personal income docs; deal must DSCR.
Hard money
10% down · 12.0% · 12mo
- Down + closing
- —
- Monthly P&I
- —
- Monthly cashflow
- —
- DSCR
- —
- Eligible?
- —
Short-term bridge; refi at stabilization.
Rent comps 22 comps
| Address | Beds | Baths | Sqft | Rent | $/sqft | DOM | Units | Dist |
|---|---|---|---|---|---|---|---|---|
| 68 Anderson St Unit A New Haven, CT | 3.0 | 2.5 | 1693 | $4,500 | $2.66 | 43d | 1 | 0.80mi |
| 339 Willow St Unit 1 New Haven, CT | 4.0 | 2.0 | 2163 | $4,050 | $1.87 | 11d | 1 | 1.02mi |
| 199 English St Unit 2 New Haven, CT | 3.0 | 1.0 | 2776 | $2,000 | $0.72 | 43d | 1 | 1.05mi |
| 54 Mechanic St Unit 2nd floor New Haven, CT | 4.0 | 2.0 | 1412 | $3,600 | $2.55 | 43d | 1 | 1.10mi |
| 120 Downing St Unit 3 New Haven, CT | 3.0 | 2.0 | 1800 | $2,450 | $1.36 | 43d | 1 | 1.15mi |
| 420 Whitney Ave Unit 424-3B New Haven, CT | 4.0 | 3.0 | 1800 | $4,700 | $2.61 | 3d | 1 | 1.19mi |
| 420 Whitney Ave New Haven, CT | 3.0–4.0 | 2.0–3.0 | 1800 | $4,700 | $2.61 | 11d | 2 | 1.19mi |
| 28 Edwards St Unit 2 New Haven, CT | 4.0 | 2.0 | 1800 | $3,850 | $2.14 | 14d | 1 | 1.26mi |
| 426 Poplar St New Haven, CT | 3.0 | 1.0 | 1658 | $1,800 | $1.09 | 43d | 1 | 1.28mi |
| 426 Poplar St Unit 2 New Haven, CT | 4.0 | 2.0 | 1405 | $1,800 | $1.28 | 2d | 1 | 1.28mi |
| 53 Lilac Ave Hamden, CT | 3.0 | 1.5 | 1427 | $2,800 | $1.96 | 11d | 1 | 1.29mi |
| 233 Highland St New Haven, CT | 4.0 | 3.5 | 2200 | $3,950 | $1.80 | 43d | 1 | 1.30mi |
| 251 Edwards St Unit 2 New Haven, CT | 4.0 | 1.5 | 1522 | $3,900 | $2.56 | 3d | 1 | 1.30mi |
| 318 Front St Unit one New Haven, CT | 3.0 | 1.5 | 1400 | $3,100 | $2.21 | 21d | 1 | 1.33mi |
| 156 Putnam Ave Hamden, CT | 3.0 | 1.0 | 2304 | $1,800 | $0.78 | 2d | 1 | 1.35mi |
| 902 State St #2 New Haven, CT | 3.0 | 2.5 | 1950 | $3,750 | $1.92 | 23d | 1 | 1.38mi |
| 315 Humphrey St Unit A New Haven, CT | 4.0 | 3.5 | 2465 | $4,500 | $1.83 | 3d | 1 | 1.39mi |
| 300 Humphrey St Unit 2 New Haven, CT | 3.0 | 2.0 | 2868 | $3,295 | $1.15 | 43d | 1 | 1.42mi |
| 59 Clark St New Haven, CT | 4.0 | 1.0 | 1541 | $3,250 | $2.11 | 23d | 1 | 1.46mi |
| 31 Clark St New Haven, CT | 4.0 | 2.0 | 1694 | $4,200 | $2.48 | 3d | 1 | 1.46mi |
| 327 Newhall St New Haven, CT | 3.0 | 1.0 | 2742 | $1,950 | $0.71 | 43d | 1 | 1.46mi |
| 29 Lilac St New Haven, CT | 4.0 | 1.5 | 1600 | $2,650 | $1.66 | 43d | 1 | 1.47mi |
Listing history 6 events
-
2026-05-11status Under Contract 300-char remark
-
2026-05-09$350,000 Active 300-char remark
-
2026-05-06historical $350,000 300-char remark
-
2005-07-08soldstatus $239,900
-
2005-07-08soldstatus $239,900
-
2005-03-16soldstatus $145,000
ⓘ Source: listings_history table (triggers on properties + properties_extension) + one-shot
backfill from property_details.listing_events for pre-trigger history.
Tax reassessment forecast CT · Partial reset (capped growth)
- Current annual tax
- $7,948 · $662/mo
- Projected year-2 tax
- $7,948 · $662/mo
- Expected delta
- $0/yr ($0/mo · 0.0%)
ⓘ Screening estimate from a state-policy table — verify with the county assessor before closing.
Climate risk First Street
- Flood 1/10 Low FEMA zone X (unshaded) · 0% chance over 30 yrs
- Wildfire 3/10 Moderate
- Heat 6/10 Major 7 d/yr ≥99°F today · 16 d/yr by 30 yrs out
- Wind 6/10 Major 54% chance of damaging wind over 30 yrs
- Air quality 5/10 Major 6 unhealthy d/yr today · 8 by 30 yrs out
Nearby sold comps map
Loading sold comps map…
Walkable amenities ~0.75 mi
Loading nearby amenities…
Taxation est. · year 1
- Rental income
- $50,724
- − Mortgage interest
- −$19,605
- − Property taxes
- −$7,948
- − Insurance
- −$1,750
- − Repairs & maintenance
- −$4,058
- − Management
- −$4,058
- − Depreciation
- −$10,182
- Taxable income
- $3,123
- Est. tax owed @ 24.0%
- −$749
- After-tax cash flow
- $7,599/yr
For passive investors: Depreciation is non-cash, so a rental often shows a tax loss while cash-flowing — sheltering income. Rental losses are passive: they offset passive income freely, and up to $25,000/yr can offset ordinary (W-2) income if you actively participate and your MAGI is under $100k (phasing out to $0 by $150k); unused losses carry forward. On sale, claimed depreciation is recaptured at up to 25%, and gains may owe capital-gains tax (a 1031 exchange can defer both). Figures are a year-1 estimate at your 24.0% rate — not tax advice; consult a CPA.
Schools (NCES district)
- District
- Hamden School District
- NCES district ID
- 0901860
- Math proficiency
- 30% ▼ -13.00%
- Reading proficiency
- 43% ▼ -7.00%
- Median HH income
- $68,821
- Composite
- 33.34/100
- National rank
- #5490
- State rank
- #106 of 153 in CT
Livability — New Haven
- Score
- 79/100
- State rank
- #31
- US rank
- #2190
Category grades
Schools grade is shown separately in the Schools card above.
Census & demographics
- County
- New Haven County · 688,236 people
- City population
- 132,813
- Metro
- New Haven-Milford, CT
- Population (ZIP)
- 14,221
- Household income
- $104,550
- Rent vs Own
- Severe rent burden
- 531.0
Population outlook (South Central Connecticut County) Hauer SSP2
- By 2040
- 608,362
Race, ethnicity, and origin ACS 2023
- Neighborhood character
- Diverse neighborhood (Simpson 0.60)
- Race & ethnicity
- White 58% Black 19% Hispanic / Latino 17% Two or more races 7% Asian 2%
- Hispanic origin (detail)
- Puerto Rican 11% Dominican 2%
- Common ancestry
- Romanian 5% Scotch-Irish 2% Lithuanian 2%
- Foreign-born
- 12% · Canada, Jamaica, United Kingdom
- Languages at home
- 80% English-only · Spanish 12% French/Haitian/Cajun 2% Other Indo-European 1%
Political lean MEDSL · South Central Connecticut
- 2024 margin
- Strong D (+20.1) · D 59.0% · R 38.9% · Other 2.1%
- All cycles
- 2024: D+20.1
Not yet ingested
- Civics
- —
Market trends
- HPI YoY
- ▼ -204.00%
- Current HPI
- 255.2756
- Rent YoY
- ▲ 0.21%
- Metro
- New Haven-Milford, CT
- State GDP YoY
- ▲ 1.06%
- F500 in state
- 38
Industry mix (Fortune 500 HQ in CT)
| Industry | F500 HQs | Revenue |
|---|---|---|
| Industrial Machinery | 4 | $38B |
|
||
| Insurance | 3 | $71B |
|
||
| Financial Services | 2 | $25B |
|
||
| Transportation / Logistics | 2 | $18B |
|
||
| Healthcare | 1 | $247B |
|
||
| Telecommunications | 1 | $55B |
|
||
Price history
+141.4% since first listed6 events — show timeline
- 2026-05-11 Pending — Smart MLS
- 2026-05-09 Listed $350,000 Smart MLS
- 2026-05-06 Coming Soon $350,000 Smart MLS
- 2005-07-08 Sold (Public Records) $239,900 Public Records
- 2005-07-08 Sold (Public Records) $239,900 Public Records
- 2005-03-16 Sold (Public Records) $145,000 Public Records
Property tax history
+4.9%/yrLatest (2023): $7,948 · +1.6% YoY. Source: county tax records.
Cash-flow waterfall
monthlySold comps — $/sqft
last 12 mo · ≤1 miLoading sold comps…