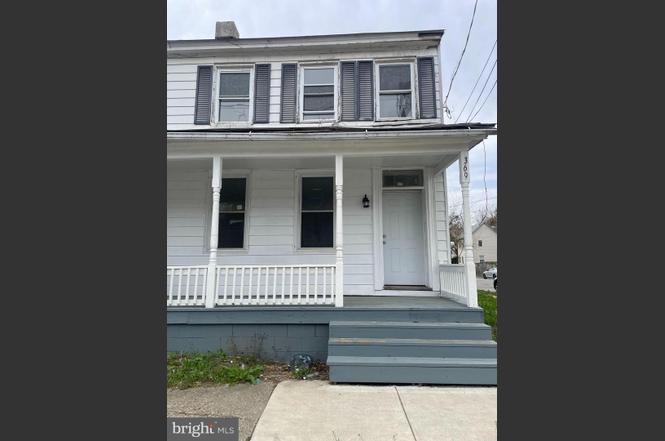
369 E Broadway · Salem, NJ
Flood risk 5/10 · Moderate
- FEMA flood zone
- X (unshaded)
- Chance of flooding over 30 yrs
- 0.42%
- Est. flood insurance / yr
- $507 – $1,088
Fire risk 2/10 · Minimal
- Est. fire insurance / yr
- $526 – $976
Heat risk 7/10 · Major
- Hot days now (above 102°F)
- 7 days/yr
- Hot days in 30 yrs
- 15 days/yr
Wind risk 6/10 · Moderate
- Chance of severe wind over 30 yrs
- 27.0%
Air-quality risk 3/10 · Minor
- Unhealthy air days now
- 2 days/yr
- Unhealthy air days in 30 yrs
- 4 days/yr
Risk factors via First Street. Map © Google.
Why this score? — see what drove the B+ grade
The composite is a weighted blend of 9 inputs, each scored 0–100. Each bar is that input's sub-score; the figure is the points it added to the 100-point composite (weight × sub-score).
- Cash flow +30.0/30.0
- ARV discount +15.0/15.0
- 1% rule +10.0/10.0
- DSCR +10.0/10.0
- Appreciation +4.8/10.0
- Livability +3.1/5.0
- Rent growth +2.5/5.0
- Condition / age +2.5/5.0
- Schools +1.2/10.0
$89,000
🖨 Deal sheet (PDF) 📄 Offer letter ✓ Due diligence
Listing remarks MLS
Half Double W/ Screened Front Porch And Rear Yard, 3 Bedroom, Rear Lot Also Included With This Property (30x50) W/ Linden St. Access Off Property. Being Sold "As Is" No Certs From Seller.
Key facts
- Strong foundation
- Built 1846
- Listed 167 days
Tags
Property features AI
Exterior
- Parking: On-street parking
- Utilities: Public water; Public sewer
- Home design: Semi-detached property; Fee simple ownership; 29 x 105 lot dimensions; Above-grade finished living area per assessor
- Construction: Brick/mortar foundation; Other structures above and below grade; Year built source: assessor
- Exterior features: Not in a federal flood zone; Municipal trash service
Interior
- Bedrooms: Three bedrooms on the first upper level
- Bathrooms: One full bathroom; One half bathroom
- Heating & cooling: Forced air heating; Oil-fired heating; Natural gas hot water
- Interior features: Daylight, full basement; Multiple access exits (2+)
Neighborhood map
What this means for you Summary
Snapshot
- This is a 3-bed/1.5-bath single-family listed at $89k.
Deal economics
- At list price, monthly cash flow is $612 ($7k/yr) — positive.
- The deal already cash-flows at list — no discount required.
- Meets the 1% rule at list price ($2k rent vs $89k).
- Recommended offer: $78k (12.0% below list) — sets the bar for market timing.
- Cap rate 14.6% vs local median 8.1% in Salem — top-decile yield for the area; either an underpriced asset or a hidden risk that comps aren't pricing in. Stress-test before assuming the spread holds.
Location & tenants
- Location reads 61/100 on livability (#462 in NJ) — a middle-class / working-renter tenant base. Strengths: cost of living A+, health & safety A+, crime B; Watch: amenities F, commute F, employment F.
- Salem City School District (town): math 6% / reading 24% proficiency, ranked #464 of 472 in NJ (top 98%) — low school quality limits family demand, transient renter base, plan for 1-2y turnover; 85% free/reduced lunch — lower-income household profile, screen leases tightly.
- Zoned schools: John Fenwick Academy (411 students, 77% FRL); Salem Middle School (math 2% / reading 21%, grade F, #423 of 431 statewide, top 98%, 487 students, 79% FRL); Salem High School (math 17% / reading 37%, grade F, #312 of 399 statewide, top 79%, 420 students, 52% FRL) — zoned schools average 69% FRL vs 85% district-wide (15 pts lower); this property's tenant base skews higher-income than the district average.
- Market conditions: 102 active listings in the ZIP; 9 comparable units currently listed for rent nearby; rentals leasing fast (median 0d on market — plan ~1-2 weeks tenant-placement turnaround); 95 units permitted in Salem County in 2024 (0 in 5+ unit buildings).
Forward outlook
- In year one you build about $277 of equity ($615 loan paydown + $-338 appreciation (-0.4% local appreciation)).
- Salem County population projected at -23% by 2050 — secular population decline; favor cash flow + early exit over multi-decade hold.
- At projected returns (-0.4% appreciation + 3.0% rent growth), your $25k cash investment doubles in ~4 years — after that, you're playing with house money.
Negotiation context
- It's been on market 167 days — a 12% lower offer ($78k) is reasonable based on typical stale-listing flexibility.
- 8 sale attempts since 27y ago; this cycle's ask has dropped $6k (6%) from the opening price — seller is motivated, your offer sets the floor, not the list.
- Current owner paid $65k; 37% above their basis — modest negotiation headroom, anchor on the comps not their cost.
Risks & watch-outs
- Watch-outs: property tax is 2.5% of price; built in 1846 — expect roof / HVAC / electrical / plumbing capex.
- Climate carrying-cost: moderate flood risk; major wind risk, 27% chance of damaging wind over 30y; extreme-heat days projected 7→15/yr by 2055 (HVAC capex compounding) — expect insurance premiums to compound above CPI over the hold.
Questions for the listing agent
- It's been on market 167 days. Have you received any prior offers? Is the seller open to a 12% concession, seller financing, or rate buy-down credit?
- Built in 1846 — when were the roof, HVAC, electrical panel, plumbing, and water heater last replaced?
- Property tax is high relative to price — has the assessment been appealed recently, and will the sale trigger a re-assessment?
- Why hasn't it sold? Are there any deal-killer items the seller is aware of (foundation, flood, title, zoning, code violations)?
- Is there a deadline driving the sale (1031 exchange, divorce, estate, relocation)? That informs how much negotiation room exists.
- Schools are D-rated, which usually means shorter tenancies and higher turnover. Who's the typical renter profile here, and what's been the actual vacancy rate?
- What's the average days-on-market for RENTAL listings here right now (not sales)? A rising rental-DOM trend means longer vacancies and softer asking-rent achievability than the comps imply.
- What's the recent tenant-quality profile in this submarket — average credit score on applications, eviction rate, late-payment / NSF rate, and stable-employment percentage? A property-management company in the area should have these aggregated.
- How much new for-sale + rental construction is in the pipeline within 1–3 miles? Heavy new supply typically softens prices + rents 12–24 months out; constrained supply supports both.
Investment metrics
- 1% rule
- 1.86% ✓
- Cap rate
- 14.55%
- Cash-on-cash
- 29.49%
- DSCR
- 2.31
- GRM
- 4.5
CMA / ARV
- ARV (on-the-fly)
- $166,944
- Comps found
- 10
Show comp detail 10 sales within ~0.75 mi
| Address | Dist | Beds/Ba | Sqft | Sold | Price | $/sf | Match |
|---|---|---|---|---|---|---|---|
| 14 Yorke St | 0.18mi | 3/1.5 | 1,197 (+6%) | 1mo | $161,000 | $135 | 80 |
| 22 Davis Ave | 0.16mi | 3/1.0 | 1,158 (+3%) | 7mo | $185,000 | $160 | 80 |
| 208 9th St | 0.32mi | 3/1.0 | 1,149 (+2%) | 1mo | $224,000 | $195 | 79 |
| 27 Davis Ave | 0.17mi | 3/1.0 | 1,008 (-11%) | 5mo | $189,000 | $188 | 68 |
| 318 Keasbey St | 0.18mi | 3/1.0 | 1,036 (-8%) | 14mo | $200,000 | $193 | 64 |
| 200 Smith St | 0.33mi | 3/1.5 | 1,212 (+7%) | 10mo | $140,000 | $116 | 64 |
| 28 Chestnut St | 0.55mi | 3/1.0 | 1,152 (+2%) | 10mo | $118,000 | $102 | 61 |
| 29 Ward St | 0.74mi | 3/2.0 | 1,112 (-1%) | 16mo | $165,000 | $148 | 47 |
| 308 Keasbey St | 0.22mi | 2/2.5 (-1) | 1,274 (+13%) | 21mo | $179,900 | $141 | 42 |
| 115 Chestnut St | 0.55mi | 3/3.5 | 1,282 (+14%) | 8mo | $185,000 | $144 | 37 |
Match score weights: distance 35% · size 25% · config 20% · recency 20%. Top-matched comps best support the ARV.
Projected returns pro-forma
-0.38% appreciation · 3.0% rent growth · sell at horizon
- IRR
- 29.3%
- Equity multiple
- 2.40×
- Total profit
- $34,899
- Equity at exit
- $24,164
- IRR
- 33.4%
- Equity multiple
- 4.65×
- Total profit
- $90,837
- Equity at exit
- $27,738
Cash invested: $24,920 (down + closing). Projections, not guarantees.
Landlord ↔ Tenant lean methodology
- Overall (STATE)
- 21 Tenant-Leaning
- State New Jersey
- 21 Tenant-Leaning · D+6
- County
- — inherits STATE
- City
- — inherits STATE
ZIP-level market 08079
- Home prices YoY
- -0.1%
- Active inventory
- 102
- Price-to-rent
- 4.5×
Monthly cashflow live
- Estimated rent
- $1,652 high interval (Pro) →
- Mortgage (P&I)
- −$467
- Tax from tax record
- −$189 /mo · $2,269/yr
- Insurance
- −$37
- HOA
- −$0
- Vacancy / Maint / Mgmt
- −$347
- Net cashflow
- $612
Break-even live
Sensitivity live
| Price | -10% $663 | -5% $638 | +0% $612 | +5% $587 | +10% $562 |
|---|---|---|---|---|---|
| Rent | -10% $482 | -5% $547 | +0% $612 | +5% $678 | +10% $743 |
| Rate | -1.0pp $657 | -0.5pp $635 | base $612 | +0.5pp $589 | +1.0pp $566 |
UW: 25.0% down · 7.5% · 30yr · 1.5% tax · 5.0% vac · 8.0% maint · 8.0% mgmt
Financing live
Cash to close
- Down payment
- $22,250
- Closing costs
- $2,670
- Reserves months
- —
- Total cash needed
- —
Loan-product check · same deal, 3 products live
Conventional
25% down · 7.5% · 30yr
- Down + closing
- —
- Monthly P&I
- —
- Monthly cashflow
- —
- DSCR
- —
- Eligible?
- —
Personal DTI + credit; lowest rate.
DSCR
20% down · 8.5% · 30yr
- Down + closing
- —
- Monthly P&I
- —
- Monthly cashflow
- —
- DSCR
- —
- Eligible?
- —
No personal income docs; deal must DSCR.
Hard money
10% down · 12.0% · 12mo
- Down + closing
- —
- Monthly P&I
- —
- Monthly cashflow
- —
- DSCR
- —
- Eligible?
- —
Short-term bridge; refi at stabilization.
Rent comps 9 comps
| Address | Beds | Baths | Sqft | Rent | $/sqft | DOM | Units | Dist |
|---|---|---|---|---|---|---|---|---|
| 380 E Broadway Salem, NJ | 2.0 | 1.0 | 1300 | $1,350 | $1.04 | 0d | 1 | 0.11mi |
| 56 Olive St Salem, NJ | 2.0 | 1.0 | 700 | $1,200 | $1.71 | 0d | 1 | 0.20mi |
| 218 Sinnickson St Salem, NJ | 2.0 | 1.0 | 1008 | $1,500 | $1.49 | 0d | 1 | 0.26mi |
| 1 9th St Salem, NJ | 2.0 | 1.0 | 900 | $1,450 | $1.61 | 0d | 1 | 0.28mi |
| 26 Walnut St Unit A Salem, NJ | 2.0 | 1.0 | 1000 | $1,225 | $1.23 | 0d | 1 | 0.34mi |
| 124 Yorke St Unit 2BR Salem, NJ | 2.0 | 1.0 | 750 | $1,400 | $1.87 | 12d | 1 | 0.58mi |
| 124 Yorke St Unit 37 Salem, NJ | 2.0 | 1.0 | 1220 | $1,350 | $1.11 | 4d | 1 | 0.58mi |
| 37 Eighth St Salem, NJ | 3.0 | 1.0 | 1092 | $1,850 | $1.69 | 0d | 1 | 0.66mi |
| 23 7th St Unit B Salem, NJ | 3.0 | 1.0 | 1000 | $1,450 | $1.45 | 5d | 1 | 0.71mi |
Listing history 42 events
-
2026-06-21days on market $89,000 Active 167 DOM
-
2026-06-18days on market $89,000 Active 164 DOM
-
2026-06-17days on market $89,000 Active 163 DOM
-
2026-06-16days on market $89,000 Active 162 DOM
-
2026-06-15days on market $89,000 Active 161 DOM
-
2026-06-13days on market $89,000 Active 159 DOM
-
2026-06-13days on market $89,000 Active 158 DOM
-
2026-06-09days on market $89,000 Active 155 DOM
-
2026-06-08days on market $89,000 Active 154 DOM
-
2026-06-07days on market $89,000 Active 153 DOM
-
2026-06-04days on market $89,000 Active 150 DOM
-
2026-06-03days on market $89,000 Active 149 DOM
-
2026-06-02days on market $89,000 Active 148 DOM
-
2026-06-01days on market $89,000 Active 147 DOM
-
2026-05-31days on market $89,000 Active 146 DOM
-
2026-05-18price $89,000
-
2026-05-18status Active
-
2026-05-15price $109,000
-
2026-05-15historical Active Under Contract
-
2026-05-14price $89,000
-
2026-05-14status Active
-
2026-04-24status Pending
-
2026-04-21historical Active Under Contract
-
2026-04-11price $109,000
-
2026-03-07price $140,000
-
2026-01-22price $160,000
-
2026-01-21status Active
-
2026-01-13historical
-
2025-12-01$95,000 Active
-
2022-02-18soldstatus $65,000
-
2021-12-30soldstatus $55,000
-
2004-07-29soldstatus $15,000 198-char remark
Show marketing remark (198 chars)
Half Double W/ Screened Front Porch And Rear Yard, 3 Bedroom, Rear Lot Also Included With This Property (30x50) W/ Linden St. Access Off Property. Being Sold "As Is" No Certs From Seller.
-
2004-07-29soldstatus $15,000
Show marketing remark (198 chars)
Half Double W/ Screened Front Porch And Rear Yard, 3 Bedroom, Rear Lot Also Included With This Property (30x50) W/ Linden St. Access Off Property. Being Sold "As Is" No Certs From Seller.
-
2004-06-17historical 198-char remark
Show marketing remark (198 chars)
Half Double W/ Screened Front Porch And Rear Yard, 3 Bedroom, Rear Lot Also Included With This Property (30x50) W/ Linden St. Access Off Property. Being Sold "As Is" No Certs From Seller.
-
2004-03-31$15,000 198-char remark
Show marketing remark (198 chars)
Half Double W/ Screened Front Porch And Rear Yard, 3 Bedroom, Rear Lot Also Included With This Property (30x50) W/ Linden St. Access Off Property. Being Sold "As Is" No Certs From Seller.
-
2004-03-25soldstatus $27,000 124-char remark
Show marketing remark (124 chars)
Large half double with yard, sold As-Is. Offers insulated windows, newer heater, fenced yard and more. No certs from seller.
-
2004-02-24historical 124-char remark
Show marketing remark (124 chars)
Large half double with yard, sold As-Is. Offers insulated windows, newer heater, fenced yard and more. No certs from seller.
-
2003-11-04$29,900 124-char remark
Show marketing remark (124 chars)
Large half double with yard, sold As-Is. Offers insulated windows, newer heater, fenced yard and more. No certs from seller.
-
2001-06-23historical
-
2000-06-23$55,000
-
2000-02-01historical
-
1999-02-01$55,000
ⓘ Source: listings_history table (triggers on properties + properties_extension) + one-shot
backfill from property_details.listing_events for pre-trigger history.
Tax reassessment forecast NJ · Partial reset (capped growth)
- Current annual tax
- $2,269 · $189/mo
- Projected year-2 tax
- $2,269 · $189/mo
- Expected delta
- $0/yr ($0/mo · 0.0%)
ⓘ Screening estimate from a state-policy table — verify with the county assessor before closing.
Climate risk First Street
- Flood 5/10 Major FEMA zone X (unshaded) · 42% chance over 30 yrs
- Wildfire 2/10 Low
- Heat 7/10 Severe 7 d/yr ≥102°F today · 15 d/yr by 30 yrs out
- Wind 6/10 Major 27% chance of damaging wind over 30 yrs
- Air quality 3/10 Moderate 2 unhealthy d/yr today · 4 by 30 yrs out
Nearby sold comps map
Loading sold comps map…
Walkable amenities ~0.75 mi
Loading nearby amenities…
Taxation est. · year 1
- Rental income
- $19,828
- − Mortgage interest
- −$4,985
- − Property taxes
- −$2,269
- − Insurance
- −$445
- − Repairs & maintenance
- −$1,586
- − Management
- −$1,586
- − Depreciation
- −$2,589
- Taxable income
- $6,367
- Est. tax owed @ 24.0%
- −$1,528
- After-tax cash flow
- $5,821/yr
For passive investors: Depreciation is non-cash, so a rental often shows a tax loss while cash-flowing — sheltering income. Rental losses are passive: they offset passive income freely, and up to $25,000/yr can offset ordinary (W-2) income if you actively participate and your MAGI is under $100k (phasing out to $0 by $150k); unused losses carry forward. On sale, claimed depreciation is recaptured at up to 25%, and gains may owe capital-gains tax (a 1031 exchange can defer both). Figures are a year-1 estimate at your 24.0% rate — not tax advice; consult a CPA.
Schools (NCES district)
- District
- Salem City School District
- NCES district ID
- 3414550
- Math proficiency
- 6% ▼ -1.00%
- Reading proficiency
- 24% ▲ 2.00%
- Median HH income
- $27,118
- Composite
- 11.51/100
- National rank
- #9702
- State rank
- #464 of 472 in NJ
Livability — Salem
- Score
- 61/100
- State rank
- #462
- US rank
- #17533
Category grades
Schools grade is shown separately in the Schools card above.
Census & demographics
- Census place
- Salem, NJ
- County
- Salem County · 24,175 people
- City population
- 10,762
- Metro
- Philadelphia-Camden-Wilmington, PA-NJ-DE-MD
- Population (ZIP)
- 10,762
- Household income
- $54,641
- Rent vs Own
- Severe rent burden
- 663.0
Population outlook (Salem County) Hauer SSP2
- Today (2025)
- 59,905 people
- By 2030
- 57,351 · -4.3%
- By 2040
- 51,837 · -13.5%
- By 2050
- 46,356 · -22.6%
- By 2075
- 36,452 · -39.2%
- By 2100
- 28,907 · -51.7%
Race, ethnicity, and origin ACS 2023
- Neighborhood character
- Diverse neighborhood (Simpson 0.55)
- Race & ethnicity
- White 59% Black 31% Hispanic / Latino 6% Two or more races 5% Asian 1%
- Hispanic origin (detail)
- Puerto Rican 5%
- Common ancestry
- Romanian 3% Lithuanian 2% Italian 1%
- Foreign-born
- 2% · Canada
- Languages at home
- 94% English-only · Spanish 4% Tagalog/Filipino 1%
Political lean MEDSL · Salem
- 2024 margin
- R (+19.2) · D 39.6% · R 58.8% · Other 1.6%
- 2008→2024 swing
- -23.1pp toward R · 2008: 3.9pp · 2024: -19.2pp
- All cycles
- 2024: R+19.2 2020: R+12.8 2016: R+15.4 2012: D+0.8 2008: D+3.9
Not yet ingested
- Civics
- —
Market trends
- HPI YoY
- ▼ -0.38%
- Current HPI
- 258.0047
- Rent YoY
- —
- Metro
- Philadelphia-Camden-Wilmington, PA-NJ-DE-MD
- State GDP YoY
- ▲ 2.05%
- F500 in state
- 34
Industry mix (Fortune 500 HQ in NJ)
| Industry | F500 HQs | Revenue |
|---|---|---|
| Consumer Goods | 3 | $31B |
|
||
| Pharmaceuticals | 2 | $153B |
|
||
| Technology | 2 | $21B |
|
||
| Insurance | 2 | $20B |
|
||
| Healthcare | 2 | $19B |
|
||
| Financial Services | 1 | $70B |
|
||
Price history
+61.8% since first listed27 events — show timeline
- 2026-05-18 Price Changed $89,000 BRIGHT MLS
- 2026-05-18 Relisted — BRIGHT MLS
- 2026-05-15 Price Changed $109,000 BRIGHT MLS
- 2026-05-15 Contingent — BRIGHT MLS
- 2026-05-14 Price Changed $89,000 BRIGHT MLS
- 2026-05-14 Relisted — BRIGHT MLS
- 2026-04-24 Pending — BRIGHT MLS
- 2026-04-21 Contingent — BRIGHT MLS
- 2026-04-11 Price Changed $109,000 BRIGHT MLS
- 2026-03-07 Price Changed $140,000 BRIGHT MLS
- 2026-01-22 Price Changed $160,000 BRIGHT MLS
- 2026-01-21 Relisted — BRIGHT MLS
- 2026-01-13 Listing Removed — BRIGHT MLS
- 2025-12-01 Listed $95,000 BRIGHT MLS
- 2022-02-18 Sold (Public Records) $65,000 Public Records
- 2021-12-30 Sold (Public Records) $55,000 Public Records
- 2004-07-29 Sold (Public Records) $15,000 Public Records
- 2004-07-29 Sold (MLS) $15,000 BRIGHT MLS
- 2004-06-17 Listing Removed — BRIGHT MLS
- 2004-03-31 Listed $15,000 BRIGHT MLS
- 2004-03-25 Sold (MLS) $27,000 SJSRMLS
- 2004-02-24 Listing Removed — SJSRMLS
- 2003-11-04 Listed $29,900 SJSRMLS
- 2001-06-23 Listing Removed — BRIGHT MLS
- 2000-06-23 Listed $55,000 BRIGHT MLS
- 2000-02-01 Listing Removed — BRIGHT MLS
- 1999-02-01 Listed $55,000 BRIGHT MLS
Property tax history
+0.9%/yrLatest (2025): $2,269 · +4.9% YoY. Source: county tax records.
Cash-flow waterfall
monthlySold comps — $/sqft
last 12 mo · ≤1 miLoading sold comps…