 🏷️ Likely Rental
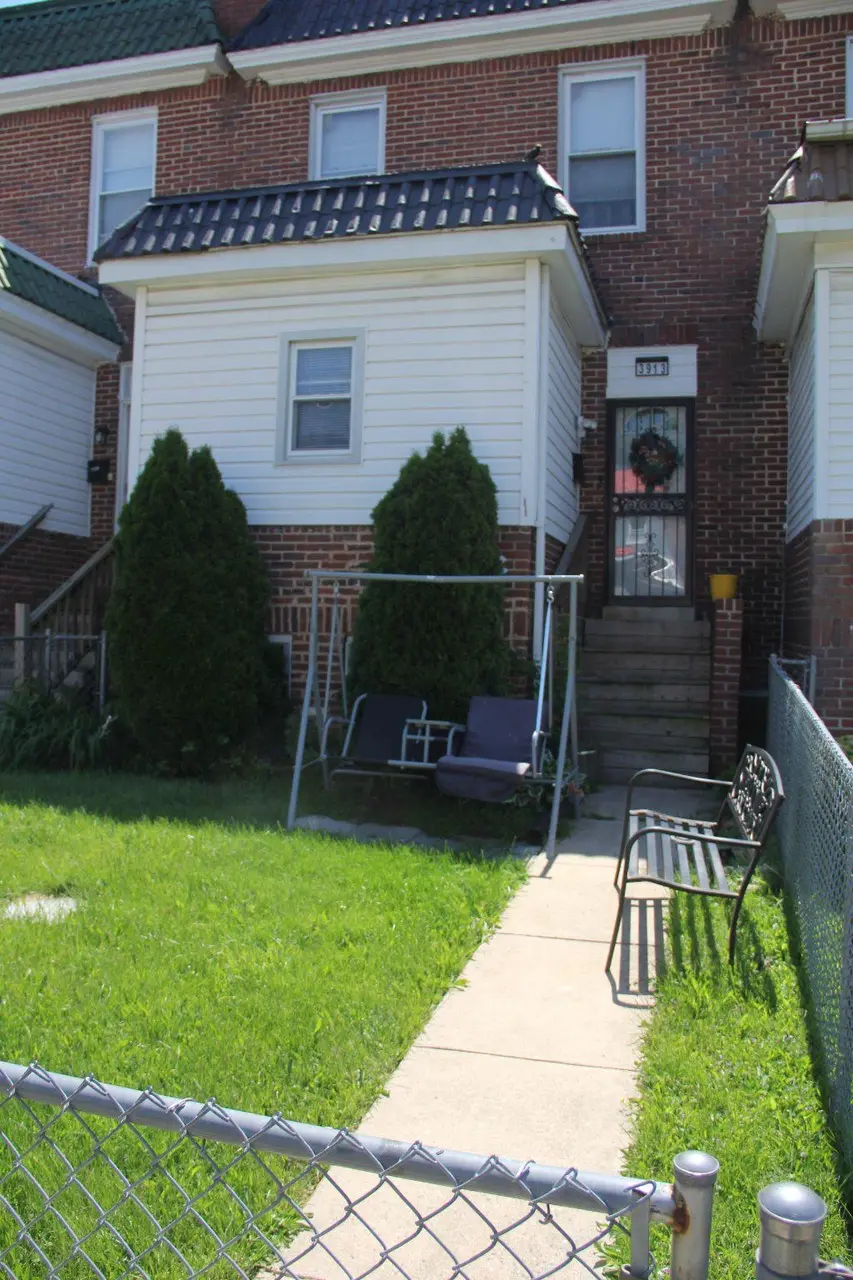
3913 W Garrison Ave · Baltimore, MD
Flood risk 1/10 · Minimal
- FEMA flood zone
- X (unshaded)
- Chance of flooding over 30 yrs
- 0.0%
- Est. flood insurance / yr
- $507 – $1,088
Fire risk 1/10 · Minimal
- Est. fire insurance / yr
- $755 – $1,403
Heat risk 7/10 · Major
- Hot days now (above 104°F)
- 7 days/yr
- Hot days in 30 yrs
- 15 days/yr
Wind risk 4/10 · Minor
- Chance of severe wind over 30 yrs
- 21.0%
Air-quality risk 3/10 · Minor
- Unhealthy air days now
- 3 days/yr
- Unhealthy air days in 30 yrs
- 4 days/yr
Risk factors via First Street. Map © Google.
Why this score? — see what drove the B+ grade
The composite is a weighted blend of 9 inputs, each scored 0–100. Each bar is that input's sub-score; the figure is the points it added to the 100-point composite (weight × sub-score).
- Cash flow +30.0/30.0
- ARV discount +15.0/15.0
- 1% rule +10.0/10.0
- DSCR +10.0/10.0
- Livability +3.8/5.0
- Rent growth +3.1/5.0
- Condition / age +2.5/5.0
- Schools +1.0/10.0
- Appreciation +0.0/10.0
$75,000
🖨 Deal sheet 📄 Offer letter ✓ Due diligence
Listing remarks
This charming 3-bedroom, 1-bathroom townhouse in the Garrison area offers a solid investment opportunity. The property features traditional brick and concrete construction, ensuring durability and low maintenance. The interior boasts a galley kitchen, seperate dining and living room areas, and a full basement, providing ample space for storage or potential rental conversion. Key appliances include a washer, dryer, refrigerator, and stove, enhancing tenant appeal. The property is in good condition, with carpet and ceramic tile flooring throughout. Outdoor features include a fenced front and rear yard, perfect for landscaping or outdoor activities. Located less than a mile from public trans
Key facts
- Built 1770
- Listed 28 days
Property features AI
Finance
- Other: Not located in a federal flood zone
- Financial info: Fee simple ownership; Property in good condition
- HOA & community: Ground rent paid annually
Exterior
- Parking: On-street parking
- Utilities: Public water; Public sewer; Natural gas available; Electric available; Municipal trash service
- Home design: Interior townhouse/rowhouse; Estimated year built
- Construction: Brick and concrete construction; Asphalt roof; Concrete perimeter foundation; Windows with screens; Building not winterized
- Exterior features: Front yard; Rear yard; Chain link fencing; Other exterior features
Interior
- Kitchen: Refrigerator; Stove
- Bedrooms: 3 bedrooms on main level
- Flooring: Carpet; Ceramic tile
- Bathrooms: 1 full bathroom on main level
- Heating & cooling: Forced air heating (natural gas); Central air conditioning (electric)
- Interior features: Tub shower; Ceiling fan(s); Dining area; Galley kitchen; Dry wall and plaster walls; Storm door
- Laundry & utility: Washer and dryer (laundry in basement); Electric water heater
Neighborhood map
What this means for you Summary
Snapshot
- This is a 3-bed/1.0-bath townhouse listed at $75k.
Deal economics
- At list price, monthly cash flow is $750 ($9k/yr) — positive.
- The deal already cash-flows at list — no discount required.
- Meets the 1% rule at list price ($2k rent vs $75k).
- Recommended offer: $74k (1.5% below list) — sets the bar for market timing.
- Cap rate 18.3% vs local median 6.0% in Baltimore — top-decile yield for the area; either an underpriced asset or a hidden risk that comps aren't pricing in. Stress-test before assuming the spread holds.
Location & tenants
- Location reads 76/100 on livability (#90 in MD, #3,396 nationally) — a middle-class / working-renter tenant base. Strengths: amenities A+, commute A+, housing A+; Watch: schools D, crime F.
- Baltimore City Public Schools (urban): math 7% / reading 16% proficiency, ranked #24 of 24 in MD (top 100%) — low school quality limits family demand, transient renter base, plan for 1-2y turnover; 79% free/reduced lunch — lower-income household profile, screen leases tightly.
- Market conditions: Rents rising (+2.4%/yr); 351 active listings in the ZIP; 40 comparable units currently listed for rent nearby; rentals at typical pace (median 24d on market — plan ~3-4 weeks tenant-placement turnaround); 48% of comp listings sitting > 30 days — soft ceiling on asking rent; 1,273 units permitted in Baltimore city in 2024 (1,104 in 5+ unit buildings).
- This rent runs 37% of the median local income ($52k/yr) — at the standard rent-burdened threshold; future hikes will face affordability resistance.
Forward outlook
- Local home prices are declining (-3.0%/yr); year-one equity from $519 of loan paydown is wiped out by about $2k of value loss. Plan a longer hold.
- Baltimore County population projected to shrink 4% by 2050 — rents likely to lag national; underwrite the cash flow, not the appreciation.
- At projected returns (-3.0% appreciation + 2.4% rent growth), your $21k cash investment doubles in ~3 years — after that, you're playing with house money.
Negotiation context
- It's been on market 29 days — a 2% lower offer ($74k) is reasonable based on typical stale-listing flexibility.
- 3 sale attempts since 24y ago with the ask held roughly flat each time — persistent listings suggest the price (not the market) is what's stuck; bring a comps-based counter.
- Current owner paid $17k; list at $75k implies a 354% gain — meaningful room to come down on a strong offer.
Risks & watch-outs
- Watch-outs: built in 1770 — expect roof / HVAC / electrical / plumbing capex.
- Climate carrying-cost: extreme-heat days projected 7→15/yr by 2055 (HVAC capex compounding) — expect insurance premiums to compound above CPI over the hold.
Questions for the listing agent
- Built in 1770 — when were the roof, HVAC, electrical panel, plumbing, and water heater last replaced?
- Is there a deadline driving the sale (1031 exchange, divorce, estate, relocation)? That informs how much negotiation room exists.
- Schools are D-rated, which usually means shorter tenancies and higher turnover. Who's the typical renter profile here, and what's been the actual vacancy rate?
- Crime grade is F in this area — have there been break-ins, vandalism, or insurance claims at this property in the last 3 years? What carrier currently insures it and at what premium?
- What's the average days-on-market for RENTAL listings here right now (not sales)? A rising rental-DOM trend means longer vacancies and softer asking-rent achievability than the comps imply.
- What's the recent tenant-quality profile in this submarket — average credit score on applications, eviction rate, late-payment / NSF rate, and stable-employment percentage? A property-management company in the area should have these aggregated.
- How much new for-sale + rental construction is in the pipeline within 1–3 miles? Heavy new supply typically softens prices + rents 12–24 months out; constrained supply supports both.
Investment metrics
- 1% rule
- 2.11% ✓
- Cap rate
- 18.29%
- Cash-on-cash
- 42.85%
- DSCR
- 2.91
- GRM
- 3.9
CMA / ARV
- ARV (on-the-fly)
- $134,400
- Comps found
- 12
Show comp detail 12 sales within ~0.75 mi
| Address | Dist | Beds/Ba | Sqft | Sold | Price | $/sf | Match |
|---|---|---|---|---|---|---|---|
| 3709 Columbus Dr | 0.43mi | 3/1.5 | 1,200 (0%) | 0mo | $133,900 | $112 | 78 |
| 3701 Columbus Dr | 0.46mi | 3/1.0 | 1,200 (0%) | 4mo | $108,000 | $90 | 75 |
| 3916 Hayward Ave | 0.33mi | 3/2.5 | 1,248 (+4%) | 3mo | $237,375 | $190 | 70 |
| 3716 Columbus Dr | 0.41mi | 4/2.0 (+1) | 1,200 (0%) | 3mo | $242,000 | $202 | 70 |
| 3824 Beehler Ave | 0.26mi | 3/1.5 | 1,080 (-10%) | 3mo | $88,000 | $81 | 67 |
| 5329 Cordelia Ave | 0.39mi | 3/1.0 | 1,080 (-10%) | 1mo | $105,000 | $97 | 64 |
| 4927 Edgemere Ave | 0.37mi | 2/1.0 (-1) | 1,080 (-10%) | 3mo | $95,000 | $88 | 59 |
| 3741 Boarman Ave | 0.61mi | 3/1.0 | 1,280 (+7%) | 3mo | $115,000 | $90 | 58 |
| 5422 Price Ave | 0.51mi | 3/1.5 | 1,080 (-10%) | 2mo | $140,000 | $130 | 56 |
| 4041 W Cold Spring Ln | 0.64mi | 3/2.5 | 1,310 (+9%) | 1mo | $239,900 | $183 | 48 |
| 5424 Jonquil Ave | 0.50mi | 4/3.5 (+1) | 1,332 (+11%) | 2mo | $200,000 | $150 | 42 |
| 5533 Nome Ave | 0.72mi | 2/2.0 (-1) | 1,085 (-10%) | 2mo | $110,500 | $102 | 40 |
Match score weights: distance 35% · size 25% · config 20% · recency 20%. Top-matched comps best support the ARV.
Projected returns pro-forma
-3.0% appreciation · 2.41% rent growth · sell at horizon
- IRR
- 39.0%
- Equity multiple
- 2.65×
- Total profit
- $34,689
- Equity at exit
- $11,183
- IRR
- 45.1%
- Equity multiple
- 5.19×
- Total profit
- $87,975
- Equity at exit
- $6,485
Cash invested: $21,000 (down + closing). Projections, not guarantees.
Landlord ↔ Tenant lean methodology
- Overall (CITY)
- 12 Strongly Tenant-Friendly
- State Maryland
- 27 Tenant-Leaning · D+14
- County
- — inherits STATE
- City Baltimore
- 12 Strongly Tenant-Friendly · D+58
ZIP-level market 21215
- Rents YoY
- 2.4%
- Active inventory
- 351
- Price-to-rent
- 3.9×
Monthly cashflow live
- Estimated rent
- $1,583 high interval (Pro) →
- Mortgage (P&I)
- −$393
- Tax from tax record
- −$76 /mo · $917/yr
- Insurance
- −$31
- HOA
- −$0
- Vacancy / Maint / Mgmt
- −$333
- Net cashflow
- $750
Break-even live
UW: 25.0% down · 7.5% · 30yr · 1.5% tax · 5.0% vac · 8.0% maint · 8.0% mgmt
Financing live
Cash to close
- Down payment
- $18,750
- Closing costs
- $2,250
- Reserves months
- —
- Total cash needed
- —
Loan-product check · same deal, 3 products live
Conventional
25% down · 7.5% · 30yr
- Down + closing
- —
- Monthly P&I
- —
- Monthly cashflow
- —
- DSCR
- —
- Eligible?
- —
Personal DTI + credit; lowest rate.
DSCR
20% down · 8.5% · 30yr
- Down + closing
- —
- Monthly P&I
- —
- Monthly cashflow
- —
- DSCR
- —
- Eligible?
- —
No personal income docs; deal must DSCR.
Hard money
10% down · 12.0% · 12mo
- Down + closing
- —
- Monthly P&I
- —
- Monthly cashflow
- —
- DSCR
- —
- Eligible?
- —
Short-term bridge; refi at stabilization.
Rent comps 40 comps
| Address | Beds | Baths | Sqft | Rent | $/sqft | DOM | Units | Dist |
|---|---|---|---|---|---|---|---|---|
| 5000 Litchfield Ave #1 Baltimore, MD | 2.0 | 1.0 | 1100 | $1,100 | $1.00 | 43d | 1 | 0.13mi |
| 3735 Manchester Ave Baltimore, MD | 2.0 | 1.0 | 1000 | $1,350 | $1.35 | 4d | 1 | 0.21mi |
| 4828 Beaufort Ave Baltimore, MD | 2.0 | 2.5 | 1200 | $1,850 | $1.54 | 23d | 1 | 0.24mi |
| 3784 Columbus Dr Baltimore, MD | 4.0 | 2.0 | 1250 | $2,200 | $1.76 | 23d | 1 | 0.28mi |
| 3904 Penhurst Ave Baltimore, MD | 2.0 | 1.0 | 760 | $1,175 | $1.55 | 43d | 1 | 0.29mi |
| 3908 Groveland Ave Apt F Baltimore, MD | 2.0 | 1.0 | 815 | $1,695 | $2.08 | 43d | 1 | 0.30mi |
| 5343 Nelson Ave Baltimore, MD | 2.0 | 1.0 | 1000 | $1,215 | $1.22 | 23d | 1 | 0.46mi |
| 4010 Fernhill Ave Unit 2 Baltimore, MD | 2.0 | 1.0 | 1100 | $1,500 | $1.36 | 43d | 1 | 0.49mi |
| 3016 Thorndale Ave Baltimore, MD | 1.0–3.0 | 1.0 | 700 | $1,200 | $1.71 | 4d | 14 | 0.58mi |
| 5301 Maple Ave Baltimore, MD | 3.0 | 1.0 | 960 | $1,700 | $1.77 | 43d | 1 | 0.60mi |
| 5340 Maple Ave Baltimore, MD | 2.0 | 1.0 | 1200 | $1,950 | $1.62 | 43d | 1 | 0.62mi |
| 5115 Pembridge Ave Baltimore, MD | 3.0 | 2.0 | 1088 | $2,150 | $1.98 | 43d | 1 | 0.76mi |
| 3912 Mortimer Ave Baltimore, MD | 3.0 | 2.0 | 1204 | $2,723 | $2.26 | 43d | 1 | 0.79mi |
| 4230 Towanda Ave Baltimore, MD | 3.0 | 2.0 | 1400 | $1,800 | $1.29 | 17d | 1 | 0.80mi |
| 3701 Garrison Blvd Unit 3 Baltimore, MD | 2.0 | 1.0 | 820 | $1,399 | $1.71 | 23d | 1 | 0.86mi |
| 2915 Oakford Ave Baltimore, MD | 3.0 | 2.0 | 1102 | $1,600 | $1.45 | 17d | 1 | 0.89mi |
| 3600 Garrison Blvd Apt T1 Baltimore, MD | 2.0 | 1.0 | 800 | $1,125 | $1.41 | 3d | 1 | 0.93mi |
| 3600 Garrison Blvd Unit T2 Baltimore, MD | 2.0 | 1.0 | 750 | $1,149 | $1.53 | 23d | 1 | 0.93mi |
| 2824 Edgecombe Cir S Baltimore, MD | 2.0 | 2.0 | 950 | $1,475 | $1.55 | 21d | 1 | 0.96mi |
| 4037 Edgewood Rd Unit 1 Baltimore, MD | 2.0 | 1.0 | 726 | $1,100 | $1.52 | 43d | 1 | 0.97mi |
| 2619 Loyola Northway Baltimore, MD | 3.0 | 2.0 | 1400 | $1,995 | $1.43 | 23d | 1 | 0.98mi |
| 3617 Mohawk Ave Baltimore, MD | 2.0 | 1.0 | 1000 | $1,595 | $1.59 | 43d | 1 | 1.01mi |
| 3615 Mohawk Ave Gwynn Oak, MD | 2.0 | 1.0 | 1000 | $1,610 | $1.61 | 43d | 1 | 1.01mi |
| 4008 Hilton Rd Unit 1st Fl Baltimore, MD | 2.0 | 1.0 | 750 | $1,295 | $1.73 | 43d | 1 | 1.01mi |
| 4910 Poe Ave Unit 2 Baltimore, MD | 2.0 | 1.0 | 750 | $990 | $1.32 | 23d | 1 | 1.01mi |
| 2454 W Cold Spring Ln Baltimore, MD | 3.0 | 1.0 | 1200 | $1,650 | $1.38 | 23d | 1 | 1.03mi |
| 3508 Grantley Rd Baltimore, MD | 2.0 | 1.0 | 1250 | $1,350 | $1.08 | 23d | 1 | 1.04mi |
| 3915 Liberty Heights Ave Gwynn Oak, MD | 1.0–2.0 | 1.0–2.0 | 680 | $1,345 | $1.98 | 12d | 5 | 1.09mi |
| 4936 Lanier Ave Baltimore, MD | 1.0–2.0 | 1.0 | 750 | $1,370 | $1.83 | 3d | 5 | 1.09mi |
| 3727 Milford Ave Gwynn Oak, MD | 3.0 | 1.0 | 900 | $1,450 | $1.61 | 43d | 1 | 1.09mi |
| 4714 Greenspring Ave Baltimore, MD | 2.0 | 1.0 | 890 | $1,295 | $1.46 | 43d | 1 | 1.09mi |
| 4016 N Rogers Ave Baltimore, MD | 2.0 | 1.0 | 717 | $1,195 | $1.67 | 43d | 1 | 1.11mi |
| 3601 Howard Park Ave Unit 2 Baltimore, MD | 3.0 | 1.0 | 1000 | $1,650 | $1.65 | 43d | 1 | 1.19mi |
| 2415 Loyola Southway Baltimore, MD | 3.0 | 1.5 | 1200 | $2,033 | $1.69 | 43d | 1 | 1.19mi |
| 2530 Edgecombe Cir N Baltimore, MD | 2.0–3.0 | 1.0 | 920 | $1,325 | $1.44 | 2d | 4 | 1.19mi |
| 5902 Cross Country Blvd Baltimore, MD | 1.0–2.0 | 1.0–2.0 | 785 | $1,699 | $2.16 | 4d | 6 | 1.26mi |
| 5902 Cross Country Blvd Baltimore, MD | 2.0 | 2.0 | 720 | $1,575 | $2.19 | 23d | 1 | 1.26mi |
| 2432 Everton Rd Unit 2435 A Baltimore, MD | 2.0 | 1.5 | 1000 | $1,500 | $1.50 | 23d | 1 | 1.27mi |
| 3822 Pall Mall Rd Baltimore, MD | 3.0 | 1.5 | 1320 | $1,875 | $1.42 | 43d | 1 | 1.29mi |
| 3807 Bowers Ave Gwynn Oak, MD | 3.0 | 1.5 | 1152 | $2,200 | $1.91 | 43d | 1 | 1.32mi |
Listing history 21 events
-
2026-06-18days on market $75,000 Active 29 DOM
-
2026-06-17days on market $75,000 Active 28 DOM
-
2026-06-16days on market $75,000 Active 27 DOM
-
2026-06-15days on market $75,000 Active 26 DOM
-
2026-06-13days on market $75,000 Active 24 DOM
-
2026-06-09days on market $75,000 Active 20 DOM
-
2026-06-08days on market $75,000 Active 19 DOM
-
2026-06-07days on market $75,000 Active 18 DOM
-
2026-06-04days on market $75,000 Active 15 DOM
-
2026-06-03days on market $75,000 Active 14 DOM
-
2026-06-02days on market $75,000 Active 13 DOM
-
2026-06-01days on market $75,000 Active 12 DOM
-
2026-05-31days on market $75,000 Active 11 DOM
-
2026-05-21$75,000 Active
-
2026-05-21historical $75,000
-
2003-10-15soldstatus $16,514
-
2003-08-24historical
-
2003-07-29$16,500
-
2002-07-23historical
-
2002-02-23
-
2000-08-29soldstatus $48,000
ⓘ Source: listings_history table (triggers on properties + properties_extension) + one-shot
backfill from property_details.listing_events for pre-trigger history.
Tax reassessment forecast MD · Partial reset (capped growth)
- Current annual tax
- $917 · $76/mo
- Projected year-2 tax
- $917 · $76/mo
- Expected delta
- $0/yr ($0/mo · 0.0%)
ⓘ Screening estimate from a state-policy table — verify with the county assessor before closing.
Climate risk First Street
- Flood 1/10 Low FEMA zone X (unshaded) · 0% chance over 30 yrs
- Wildfire 1/10 Low
- Heat 7/10 Severe 7 d/yr ≥104°F today · 15 d/yr by 30 yrs out
- Wind 4/10 Moderate 21% chance of damaging wind over 30 yrs
- Air quality 3/10 Moderate 3 unhealthy d/yr today · 4 by 30 yrs out
Nearby sold comps map
Loading sold comps map…
Walkable amenities ~0.75 mi
Loading nearby amenities…
Taxation est. · year 1
- Rental income
- $19,001
- − Mortgage interest
- −$4,201
- − Property taxes
- −$917
- − Insurance
- −$375
- − Repairs & maintenance
- −$1,520
- − Management
- −$1,520
- − Depreciation
- −$2,182
- Taxable income
- $8,286
- Est. tax owed @ 24.0%
- −$1,989
- After-tax cash flow
- $7,011/yr
For passive investors: Depreciation is non-cash, so a rental often shows a tax loss while cash-flowing — sheltering income. Rental losses are passive: they offset passive income freely, and up to $25,000/yr can offset ordinary (W-2) income if you actively participate and your MAGI is under $100k (phasing out to $0 by $150k); unused losses carry forward. On sale, claimed depreciation is recaptured at up to 25%, and gains may owe capital-gains tax (a 1031 exchange can defer both). Figures are a year-1 estimate at your 24.0% rate — not tax advice; consult a CPA.
Schools (NCES district)
- District
- Baltimore City Public Schools
- NCES district ID
- 2400090
- Math proficiency
- 7% ▼ -9.00%
- Reading proficiency
- 16% ▼ -5.00%
- Median HH income
- $42,108
- Composite
- 10.08/100
- National rank
- #9805
- State rank
- #24 of 24 in MD
Livability — Baltimore
- Score
- 76/100
- State rank
- #90
- US rank
- #3396
Category grades
Schools grade is shown separately in the Schools card above.
Census & demographics
- Census place
- Baltimore, MD
- County
- Baltimore City · 558,601 people
- City population
- 588,727
- Metro
- Baltimore-Columbia-Towson, MD
- Population (ZIP)
- 52,229
- Household income
- $51,587
- Rent vs Own
- Severe rent burden
- 3644.0
Population outlook (Baltimore County) Hauer SSP2
- Today (2025)
- 624,249 people
- By 2030
- 621,541 · -0.4%
- By 2040
- 609,756 · -2.3%
- By 2050
- 597,249 · -4.3%
- By 2075
- 552,236 · -11.5%
- By 2100
- 513,934 · -17.7%
Race, ethnicity, and origin ACS 2023
- Neighborhood character
- Predominantly Black (73%)
- Race & ethnicity
- Black 73% White 17% Hispanic / Latino 5% Two or more races 4% Asian 1%
- Common ancestry
- Scotch-Irish 2% Romanian 2% Italian 1%
- Foreign-born
- 9% · Canada, South Korea
- Languages at home
- 91% English-only · Spanish 4% French/Haitian/Cajun 1% Other Indo-European 1%
Political lean MEDSL · Baltimore
- 2024 margin
- Solid D (+73.0) · D 85.2% · R 12.2% · Other 2.6%
- 2008→2024 swing
- -2.5pp toward R · 2008: 75.5pp · 2024: 73.0pp
- All cycles
- 2024: D+73.0 2020: D+76.6 2016: D+74.6 2012: D+76.4 2008: D+75.5
Not yet ingested
- Civics
- —
Market trends
- HPI YoY
- ▼ -318.58%
- Current HPI
- 291.4926
- Rent YoY
- ▲ 2.41%
- Metro
- Baltimore-Columbia-Towson, MD
- State GDP YoY
- ▲ 2.97%
- F500 in state
- 12
Industry mix (Fortune 500 HQ in MD)
| Industry | F500 HQs | Revenue |
|---|---|---|
| Aerospace / Defense | 1 | $71B |
|
||
| Utilities | 1 | $25B |
|
||
| Hotels | 1 | $24B |
|
||
| Consumer Goods | 1 | $7B |
|
||
| Real Estate | 1 | $6B |
|
||
| Chemicals | 1 | $2B |
|
||
Price history
+56.2% since first listed8 events — show timeline
- 2026-05-21 Listed $75,000 BRIGHT MLS
- 2026-05-21 Coming Soon $75,000 BRIGHT MLS
- 2003-10-15 Sold (MLS) $16,514 MRIS
- 2003-08-24 Delisted — MRIS
- 2003-07-29 Listed $16,500 MRIS
- 2002-07-23 Delisted — MRIS
- 2002-02-23 Listed — MRIS
- 2000-08-29 Sold (Public Records) $48,000 Public Records
Property tax history
+5.6%/yrLatest (2025): $917 · +50.1% YoY. Source: county tax records.
Cash-flow waterfall
monthlySold comps — $/sqft
last 12 mo · ≤1 miLoading sold comps…