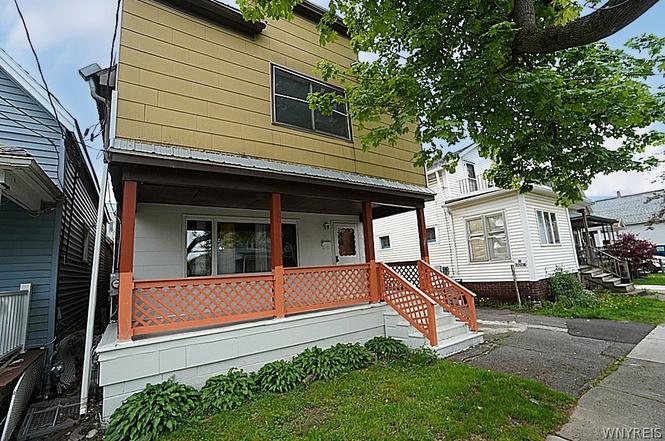
667 Fulton St · Buffalo, NY
Flood risk 7/10 · Major
- FEMA flood zone
- X (unshaded)
- Chance of flooding over 30 yrs
- 0.75%
- Est. flood insurance / yr
- $473 – $860
Fire risk 1/10 · Minimal
- Est. fire insurance / yr
- $691 – $1,283
Heat risk 3/10 · Minor
- Hot days now (above 92°F)
- 7 days/yr
- Hot days in 30 yrs
- 15 days/yr
Wind risk 1/10 · Minimal
- Chance of severe wind over 30 yrs
- —
Air-quality risk 3/10 · Minor
- Unhealthy air days now
- 2 days/yr
- Unhealthy air days in 30 yrs
- 3 days/yr
Risk factors via First Street. Map © Google.
Why this score? — see what drove the B+ grade
The composite is a weighted blend of 9 inputs, each scored 0–100. Each bar is that input's sub-score; the figure is the points it added to the 100-point composite (weight × sub-score).
- Cash flow +28.7/30.0
- DSCR +10.0/10.0
- Appreciation +10.0/10.0
- ARV discount +9.4/15.0
- 1% rule +6.6/10.0
- Rent growth +5.0/5.0
- Livability +3.9/5.0
- Schools +3.3/10.0
- Condition / age +2.5/5.0
$144,000
🖨 Deal sheet (PDF) 📄 Offer letter ✓ Due diligence
Listing remarks MLS
Large 5 bedroom home, close to Larkenville. Driveway to share with 665 Fulton. Exterior measured for accurate square footage. Great value for a large home .
Key facts
- Covered front porch
- Natural light
- Bonus room
Tags
Property features AI
Exterior
- Parking: No garage; Shared driveway
- Utilities: Cable available; Electricity connected (circuit breakers); Public water connected; Sewer connected
- Home design: Two-story house; Existing (previously built) property
- Construction: Wood siding; Metal roof; Block foundation
- Exterior features: Blacktop driveway; Concrete driveway; Fully fenced yard; Covered porch
Interior
- Kitchen: Electric oven; Electric range; Eat-in kitchen layout
- Bedrooms: Two main-level bedrooms; Additional bedrooms located on the second level (bedroom 3 and bedroom 4); Main-level bedrooms include Bedroom 1 and Bedroom 2
- Flooring: Carpet; Linoleum; Vinyl; Varies
- Bathrooms: One full bathroom on the main level
- Heating & cooling: Gas heating; Hot water heating
- Interior features: Ceiling fan(s); Separate/formal dining room; Entrance foyer; Eat-in kitchen; Separate/formal living room; Bedroom on main level; Full basement
- Laundry & utility: Gas water heater
Neighborhood map
What this means for you Summary
Snapshot
- This is a 2-bed/1.0-bath single-family listed at $144k.
Deal economics
- At list price, monthly cash flow is $424 ($5k/yr) — positive.
- The deal already cash-flows at list — no discount required.
- Meets the 1% rule at list price ($2k rent vs $144k).
- Cap rate 10.3% vs local median 8.0% in Buffalo — meaningfully above typical; check what's discounted (condition, days-on-market, listing class) to confirm the premium yield is real.
Location & tenants
- Location reads 77/100 on livability (#195 in NY, #3,011 nationally) — a middle-class / working-renter tenant base. Strengths: commute A+, housing A+, health & safety A+; Watch: crime F, employment D-.
- Buffalo City School District (urban): math 41% / reading 40% proficiency, ranked #535 of 590 in NY (top 91%) — families likely to look elsewhere, expect single-tenant / working-renter base with shorter leases; 75% free/reduced lunch — lower-income household profile, screen leases tightly.
- Market conditions: Rents rising fast (+12.7%/yr); 94 active listings in the ZIP; 8 comparable units currently listed for rent nearby; rentals leasing fast (median 12d on market — plan ~1-2 weeks tenant-placement turnaround); 1,244 units permitted in Erie County in 2024 (563 in 5+ unit buildings).
- This rent runs 37% of the median local income ($54k/yr) — at the standard rent-burdened threshold; future hikes will face affordability resistance.
Forward outlook
- In year one you build about $15k of equity ($996 loan paydown + $14k appreciation (10.0% local appreciation)).
- At projected returns (10.0% appreciation + 8.0% rent growth), your $40k cash investment doubles in ~2 years — after that, you're playing with house money.
- By year 3, paydown + projected appreciation supports a ~$39k cash-out refi (75% LTV) — recoverable capital for the next deal without selling this one.
Negotiation context
- Only 8 days on market — expect competitive offers; lowballing is unlikely to land.
- 4 sale attempts since 6y ago with the ask held roughly flat each time — persistent listings suggest the price (not the market) is what's stuck; bring a comps-based counter.
- Current owner paid $80k; list at $144k implies a 80% gain — meaningful room to come down on a strong offer.
Risks & watch-outs
- Watch-outs: flood insurance adds $56/mo; built in 1880 — expect roof / HVAC / electrical / plumbing capex.
- Climate carrying-cost: major flood risk — expect insurance premiums to compound above CPI over the hold.
Questions for the listing agent
- Built in 1880 — when were the roof, HVAC, electrical panel, plumbing, and water heater last replaced?
- What's the actual annual flood-insurance premium (NFIP or private), and is the property in a SFHA with mandatory coverage?
- Is there a deadline driving the sale (1031 exchange, divorce, estate, relocation)? That informs how much negotiation room exists.
- Crime grade is F in this area — have there been break-ins, vandalism, or insurance claims at this property in the last 3 years? What carrier currently insures it and at what premium?
- What's the average days-on-market for RENTAL listings here right now (not sales)? A rising rental-DOM trend means longer vacancies and softer asking-rent achievability than the comps imply.
- What's the recent tenant-quality profile in this submarket — average credit score on applications, eviction rate, late-payment / NSF rate, and stable-employment percentage? A property-management company in the area should have these aggregated.
- How much new for-sale + rental construction is in the pipeline within 1–3 miles? Heavy new supply typically softens prices + rents 12–24 months out; constrained supply supports both.
Investment metrics
- 1% rule
- 1.16% ✓
- Cap rate
- 10.29%
- Cash-on-cash
- 14.28%
- DSCR
- 1.64
- GRM
- 7.2
CMA / ARV
- ARV (on-the-fly)
- $150,328
- Comps found
- 5
Show comp detail 5 sales within ~0.75 mi
| Address | Dist | Beds/Ba | Sqft | Sold | Price | $/sf | Match |
|---|---|---|---|---|---|---|---|
| 823 Perry St | 0.08mi | 3/1.0 (+1) | 1,520 (-7%) | 9mo | $140,000 | $92 | 72 |
| 54 Clifford St | 0.24mi | 2/1.0 | 1,604 (-2%) | 22mo | $200,000 | $125 | 68 |
| 530 Fulton St | 0.26mi | 3/1.5 (+1) | 1,484 (-9%) | 18mo | $115,000 | $77 | 51 |
| 165 Smith St | 0.21mi | 3/1.0 (+1) | 1,391 (-15%) | 13mo | $90,000 | $65 | 50 |
| 595 S Division St | 0.72mi | 3/2.0 (+1) | 1,508 (-8%) | 22mo | $235,000 | $156 | 26 |
Match score weights: distance 35% · size 25% · config 20% · recency 20%. Top-matched comps best support the ARV.
Projected returns pro-forma
10.0% appreciation · 8.0% rent growth · sell at horizon
- IRR
- 35.8%
- Equity multiple
- 3.83×
- Total profit
- $114,252
- Equity at exit
- $129,727
- IRR
- 32.5%
- Equity multiple
- 9.36×
- Total profit
- $337,009
- Equity at exit
- $279,760
Cash invested: $40,320 (down + closing). Projections, not guarantees.
Landlord ↔ Tenant lean methodology
- Overall (STATE)
- 15 Strongly Tenant-Friendly
- State New York
- 15 Strongly Tenant-Friendly · D+10
- County
- — inherits STATE
- City
- — inherits STATE
ZIP-level market 14210
- Home prices YoY
- 13.8%
- Rents YoY
- 12.7%
- Active inventory
- 94
- Price-to-rent
- 7.2×
Monthly cashflow live
- Estimated rent
- $1,671 high interval (Pro) →
- Mortgage (P&I)
- −$755
- Tax from tax record
- −$25 /mo · $304/yr
- Insurance
- −$60
- Flood insurance flood zone
- −$56 /mo · $666/yr
- HOA
- −$0
- Vacancy / Maint / Mgmt
- −$351
- Net cashflow
- $424
Break-even live
Sensitivity live
| Price | -10% $506 | -5% $465 | +0% $424 | +5% $384 | +10% $170 |
|---|---|---|---|---|---|
| Rent | -10% $292 | -5% $358 | +0% $424 | +5% $490 | +10% $556 |
| Rate | -1.0pp $497 | -0.5pp $461 | base $424 | +0.5pp $387 | +1.0pp $349 |
UW: 25.0% down · 7.5% · 30yr · 1.5% tax · 5.0% vac · 8.0% maint · 8.0% mgmt
Financing live
Cash to close
- Down payment
- $36,000
- Closing costs
- $4,320
- Reserves months
- —
- Total cash needed
- —
Loan-product check · same deal, 3 products live
Conventional
25% down · 7.5% · 30yr
- Down + closing
- —
- Monthly P&I
- —
- Monthly cashflow
- —
- DSCR
- —
- Eligible?
- —
Personal DTI + credit; lowest rate.
DSCR
20% down · 8.5% · 30yr
- Down + closing
- —
- Monthly P&I
- —
- Monthly cashflow
- —
- DSCR
- —
- Eligible?
- —
No personal income docs; deal must DSCR.
Hard money
10% down · 12.0% · 12mo
- Down + closing
- —
- Monthly P&I
- —
- Monthly cashflow
- —
- DSCR
- —
- Eligible?
- —
Short-term bridge; refi at stabilization.
Rent comps 8 comps
| Address | Beds | Baths | Sqft | Rent | $/sqft | DOM | Units | Dist |
|---|---|---|---|---|---|---|---|---|
| 140 Seymour St Buffalo, NY | 1.0 | 1.0 | 1300 | $1,500 | $1.15 | 4d | 1 | 0.55mi |
| 140 Seymour St Unit First Floor Buffalo, NY | 2.0 | 1.0 | 1300 | $1,800 | $1.38 | 4d | 1 | 0.55mi |
| 140 Seymour St Buffalo, NY | 2.0 | 1.0 | 1300 | $1,800 | $1.38 | 24d | 1 | 0.55mi |
| 225 Louisiana St Buffalo, NY | 1.0–3.0 | 1.0–2.0 | 1164 | $2,194 | $1.88 | 2d | 7 | 0.94mi |
| 700 Hopkins St Buffalo, NY | 3.0 | 1.0 | 1100 | $1,225 | $1.11 | 15d | 1 | 1.12mi |
| 230 Scott St Buffalo, NY | 1.0–2.0 | 1.0–2.0 | 1285 | $2,325 | $1.81 | 2d | 4 | 1.13mi |
| 149 Swan St #404 Buffalo, NY | 2.0 | 2.0 | 1237 | $2,050 | $1.66 | 12d | 1 | 1.42mi |
| 149 Swan St #404 Buffalo, NY | 2.0 | 2.0 | 1237 | $2,100 | $1.70 | 24d | 1 | 1.42mi |
Listing history 7 events
-
2026-06-18days on market $144,000 Active 8 DOM
-
2026-06-17days on market $144,000 Active 7 DOM
-
2026-06-16days on market $144,000 Active 6 DOM
-
2026-06-15days on market $144,000 Active 5 DOM
-
2026-06-13days on market $144,000 Active 3 DOM
-
2026-06-13remarks 699-char remark
-
2026-06-13$144,000 Active 2 DOM
ⓘ Source: listings_history table (triggers on properties + properties_extension) + one-shot
backfill from property_details.listing_events for pre-trigger history.
Tax reassessment forecast NY · Partial reset (capped growth)
- Current annual tax
- $304 · $25/mo
- Projected year-2 tax
- $1,369 · $114/mo
- Expected delta
- +$1,065/yr (+$89/mo · 350.5%)
ⓘ Screening estimate from a state-policy table — verify with the county assessor before closing.
Climate risk First Street
- Flood 7/10 Severe FEMA zone X (unshaded) · 75% chance over 30 yrs
- Wildfire 1/10 Low
- Heat 3/10 Moderate 7 d/yr ≥92°F today · 15 d/yr by 30 yrs out
- Wind 1/10 Low
- Air quality 3/10 Moderate 2 unhealthy d/yr today · 3 by 30 yrs out
Nearby sold comps map
Loading sold comps map…
Walkable amenities ~0.75 mi
Loading nearby amenities…
Taxation est. · year 1
- Rental income
- $20,056
- − Mortgage interest
- −$8,066
- − Property taxes
- −$304
- − Insurance
- −$1,386
- − Repairs & maintenance
- −$1,605
- − Management
- −$1,605
- − Depreciation
- −$4,189
- Taxable income
- $2,902
- Est. tax owed @ 24.0%
- −$696
- After-tax cash flow
- $4,396/yr
For passive investors: Depreciation is non-cash, so a rental often shows a tax loss while cash-flowing — sheltering income. Rental losses are passive: they offset passive income freely, and up to $25,000/yr can offset ordinary (W-2) income if you actively participate and your MAGI is under $100k (phasing out to $0 by $150k); unused losses carry forward. On sale, claimed depreciation is recaptured at up to 25%, and gains may owe capital-gains tax (a 1031 exchange can defer both). Figures are a year-1 estimate at your 24.0% rate — not tax advice; consult a CPA.
Schools (NCES district)
- District
- Buffalo City School District
- NCES district ID
- 3605850
- Math proficiency
- 41% ▲ 11.00%
- Reading proficiency
- 40% ▲ 7.00%
- Median HH income
- $31,665
- Composite
- 33.17/100
- National rank
- #5544
- State rank
- #535 of 590 in NY
Livability — Buffalo
- Score
- 77/100
- State rank
- #195
- US rank
- #3011
Category grades
Schools grade is shown separately in the Schools card above.
Census & demographics
- Census place
- Buffalo, NY
- County
- Erie County · 714,559 people
- City population
- 440,021
- Metro
- Buffalo-Cheektowaga, NY
- Population (ZIP)
- 15,563
- Household income
- $54,197
- Rent vs Own
- Severe rent burden
- 959.0
Population outlook (Erie County) Hauer SSP2
- Today (2025)
- 933,037 people
- By 2030
- 935,181 · +0.2%
- By 2040
- 928,531 · -0.5%
- By 2050
- 905,725 · -2.9%
- By 2075
- 834,037 · -10.6%
- By 2100
- 708,033 · -24.1%
Race, ethnicity, and origin ACS 2023
- Neighborhood character
- Predominantly White (79%)
- Race & ethnicity
- White 79% Two or more races 8% Black 8% Hispanic / Latino 7% Asian 1%
- Hispanic origin (detail)
- Puerto Rican 6%
- Common ancestry
- Romanian 21% Lithuanian 2% Serbian 1%
- Foreign-born
- 2% · Canada, China
- Languages at home
- 95% English-only · Spanish 2% Arabic 1% Other Indo-European 1%
Political lean MEDSL · Erie
- 2024 margin
- Lean D (+9.7) · D 54.8% · R 45.2%
- 2008→2024 swing
- -7.9pp toward R · 2008: 17.5pp · 2024: 9.7pp
- All cycles
- 2024: D+9.7 2020: D+14.7 2016: D+4.8 2012: D+15.6 2008: D+17.5
Not yet ingested
- Civics
- —
Market trends
- HPI YoY
- ▲ 52.34%
- Current HPI
- 431.7951
- Rent YoY
- ▲ 12.67%
- Metro
- Buffalo-Cheektowaga, NY
- State GDP YoY
- ▲ 2.60%
- F500 in state
- 92
Industry mix (Fortune 500 HQ in NY)
| Industry | F500 HQs | Revenue |
|---|---|---|
| Financial Services | 10 | $950B |
|
||
| Consumer Goods | 9 | $162B |
|
||
| Insurance | 4 | $225B |
|
||
| Telecommunications | 2 | $144B |
|
||
| Pharmaceuticals | 2 | $112B |
|
||
| Media / Entertainment | 2 | $69B |
|
||
Price history
+80.2% since first listed13 events — show timeline
- 2026-06-10 Listed $144,000 WNYREIS
- 2022-10-23 Listing Removed — WNYREIS
- 2022-10-04 Listed $134,900 WNYREIS
- 2022-01-13 Sold (Public Records) $80,000 Public Records
- 2022-01-11 Sold (MLS) $80,000 WNYREIS
- 2021-11-29 Pending — WNYREIS
- 2021-11-17 Price Changed $88,500 WNYREIS
- 2021-10-27 Price Changed $92,899 WNYREIS
- 2021-10-17 Listed $92,900 WNYREIS
- 2020-12-11 Sold (Public Records) $62,000 Public Records
- 2020-12-04 Sold (MLS) $62,000 WNYREIS
- 2020-09-24 Pending — WNYREIS
- 2020-09-04 Listed $79,900 WNYREIS
Property tax history
+15.2%/yrLatest (2025): $304 · +29.1% YoY. Source: county tax records.
Cash-flow waterfall
monthlySold comps — $/sqft
last 12 mo · ≤1 miLoading sold comps…