 Fourplex
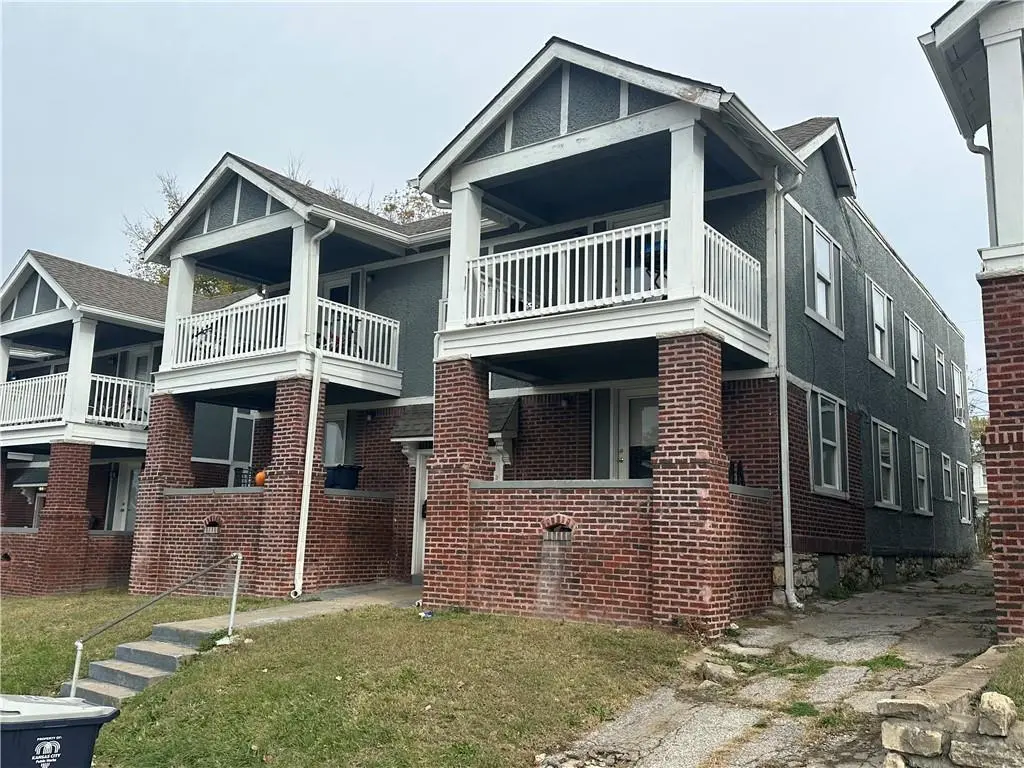
3315 Indiana Ave · Kansas City, MO
Flood risk 1/10 · Minimal
- FEMA flood zone
- X (unshaded)
- Chance of flooding over 30 yrs
- 0.0%
- Est. flood insurance / yr
- $473 – $860
Fire risk 1/10 · Minimal
- Est. fire insurance / yr
- $1,054 – $1,958
Heat risk 4/10 · Minor
- Hot days now (above 107°F)
- 7 days/yr
- Hot days in 30 yrs
- 17 days/yr
Wind risk 2/10 · Minimal
- Chance of severe wind over 30 yrs
- —
Air-quality risk 3/10 · Minor
- Unhealthy air days now
- 2 days/yr
- Unhealthy air days in 30 yrs
- 3 days/yr
Risk factors via First Street. Map © Google.
Why this score? — see what drove the B grade
The composite is a weighted blend of 9 inputs, each scored 0–100. Each bar is that input's sub-score; the figure is the points it added to the 100-point composite (weight × sub-score).
- Cash flow +30.0/30.0
- 1% rule +10.0/10.0
- DSCR +10.0/10.0
- Appreciation +10.0/10.0
- Livability +3.9/5.0
- Rent growth +3.7/5.0
- ARV discount +2.5/15.0
- Condition / age +2.5/5.0
- Schools +1.5/10.0
$315,000
🖨 Deal sheet 📄 Offer letter ✓ Due diligence
Multi-family units
County records classify this as Multi-Family (2-4 Unit). Listing-text estimate: 4 units. confirmed
Listing remarks MLS
Excellent investment opportunity in the heart of Kansas City. 4 units, all are 3 bed, 1 bath. All have been recently renovated. All electric building. Owner only pays for water. $4,450 in total monthly income. One of the units just went vacant. Seller willing to offer $10k in concessions to get it rent ready again. Selling as is.
Key facts
- Recently renovated
- 5,468 sq ft lot
- Built 1937
Tags
Neighborhood map
What this means for you Summary
Snapshot
- This is a 4 × 3-bed/1-bath units multifamily listed at $315k.
Deal economics
- At list price, monthly cash flow is $2k ($24k/yr) — positive. Per door: $490/mo.
- The deal already cash-flows at list — no discount required.
- Meets the 1% rule at list price ($5k rent vs $315k).
- Recommended offer: $277k (12.0% below list) — sets the bar for market timing.
- Cap rate 13.8% vs local median 3.9% in Kansas City — top-decile yield for the area; either an underpriced asset or a hidden risk that comps aren't pricing in. Stress-test before assuming the spread holds.
Location & tenants
- Location reads 78/100 on livability (#28 in MO, #2,671 nationally) — a middle-class / working-renter tenant base. Strengths: amenities A+, commute A+, cost of living A+; Watch: schools C-, crime F.
- Kansas City 33 (urban): math 12% / reading 24% proficiency, ranked #308 of 324 in MO (top 95%) — low school quality limits family demand, transient renter base, plan for 1-2y turnover; 75% free/reduced lunch — lower-income household profile, screen leases tightly.
- Market conditions: Rents rising fast (+4.7%/yr); 86 active listings in the ZIP; lower-income renter base — watch delinquency; 4,002 units permitted in Jackson County in 2024 (2,271 in 5+ unit buildings).
- At $4,946/mo this rent would consume 164% of the median local household income ($36k/yr) (locally 946% of renters already pay >50% of income on rent) — very limited rent-growth headroom before tenants either downsize or default.
Forward outlook
- In year one you build about $34k of equity ($2k loan paydown + $32k appreciation (10.0% local appreciation)).
- Jackson County population projected at +4% by 2050 — modest demand growth; plan on rents tracking national, not racing it.
- At projected returns (10.0% appreciation + 4.7% rent growth), your $88k cash investment doubles in ~2 years — after that, you're playing with house money.
- By year 2, paydown + projected appreciation supports a ~$54k cash-out refi (75% LTV) — recoverable capital for the next deal without selling this one.
Negotiation context
- It's been on market 285 days — a 12% lower offer ($277k) is reasonable based on typical stale-listing flexibility.
- 8 sale attempts since 15y ago; this cycle's ask has dropped $104k (25%) from the opening price — seller is motivated, your offer sets the floor, not the list.
- Current owner paid $92k; list at $315k implies a 244% gain — meaningful room to come down on a strong offer.
Risks & watch-outs
- Watch-outs: built in 1937 — expect roof / HVAC / electrical / plumbing capex.
Questions for the listing agent
- It's been on market 285 days. Have you received any prior offers? Is the seller open to a 12% concession, seller financing, or rate buy-down credit?
- Can we see the unit-by-unit rent roll, current vacancy, and any below-market leases? What's the average tenancy length?
- What capital expenditures (roof, boiler, parking lot, exteriors) have been made in the last 5 years, and what's planned in the next 2?
- Built in 1937 — when were the roof, HVAC, electrical panel, plumbing, and water heater last replaced?
- Why hasn't it sold? Are there any deal-killer items the seller is aware of (foundation, flood, title, zoning, code violations)?
- Is there a deadline driving the sale (1031 exchange, divorce, estate, relocation)? That informs how much negotiation room exists.
- Crime grade is F in this area — have there been break-ins, vandalism, or insurance claims at this property in the last 3 years? What carrier currently insures it and at what premium?
- What's the average days-on-market for RENTAL listings here right now (not sales)? A rising rental-DOM trend means longer vacancies and softer asking-rent achievability than the comps imply.
- What's the recent tenant-quality profile in this submarket — average credit score on applications, eviction rate, late-payment / NSF rate, and stable-employment percentage? A property-management company in the area should have these aggregated.
- How much new apartment / multifamily construction is in the pipeline within 1–3 miles? Heavy new supply (>2% of stock underway) typically softens rents 12–24 months out; light construction supports rent growth.
Investment metrics
- 1% rule
- 1.57% ✓
- Cap rate
- 13.76%
- Cash-on-cash
- 26.65%
- DSCR
- 2.19
- GRM
- 5.3
CMA / ARV
- ARV (median comp)
- $283,504
- List price
- $315,000
- Delta
- 11.11%
- Verdict
- OVERPRICED
- Comps
- 5 within 1.0 mi
Projected returns pro-forma
10.0% appreciation · 4.65% rent growth · sell at horizon
- IRR
- 45.3%
- Equity multiple
- 4.45×
- Total profit
- $304,613
- Equity at exit
- $283,777
- IRR
- 39.9%
- Equity multiple
- 10.26×
- Total profit
- $816,893
- Equity at exit
- $611,976
Cash invested: $88,200 (down + closing). Projections, not guarantees.
Landlord ↔ Tenant lean methodology
- Overall (STATE)
- 81 Strongly Landlord-Friendly
- State Missouri
- 81 Strongly Landlord-Friendly · R+10
- County
- — inherits STATE
- City
- — inherits STATE
ZIP-level market 64128
- Home prices YoY
- 21.6%
- Rents YoY
- 4.7%
- Active inventory
- 86
- Price-to-rent
- 21.2×
Monthly cashflow live
- Estimated rent
- $4,946 high interval (Pro) →
- Mortgage (P&I)
- −$1,652
- Tax from tax record
- −$165 /mo · $1,981/yr
- Insurance
- −$131
- HOA
- −$0
- Vacancy / Maint / Mgmt
- −$1,039
- Net cashflow
- $1,959
Break-even live
4-unit breakdown (identical units grouped — click to expand)
| Units | Beds | Baths | Est. rent |
|---|---|---|---|
| 4× units | 3 | 1 | $4,948 |
| #1 | 3 | 1 | $1,237 |
| #2 | 3 | 1 | $1,237 |
| #3 | 3 | 1 | $1,237 |
| #4 | 3 | 1 | $1,237 |
| Total (4 units) | $4,946 | ||
UW: 25.0% down · 7.5% · 30yr · 1.5% tax · 5.0% vac · 8.0% maint · 8.0% mgmt
Financing live
Cash to close
- Down payment
- $78,750
- Closing costs
- $9,450
- Reserves months
- —
- Total cash needed
- —
Loan-product check · same deal, 3 products live
Conventional
25% down · 7.5% · 30yr
- Down + closing
- —
- Monthly P&I
- —
- Monthly cashflow
- —
- DSCR
- —
- Eligible?
- —
Personal DTI + credit; lowest rate.
DSCR
20% down · 8.5% · 30yr
- Down + closing
- —
- Monthly P&I
- —
- Monthly cashflow
- —
- DSCR
- —
- Eligible?
- —
No personal income docs; deal must DSCR.
Hard money
10% down · 12.0% · 12mo
- Down + closing
- —
- Monthly P&I
- —
- Monthly cashflow
- —
- DSCR
- —
- Eligible?
- —
Short-term bridge; refi at stabilization.
Listing history 42 events
-
2026-06-19price $315,000 Active 285 DOM
-
2026-06-18days on market $350,000 Active 285 DOM
-
2026-06-17days on market $350,000 Active 284 DOM
-
2026-06-16days on market $350,000 Active 283 DOM
-
2026-06-15days on market $350,000 Active 282 DOM
-
2026-06-13days on market $350,000 Active 280 DOM
-
2026-06-09days on market $350,000 Active 276 DOM
-
2026-06-08days on market $350,000 Active 275 DOM
-
2026-06-07days on market $350,000 Active 274 DOM
-
2026-06-05days on market $350,000 Active 271 DOM
-
2026-06-03days on market $350,000 Active 270 DOM
-
2026-06-02days on market $350,000 Active 269 DOM
-
2026-06-01days on market $350,000 Active 268 DOM
-
2026-05-31days on market $350,000 Active 267 DOM
-
2026-05-05price $369,000 332-char remark
Show marketing remark (332 chars)
Excellent investment opportunity in the heart of Kansas City. 4 units, all are 3 bed, 1 bath. All have been recently renovated. All electric building. Owner only pays for water. $4,450 in total monthly income. One of the units just went vacant. Seller willing to offer $10k in concessions to get it rent ready again. Selling as is.
-
2026-02-28price $379,000 332-char remark
Show marketing remark (332 chars)
Excellent investment opportunity in the heart of Kansas City. 4 units, all are 3 bed, 1 bath. All have been recently renovated. All electric building. Owner only pays for water. $4,450 in total monthly income. One of the units just went vacant. Seller willing to offer $10k in concessions to get it rent ready again. Selling as is.
-
2026-02-16status Active 332-char remark
Show marketing remark (332 chars)
Excellent investment opportunity in the heart of Kansas City. 4 units, all are 3 bed, 1 bath. All have been recently renovated. All electric building. Owner only pays for water. $4,450 in total monthly income. One of the units just went vacant. Seller willing to offer $10k in concessions to get it rent ready again. Selling as is.
-
2026-01-29status Pending 332-char remark
Show marketing remark (332 chars)
Excellent investment opportunity in the heart of Kansas City. 4 units, all are 3 bed, 1 bath. All have been recently renovated. All electric building. Owner only pays for water. $4,450 in total monthly income. One of the units just went vacant. Seller willing to offer $10k in concessions to get it rent ready again. Selling as is.
-
2025-12-03price $395,000 332-char remark
Show marketing remark (332 chars)
Excellent investment opportunity in the heart of Kansas City. 4 units, all are 3 bed, 1 bath. All have been recently renovated. All electric building. Owner only pays for water. $4,450 in total monthly income. One of the units just went vacant. Seller willing to offer $10k in concessions to get it rent ready again. Selling as is.
-
2025-08-19$419,000 Active 332-char remark
Show marketing remark (332 chars)
Excellent investment opportunity in the heart of Kansas City. 4 units, all are 3 bed, 1 bath. All have been recently renovated. All electric building. Owner only pays for water. $4,450 in total monthly income. One of the units just went vacant. Seller willing to offer $10k in concessions to get it rent ready again. Selling as is.
-
2025-01-01status Pending
-
2025-01-01historical
-
2024-11-20$419,000 Active
-
2024-01-28historical $1,050
-
2023-09-03$1,050
-
2023-08-30historical $1,050
-
2023-08-24price $1,050
-
2023-07-27price $1,150
-
2023-07-21$1,000
-
2023-04-19status Pending
-
2023-04-19soldstatus Closed
-
2023-04-19$385,000 Active
-
2023-03-31soldstatus
-
2022-02-08soldstatus
-
2014-02-21soldstatus
-
2012-11-30soldstatus
-
2011-10-26soldstatus
-
2011-06-14historical
-
2011-06-13$12,000
-
2011-01-20$48,700
-
2010-08-25soldstatus $91,700
-
2006-10-30soldstatus
ⓘ Source: listings_history table (triggers on properties + properties_extension) + one-shot
backfill from property_details.listing_events for pre-trigger history.
Tax reassessment forecast MO · Resets to sale price
- Current annual tax
- $1,981 · $165/mo
- Projected year-2 tax
- $3,056 · $255/mo
- Expected delta
- +$1,074/yr (+$90/mo · 54.2%)
ⓘ Screening estimate from a state-policy table — verify with the county assessor before closing.
Climate risk First Street
- Flood 1/10 Low FEMA zone X (unshaded) · 0% chance over 30 yrs
- Wildfire 1/10 Low
- Heat 4/10 Moderate 7 d/yr ≥107°F today · 17 d/yr by 30 yrs out
- Wind 2/10 Low
- Air quality 3/10 Moderate 2 unhealthy d/yr today · 3 by 30 yrs out
Nearby sold comps map
Loading sold comps map…
Walkable amenities ~0.75 mi
Loading nearby amenities…
Taxation est. · year 1
- Rental income
- $59,352
- − Mortgage interest
- −$17,645
- − Property taxes
- −$1,981
- − Insurance
- −$1,575
- − Repairs & maintenance
- −$4,748
- − Management
- −$4,748
- − Depreciation
- −$9,164
- Taxable income
- $19,491
- Est. tax owed @ 24.0%
- −$4,678
- After-tax cash flow
- $18,831/yr
For passive investors: Depreciation is non-cash, so a rental often shows a tax loss while cash-flowing — sheltering income. Rental losses are passive: they offset passive income freely, and up to $25,000/yr can offset ordinary (W-2) income if you actively participate and your MAGI is under $100k (phasing out to $0 by $150k); unused losses carry forward. On sale, claimed depreciation is recaptured at up to 25%, and gains may owe capital-gains tax (a 1031 exchange can defer both). Figures are a year-1 estimate at your 24.0% rate — not tax advice; consult a CPA.
Schools (NCES district)
- District
- Kansas City 33
- NCES district ID
- 2916400
- Math proficiency
- 12% ▼ -8.00%
- Reading proficiency
- 24% ▬ 0.00%
- Median HH income
- $35,227
- Composite
- 14.8/100
- National rank
- #9387
- State rank
- #308 of 324 in MO
Livability — Kansas City
- Score
- 78/100
- State rank
- #28
- US rank
- #2671
Category grades
Schools grade is shown separately in the Schools card above.
Census & demographics
- Census place
- Kansas City, MO
- County
- Jackson County · 687,798 people
- City population
- 439,467
- Metro
- Kansas City, MO-KS
- Population (ZIP)
- 11,912
- Household income
- $36,088
- Rent vs Own
- Severe rent burden
- 946.0
Population outlook (Jackson County) Hauer SSP2
- Today (2025)
- 719,589 people
- By 2030
- 731,456 · +1.6%
- By 2040
- 746,689 · +3.8%
- By 2050
- 749,289 · +4.1%
- By 2075
- 736,227 · +2.3%
- By 2100
- 668,210 · -7.1%
Race, ethnicity, and origin ACS 2023
- Neighborhood character
- Predominantly Black (79%)
- Race & ethnicity
- Black 79% Hispanic / Latino 9% White 8% Two or more races 7%
- Hispanic origin (detail)
- Mexican 6%
- Common ancestry
- Swedish 1% Hispanic 1%
- Foreign-born
- 7% · Canada
- Languages at home
- 88% English-only · Spanish 7% French/Haitian/Cajun 2%
Political lean MEDSL · Jackson
- 2024 margin
- D (+19.3) · D 58.9% · R 39.5% · Other 1.6%
- 2008→2024 swing
- -6.1pp toward R · 2008: 25.4pp · 2024: 19.3pp
- All cycles
- 2024: D+19.3 2020: D+22.0 2016: D+16.6 2012: D+19.0 2008: D+25.4
Not yet ingested
- Civics
- —
Market trends
- HPI YoY
- ▲ 73.41%
- Current HPI
- 412.6862
- Rent YoY
- ▲ 4.65%
- Metro
- Kansas City, MO-KS
- State GDP YoY
- ▲ 1.84%
- F500 in state
- 20
Industry mix (Fortune 500 HQ in MO)
| Industry | F500 HQs | Revenue |
|---|---|---|
| Healthcare | 1 | $163B |
|
||
| Insurance | 1 | $21B |
|
||
| Industrial Technology | 1 | $17B |
|
||
| Retail | 1 | $16B |
|
||
| Industrial Distribution | 1 | $10B |
|
||
| Utilities | 1 | $9B |
|
||
Price history
+302.4% since first listed28 events — show timeline
- 2026-05-05 Price Changed $369,000 Heartland MLS as Distributed by MLS Grid
- 2026-02-28 Price Changed $379,000 Heartland MLS as Distributed by MLS Grid
- 2026-02-16 Relisted — Heartland MLS as Distributed by MLS Grid
- 2026-01-29 Pending — Heartland MLS as Distributed by MLS Grid
- 2025-12-03 Price Changed $395,000 Heartland MLS as Distributed by MLS Grid
- 2025-08-19 Listed $419,000 Heartland MLS as Distributed by MLS Grid
- 2025-01-01 Pending — Heartland MLS as Distributed by MLS Grid
- 2025-01-01 Listing Removed — Heartland MLS as Distributed by MLS Grid
- 2024-11-20 Listed $419,000 Heartland MLS as Distributed by MLS Grid
- 2024-01-28 Rental Removed $1,050 BUILDIUM
- 2023-09-03 Listed for Rent $1,050 BUILDIUM
- 2023-08-30 Rental Removed $1,050 BUILDIUM
- 2023-08-24 Price Changed $1,050 BUILDIUM
- 2023-07-27 Price Changed $1,150 BUILDIUM
- 2023-07-21 Listed for Rent $1,000 BUILDIUM
- 2023-04-19 Pending — Heartland MLS as Distributed by MLS Grid
- 2023-04-19 Listed $385,000 Heartland MLS as Distributed by MLS Grid
- 2023-04-19 Sold (MLS) — Heartland MLS as Distributed by MLS Grid
- 2023-03-31 Sold (Public Records) — Public Records
- 2022-02-08 Sold (Public Records) — Public Records
- 2014-02-21 Sold (Public Records) — Public Records
- 2012-11-30 Sold (Public Records) — Public Records
- 2011-10-26 Sold (MLS) — Heartland MLS as Distributed by MLS Grid
- 2011-06-14 Listing Removed — Heartland MLS as Distributed by MLS Grid
- 2011-06-13 Listed $12,000 Heartland MLS as Distributed by MLS Grid
- 2011-01-20 Listed $48,700 Heartland MLS as Distributed by MLS Grid
- 2010-08-25 Sold (Public Records) $91,700 Public Records
- 2006-10-30 Sold (Public Records) — Public Records
Property tax history
+12.9%/yrLatest (2025): $1,981 · -38.1% YoY. Source: county tax records.
Cash-flow waterfall
monthlySold comps — $/sqft
last 12 mo · ≤1 miLoading sold comps…