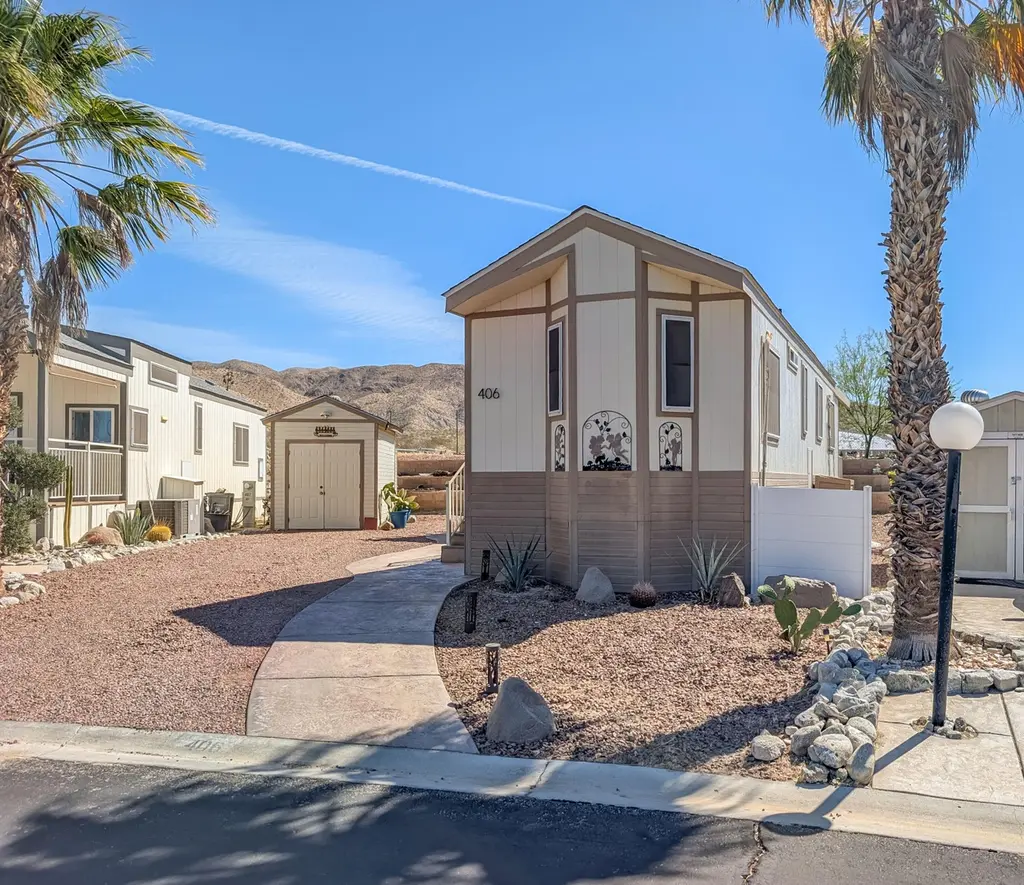
70200 Dillon Rd #406 · Desert Edge, CA
Flood risk 1/10 · Minimal
- FEMA flood zone
- A
- Chance of flooding over 30 yrs
- 0.0%
- Est. flood insurance / yr
- $1,009 – $1,996
Fire risk 5/10 · Moderate
- Est. fire insurance / yr
- $659 – $1,223
Heat risk 8/10 · Major
- Hot days now (above 109°F)
- 6 days/yr
- Hot days in 30 yrs
- 16 days/yr
Wind risk 1/10 · Minimal
- Chance of severe wind over 30 yrs
- —
Air-quality risk 5/10 · Moderate
- Unhealthy air days now
- 6 days/yr
- Unhealthy air days in 30 yrs
- 8 days/yr
Risk factors via First Street. Map © Google.
Why this score? — see what drove the C+ grade
The composite is a weighted blend of 9 inputs, each scored 0–100. Each bar is that input's sub-score; the figure is the points it added to the 100-point composite (weight × sub-score).
- Cash flow +30.0/30.0
- 1% rule +10.0/10.0
- DSCR +10.0/10.0
- Condition / age +4.0/5.0
- Livability +3.4/5.0
- Schools +2.7/10.0
- Rent growth +2.5/5.0
- ARV discount +0.0/15.0
- Appreciation +0.0/10.0
$80,000
🖨 Deal sheet 📄 Offer letter ✓ Due diligence
Listing remarks
The 2007 Laurel Creek Park Model provides approximately 550 square feet of living space, featuring a bright and efficient layout. The home is fully furnished and includes two mini-split units for climate control, ensuring comfort throughout the seasons. Additional storage is available in the included shed. This home offers sweeping vistas of Mount San Jacinto, as well as views of the surrounding hills and landscapes. Its location makes it an ideal retreat, nestled in natural beauty. Outdoor spaces are thoughtfully designed for both relaxation and entertainment. Residents can enjoy a covered, wind-protected deck, a terraced landscape viewing area, and a large elevated fenced deck with expans
Key facts
- Covered deck
- Elevated fenced deck
- Tiled walk-in shower
Tags
Property features AI
Finance
- Other: Rental restrictions apply; Listing sells turnkey; sale terms include cash
- Financial info: Mobile home to remain; Monthly space rent (park) indicated in data
- HOA & community: Senior community; Gated community; Monthly association fees: $0
Exterior
- Parking: Assigned parking and driveway (2 total parking spaces, no garage/no covered spaces)
- Security: Automatic gate; Owned security system; Gated community
- Utilities: Water provided by a water district (Mission); Septic tank; Has water well; PUD: Yes; Space rent includes trash (mobile home park setting)
- Home design: Detached unit; Single-story (ground level, no unit above); Builder/model: Laurel Creek; Leisure and front door face east; additional leisure orientations north and south
- Construction: Siding exterior; Pier jacks and tie-down foundation; Manufactured home (Laurel Creek), 2007 manufacture date; Skirted with siding
- Exterior features: Covered patio/deck; Accessory buildings/shed; Fenced community pool area; Back yard and level yard; Cul-de-sac location; Street public access; Automatic gate and owned security system within a gated community; Community amenities: community mailboxes, trailer storage, pickleball courts, golf course within development, dog park; Views of city lights, panoramic vistas, mountains, hills and desert; Property updated/remodeled; additions/alterations
Interior
- Kitchen: Corian counters; Remodeled kitchen; Gas cooktop; Gas oven; Microwave; Refrigerator; Water filter
- Bedrooms: Main floor bedroom
- Flooring: Vinyl flooring
- Bathrooms: 1 full bathroom with tile shower and shower stall
- Heating & cooling: Central heating; Heat pump; Electric heating fuel; Central air conditioning; Ceiling fans
- Interior features: Vaulted ceilings; Storage space; Sliding doors; Blinds and drapes; Ground-level entry with steps; Turnkey (furnished/ready)
- Laundry & utility: Community laundry; Water heater unit
Neighborhood map
What this means for you Summary
Snapshot
- This is a 1-bed/1.0-bath manufactured listed at $80k. Condition is rated good.
Deal economics
- At list price, monthly cash flow is $769 ($9k/yr) — positive.
- The deal already cash-flows at list — no discount required.
- Meets the 1% rule at list price ($2k rent vs $80k).
- Recommended offer: $78k (3.0% below list) — sets the bar for market timing.
- Cap rate 19.7% vs local median 14.8% in Desert Edge — top-decile yield for the area; either an underpriced asset or a hidden risk that comps aren't pricing in. Stress-test before assuming the spread holds.
Location & tenants
- Location reads 68/100 on livability (#297 in CA) — a middle-class / working-renter tenant base. Strengths: cost of living A+, housing A+; Watch: crime C-, schools F, commute D-.
- Palm Springs Unified (suburban): math 21% / reading 42% proficiency, ranked #328 of 517 in CA (top 63%) — families likely to look elsewhere, expect single-tenant / working-renter base with shorter leases; 73% free/reduced lunch — lower-income household profile, screen leases tightly.
- Market conditions: 216 active listings in the ZIP; 2 comparable units currently listed for rent nearby; 9,195 units permitted in Riverside County in 2024 (1,512 in 5+ unit buildings).
Forward outlook
- Local home prices are declining (-3.0%/yr); year-one equity from $553 of loan paydown is wiped out by about $2k of value loss. Plan a longer hold.
- Riverside County population projected at +22% by 2050 — long-run rental-demand tailwind backs the buy-and-hold thesis.
- At projected returns (-3.0% appreciation + 3.0% rent growth), your $22k cash investment doubles in ~3 years — after that, you're playing with house money.
Negotiation context
- It's been on market 55 days — a 3% lower offer ($78k) is reasonable based on typical stale-listing flexibility.
Risks & watch-outs
- Watch-outs: flood insurance adds $125/mo.
- Climate carrying-cost: in FEMA flood zone A (mandatory federal flood insurance); moderate wildfire risk; extreme-heat days projected 6→16/yr by 2055 (HVAC capex compounding) — expect insurance premiums to compound above CPI over the hold.
Questions for the listing agent
- It's been on market 55 days. Have you received any prior offers? Is the seller open to a 3% concession, seller financing, or rate buy-down credit?
- What's the actual annual flood-insurance premium (NFIP or private), and is the property in a SFHA with mandatory coverage?
- Is there a deadline driving the sale (1031 exchange, divorce, estate, relocation)? That informs how much negotiation room exists.
- Schools are F-rated, which usually means shorter tenancies and higher turnover. Who's the typical renter profile here, and what's been the actual vacancy rate?
- What's the average days-on-market for RENTAL listings here right now (not sales)? A rising rental-DOM trend means longer vacancies and softer asking-rent achievability than the comps imply.
- What's the recent tenant-quality profile in this submarket — average credit score on applications, eviction rate, late-payment / NSF rate, and stable-employment percentage? A property-management company in the area should have these aggregated.
- How much new for-sale + rental construction is in the pipeline within 1–3 miles? Heavy new supply typically softens prices + rents 12–24 months out; constrained supply supports both.
Investment metrics
- 1% rule
- 2.29% ✓
- Cap rate
- 19.71%
- Cash-on-cash
- 47.90%
- DSCR
- 3.13
- GRM
- 3.6
CMA / ARV
- ARV (median comp)
- $55,900
- List price
- $80,000
- Delta
- 43.11%
- Verdict
- OVERPRICED
- Comps
- 20 within 1.0 mi
Show comp detail 12 sales within ~0.75 mi
| Address | Dist | Beds/Ba | Sqft | Sold | Price | $/sf | Match |
|---|---|---|---|---|---|---|---|
| 70200 Dillon Rd #416 | 0.17mi | 1/1.0 | 550 (0%) | 8mo | $48,000 | $87 | 86 |
| 70200 Dillon Rd #654 | 0.17mi | 2/1.0 (+1) | 550 (0%) | 3mo | $97,500 | $177 | 85 |
| 70200 Dillon Rd #320 | 0.16mi | 1/1.0 | 550 (0%) | 10mo | $50,000 | $91 | 84 |
| 70200 Dillon Rd #324 | 0.11mi | 1/1.0 | 570 (+4%) | 12mo | $76,000 | $133 | 79 |
| 70200 Dillon Rd #215 | 0.11mi | 1/1.0 | 600 (+9%) | 4mo | $65,000 | $108 | 76 |
| 70200 Dillon Rd #605 | 0.11mi | 1/1.0 | 600 (+9%) | 5mo | $97,500 | $163 | 76 |
| 70200 Dillon Rd #446 | 0.00mi | 2/1.5 (+1) | 600 (+9%) | 4mo | $75,000 | $125 | 74 |
| 70200 Dillon Rd #97 | 0.17mi | 1/1.0 | 600 (+9%) | 4mo | $20,500 | $34 | 73 |
| 70200 Dillon Rd #36 | 0.11mi | 1/1.0 | 600 (+9%) | 8mo | $65,000 | $108 | 73 |
| 70200 Dillon Rd #527 | 0.16mi | 2/1.0 (+1) | 525 (-4%) | 13mo | $55,000 | $105 | 69 |
| 70200 Dillon Rd #590 | 0.17mi | 2/1.0 (+1) | 625 (+14%) | 4mo | $61,500 | $98 | 61 |
| 17850 Corkill Rd #31 | 0.61mi | 2/1.0 (+1) | 600 (+9%) | 5mo | $25,000 | $42 | 47 |
Match score weights: distance 35% · size 25% · config 20% · recency 20%. Top-matched comps best support the ARV.
Projected returns pro-forma
-3.0% appreciation · 3.0% rent growth · sell at horizon
- IRR
- 37.8%
- Equity multiple
- 2.61×
- Total profit
- $36,119
- Equity at exit
- $11,928
- IRR
- 44.4%
- Equity multiple
- 5.24×
- Total profit
- $94,943
- Equity at exit
- $6,917
Cash invested: $22,400 (down + closing). Projections, not guarantees.
Landlord ↔ Tenant lean methodology
- Overall (STATE)
- 18 Strongly Tenant-Friendly
- State California
- 18 Strongly Tenant-Friendly · D+13
- County
- — inherits STATE
- City
- — inherits STATE
ZIP-level market 92241
- Home prices YoY
- -22.8%
- Active inventory
- 216
- Price-to-rent
- 3.6×
Monthly cashflow live
- Estimated rent
- $1,832 medium interval (Pro) →
- Mortgage (P&I)
- −$420
- Tax est. 1.5%
- −$100 /mo · $1,200/yr
- Insurance
- −$33
- Flood insurance flood zone
- −$125 /mo · $1,502/yr
- HOA
- −$0
- Vacancy / Maint / Mgmt
- −$385
- Net cashflow
- $769
Break-even live
UW: 25.0% down · 7.5% · 30yr · 1.5% tax · 5.0% vac · 8.0% maint · 8.0% mgmt
Financing live
Cash to close
- Down payment
- $20,000
- Closing costs
- $2,400
- Reserves months
- —
- Total cash needed
- —
Loan-product check · same deal, 3 products live
Conventional
25% down · 7.5% · 30yr
- Down + closing
- —
- Monthly P&I
- —
- Monthly cashflow
- —
- DSCR
- —
- Eligible?
- —
Personal DTI + credit; lowest rate.
DSCR
20% down · 8.5% · 30yr
- Down + closing
- —
- Monthly P&I
- —
- Monthly cashflow
- —
- DSCR
- —
- Eligible?
- —
No personal income docs; deal must DSCR.
Hard money
10% down · 12.0% · 12mo
- Down + closing
- —
- Monthly P&I
- —
- Monthly cashflow
- —
- DSCR
- —
- Eligible?
- —
Short-term bridge; refi at stabilization.
Rent comps 2 comps
| Address | Beds | Baths | Sqft | Rent | $/sqft | DOM | Units | Dist |
|---|---|---|---|---|---|---|---|---|
| 70875 Dillon Rd Desert Hot Springs, CA | 2.0 | 2.0 | 720 | $2,200 | $3.06 | 43d | 1 | 0.80mi |
| 15935 Mary Cir Desert Hot Springs, CA | 1.0 | 1.0 | 550 | $1,350 | $2.45 | 18d | 1 | 1.37mi |
Listing history 15 events
-
2026-06-18days on market $80,000 Active 55 DOM
-
2026-06-17days on market $80,000 Active 54 DOM
-
2026-06-16days on market $80,000 Active 53 DOM
-
2026-06-15days on market $80,000 Active 52 DOM
-
2026-06-13days on market $80,000 Active 50 DOM
-
2026-06-13days on market $80,000 Active 49 DOM
-
2026-06-09days on market $80,000 Active 46 DOM
-
2026-06-08days on market $80,000 Active 45 DOM
-
2026-06-07days on market $80,000 Active 44 DOM
-
2026-06-04days on market $80,000 Active 41 DOM
-
2026-06-03days on market $80,000 Active 40 DOM
-
2026-06-02days on market $80,000 Active 39 DOM
-
2026-06-01days on market $80,000 Active 38 DOM
-
2026-05-31days on market $80,000 Active 37 DOM
-
2026-04-23$80,000 Active 1441-char remark
ⓘ Source: listings_history table (triggers on properties + properties_extension) + one-shot
backfill from property_details.listing_events for pre-trigger history.
Climate risk First Street
- Flood 1/10 Low FEMA zone A · 0% chance over 30 yrs
- Wildfire 5/10 Major
- Heat 8/10 Severe 6 d/yr ≥109°F today · 16 d/yr by 30 yrs out
- Wind 1/10 Low
- Air quality 5/10 Major 6 unhealthy d/yr today · 8 by 30 yrs out
Nearby sold comps map
Loading sold comps map…
Walkable amenities ~0.75 mi
Loading nearby amenities…
Taxation est. · year 1
- Rental income
- $21,981
- − Mortgage interest
- −$4,481
- − Property taxes
- −$1,200
- − Insurance
- −$1,902
- − Repairs & maintenance
- −$1,758
- − Management
- −$1,758
- − Depreciation
- −$2,327
- Taxable income
- $8,553
- Est. tax owed @ 24.0%
- −$2,053
- After-tax cash flow
- $7,175/yr
For passive investors: Depreciation is non-cash, so a rental often shows a tax loss while cash-flowing — sheltering income. Rental losses are passive: they offset passive income freely, and up to $25,000/yr can offset ordinary (W-2) income if you actively participate and your MAGI is under $100k (phasing out to $0 by $150k); unused losses carry forward. On sale, claimed depreciation is recaptured at up to 25%, and gains may owe capital-gains tax (a 1031 exchange can defer both). Figures are a year-1 estimate at your 24.0% rate — not tax advice; consult a CPA.
Condition & rehab AI · 12 photos
This manufactured home is in good condition with a good exterior and interior. It has a good roof and HVAC system, and the landscaping is well-maintained. The home is move-in ready and has a good resale and rental value.
Value-add opportunities
- Both Paint the exterior siding — Fresh paint can enhance the curb appeal and increase the home's value
- Both Replace the HVAC system — A new HVAC system can improve comfort and energy efficiency
- Both Landscaping improvements — Enhanced landscaping can increase curb appeal and attract more potential buyers
Renovation cost estimate screening
Value-add ROI direction
- Both Paint the exterior siding — Fresh paint can enhance the curb appeal and increase the home's value ↑
- Both Replace the HVAC system — A new HVAC system can improve comfort and energy efficiency ↑
- Both Landscaping improvements — Enhanced landscaping can increase curb appeal and attract more potential buyers ↑
ⓘ Cost ranges are severity-bucket heuristics (US national rule-of-thumb). Get contractor quotes + a written scope before underwriting a rehab budget.
Schools (NCES district)
- District
- Palm Springs Unified
- NCES district ID
- 0629550
- Math proficiency
- 21% ▼ -7.00%
- Reading proficiency
- 42% ▬ 0.00%
- Median HH income
- $43,638
- Composite
- 26.76/100
- National rank
- #7131
- State rank
- #328 of 517 in CA
Livability — Desert Edge
- Score
- 68/100
- State rank
- #297
- US rank
- #9953
Category grades
Schools grade is shown separately in the Schools card above.
Census & demographics
- Census place
- Desert Edge, CA
- Population (ZIP)
- 8,624
Population outlook (Riverside County) Hauer SSP2
- Today (2025)
- 2,664,475 people
- By 2030
- 2,802,692 · +5.2%
- By 2040
- 3,050,904 · +14.5%
- By 2050
- 3,256,783 · +22.2%
- By 2075
- 3,655,058 · +37.2%
- By 2100
- 3,766,594 · +41.4%
Race, ethnicity, and origin ACS 2023
- Race & ethnicity
- White 50% Hispanic / Latino 46% Two or more races 16% Asian 2% Native American 1%
- Hispanic origin (detail)
- Mexican 36%
- Common ancestry
- Lithuanian 3% Slovak 2% Portuguese 2%
- Foreign-born
- 28% · Canada, South Korea
- Languages at home
- 57% English-only · Spanish 38% Chinese 1% Russian/Polish/Slavic 1%
Political lean MEDSL · Riverside
- 2024 margin
- Toss-up / Even · D 48.0% · R 49.3% · Other 2.6%
- 2008→2024 swing
- -3.6pp toward R · 2008: 2.3pp · 2024: -1.3pp
- All cycles
- 2024: R+1.3 2020: D+8.0 2016: D+4.3 2012: R+0.4 2008: D+2.3
Not yet ingested
- Civics
- —
Market trends
- HPI YoY
- ▼ -118.23%
- Current HPI
- 400.5663
- Rent YoY
- —
- Metro
- —
- State GDP YoY
- ▲ 3.21%
- F500 in state
- 116
Industry mix (Fortune 500 HQ in CA)
| Industry | F500 HQs | Revenue |
|---|---|---|
| Technology | 27 | $1,492B |
|
||
| Financial Services | 3 | $174B |
|
||
| Retail | 3 | $44B |
|
||
| Insurance | 3 | $26B |
|
||
| Media / Entertainment | 2 | $115B |
|
||
| Pharmaceuticals / Biotech | 2 | $62B |
|
||
Price history
1 event — show timeline
- 2026-04-23 Listed $80,000 GPSMLS
Cash-flow waterfall
monthlySold comps — $/sqft
last 12 mo · ≤1 miLoading sold comps…