 🏗️ New Construction
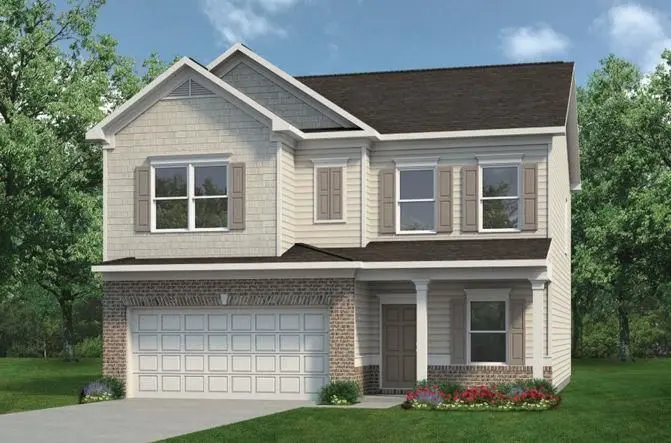
703 Sinclair Ln · Temple, GA
Flood risk No data
- FEMA flood zone
- —
- Chance of flooding over 30 yrs
- —
- Est. flood insurance / yr
- —
Fire risk No data
- Est. fire insurance / yr
- —
Heat risk No data
- Hot days now (above threshold)
- —
- Hot days in 30 yrs
- —
Wind risk No data
- Chance of severe wind over 30 yrs
- —
Air-quality risk No data
- Unhealthy air days now
- —
- Unhealthy air days in 30 yrs
- —
Risk factors via First Street. Map © Google.
Why this score? — see what drove the D- grade
The composite is a weighted blend of 9 inputs, each scored 0–100. Each bar is that input's sub-score; the figure is the points it added to the 100-point composite (weight × sub-score).
- Appreciation +10.0/10.0
- ARV discount +7.5/15.0
- Cash flow +6.4/30.0
- Schools +3.6/10.0
- Livability +3.6/5.0
- Rent growth +2.5/5.0
- Condition / age +2.5/5.0
- 1% rule +1.7/10.0
- DSCR +0.7/10.0
$313,900
🖨 Deal sheet 📄 Offer letter ✓ Due diligence
Listing remarks MLS
Move-in Ready August 2026! The Coleman floor plan by Smith Douglas Homes now available in the Evergreen at Lakeside community in Temple, Georgia. This thoughtfully designed new construction home offers modern style, functional living, and exceptional value in a growing West Georgia location known for its small-town charm and easy access to Metro Atlanta. Upon entry, The Coleman welcomes guests with a wide foyer that opens to a dining room, ideal for hosting. The foyer flows seamlessly into a spacious open-concept living, dining, and kitchen area, perfect for entertaining or everyday living. The large eat-in kitchen features Granite countertops upgraded cabinetry with crown molding, a center island, and stainless-steel appliances, all overlooking the family room with a stylish linear fireplace. Luxury Vinyl Plank flooring extends throughout the entire main level, combining durability with modern design. Step outside to a rear patio, offering ample space for outdoor dining, grilling, or relaxing with family and friends. An elegant open iron staircase leads to the second level, where youll find a spacious primary suite with a private bath featuring a large, tiled shower, dual sinks and marble countertops. Three additional generously sized bedrooms, a shared hall bath with marble counters, and a convenient upstairs laundry room complete the upper level. Large closets throughout the home provide exceptional storage, while 9-foot ceilings on both floors enhance the open, airy f. ..
Key facts
- Large eat-in kitchen
- Upgraded cabinetry
- Granite countertops
Tags
Property features AI
Finance
- Other: Builder: Smith Douglas Homes
- HOA & community: Homeowners association with an annual fee of $420
Exterior
- Parking: Attached parking for 2 vehicles
- Utilities: Public water; Public sewer; Electricity available; Sewer available; Water available
- Home design: Two levels; New construction; Built by Smith Douglas Homes
- Construction: HardiPlank, brick and other siding materials; Composition roof; Slab foundation
- Exterior features: Front porch; Patio
Interior
- Kitchen: Kitchen island; Pantry and walk-in pantry; Stone countertops; Cabinets (other); Open view to family room; Electric range; Microwave; Dishwasher; Disposal
- Bedrooms: Oversized master; Four upper-level bedrooms
- Flooring: Carpet; Luxury vinyl
- Bathrooms: Two full bathrooms; One half bathroom; Master bathroom with double vanity and shower (shower only)
- Heating & cooling: Central heating; Central air conditioning
- Interior features: Entrance foyer; 9-foot ceilings on main and upper levels; Tray ceilings; One electric fireplace in the family room; No shared/common walls; Attic
- Laundry & utility: Upper-level laundry; Other laundry features
Neighborhood map
What this means for you Summary
Snapshot
- This is a 4-bed/2.5-bath single-family listed at $314k.
Deal economics
- At list price, monthly cash flow is $-562 ($-7k/yr) — negative.
- To cash-flow at today's rent, offer at most $239k (23.9% below list).
- To meet the 1% rule (rent ≥ 1% of price), the offer needs to be $214k (32.0% below list).
- Recommended offer: $214k (32.0% below list) — sets the bar for 1% rule.
Location & tenants
- Location reads 72/100 on livability (#60 in GA) — a middle-class / working-renter tenant base. Strengths: crime A+, cost of living A+, housing A+; Watch: amenities F, commute F.
- Carroll County (rural): math 42% / reading 41% proficiency, ranked #38 of 174 in GA (top 22%) — families likely to look elsewhere, expect single-tenant / working-renter base with shorter leases.
- Zoned schools: Temple Elementary School (math 37% / reading 38%, grade F, #474 of 1,228 statewide, top 39%, 662 students, 75% FRL); Temple Middle School (math 31% / reading 36%, grade F, #206 of 470 statewide, top 45%, 621 students, 67% FRL); Temple High School (math 22% / reading 22%, grade F, #213 of 424 statewide, top 51%, 746 students, 62% FRL).
- Market conditions: 189 active listings in the ZIP; 9 comparable units currently listed for rent nearby; rentals at typical pace (median 24d on market — plan ~3-4 weeks tenant-placement turnaround); 44% of comp listings sitting > 30 days — soft ceiling on asking rent; solid renter incomes; 876 units permitted in Carroll County in 2024 (150 in 5+ unit buildings).
- This rent runs 33% of the median local income ($77k/yr) — at the standard rent-burdened threshold; future hikes will face affordability resistance.
Forward outlook
- In year one you build about $34k of equity ($2k loan paydown + $32k appreciation (10.0% local appreciation)).
- Carroll County population projected at +12% by 2050 — modest demand growth; plan on rents tracking national, not racing it.
- By year 2, paydown + projected appreciation supports a ~$55k cash-out refi (75% LTV) — recoverable capital for the next deal without selling this one.
Negotiation context
- Only 14 days on market — expect competitive offers; lowballing is unlikely to land.
- 3 sale attempts with the ask held roughly flat each time — persistent listings suggest the price (not the market) is what's stuck; bring a comps-based counter.
Questions for the listing agent
- What do current leases actually rent for vs. the listed asking? Can we see a recent rent roll and the last 12 months of T-12 income?
- What does the HOA fee cover, when was the last increase, and are there any pending special assessments or reserve-fund shortfalls?
- Is there a deadline driving the sale (1031 exchange, divorce, estate, relocation)? That informs how much negotiation room exists.
- Schools are D-rated, which usually means shorter tenancies and higher turnover. Who's the typical renter profile here, and what's been the actual vacancy rate?
- The area grade is low — what's the realistic commute time and amenity access for the typical tenant pool here? Any planned neighborhood developments (good or bad) we should know about?
- What's the average days-on-market for RENTAL listings here right now (not sales)? A rising rental-DOM trend means longer vacancies and softer asking-rent achievability than the comps imply.
- What's the recent tenant-quality profile in this submarket — average credit score on applications, eviction rate, late-payment / NSF rate, and stable-employment percentage? A property-management company in the area should have these aggregated.
- How much new for-sale + rental construction is in the pipeline within 1–3 miles? Heavy new supply typically softens prices + rents 12–24 months out; constrained supply supports both.
Investment metrics
- 1% rule
- 0.67% ✗
- Cap rate
- 4.19%
- Cash-on-cash
- -7.51%
- DSCR
- 0.67
- GRM
- 12.5
CMA / ARV
- ARV (on-the-fly)
- $320,268
- Comps found
- 12
Show comp detail 12 sales within ~0.75 mi
| Address | Dist | Beds/Ba | Sqft | Sold | Price | $/sf | Match |
|---|---|---|---|---|---|---|---|
| 725 Sinclair Ln | 0.00mi | 4/2.5 | 2,053 (0%) | 1mo | $319,840 | $156 | 99 |
| 723 Sinclair Ln | 0.00mi | 3/2.5 (-1) | 2,231 (+9%) | 1mo | $323,640 | $145 | 80 |
| 730 Sinclair Ln | 0.00mi | 3/2.0 (-1) | 1,826 (-11%) | 1mo | $314,900 | $172 | 74 |
| 102 Streambank Ct | 0.44mi | 4/2.5 | 2,091 (+2%) | 4mo | $341,000 | $163 | 72 |
| 51 Carrollton St | 0.16mi | 3/2.0 (-1) | 2,181 (+6%) | 6mo | $262,500 | $120 | 70 |
| 96 Rome St | 0.15mi | 4/2.5 | 1,786 (-13%) | 3mo | $329,000 | $184 | 69 |
| 435 Nottely Dr | 0.68mi | 4/2.5 | 2,053 (0%) | 8mo | $319,900 | $156 | 61 |
| 107 Deer Xing Lot 88 | 0.57mi | 4/2.5 | 2,204 (+7%) | 6mo | $292,900 | $133 | 56 |
| 108 Deer Xing Lot 3 | 0.57mi | 4/2.5 | 1,856 (-10%) | 6mo | $325,000 | $175 | 53 |
| 130 Carroll St | 0.46mi | 3/2.0 (-1) | 1,832 (-11%) | 2mo | $265,000 | $145 | 52 |
| 37 Katie St | 0.70mi | 4/2.0 | 2,148 (+5%) | 8mo | $385,000 | $179 | 51 |
| 121 Creek Crossing Ln | 0.55mi | 3/3.0 (-1) | 2,187 (+6%) | 8mo | $340,000 | $155 | 50 |
Match score weights: distance 35% · size 25% · config 20% · recency 20%. Top-matched comps best support the ARV.
Projected returns pro-forma
10.0% appreciation · 3.0% rent growth · sell at horizon
- IRR
- 19.0%
- Equity multiple
- 2.55×
- Total profit
- $138,714
- Equity at exit
- $288,523
- IRR
- 17.6%
- Equity multiple
- 5.87×
- Total profit
- $436,724
- Equity at exit
- $622,210
Cash invested: $89,675 (down + closing). Projections, not guarantees.
Landlord ↔ Tenant lean methodology
- Overall (STATE)
- 90 Strongly Landlord-Friendly
- State Georgia
- 90 Strongly Landlord-Friendly · R+3
- County
- — inherits STATE
- City
- — inherits STATE
ZIP-level market 30179
- Home prices YoY
- 6.7%
- Active inventory
- 189
- Price-to-rent
- 12.3×
Monthly cashflow live
- Estimated rent
- $2,135 high interval (Pro) →
- Mortgage (P&I)
- −$1,680
- Tax est. 1.5%
- −$400 /mo · $4,804/yr
- Insurance
- −$133
- HOA
- −$35
- Vacancy / Maint / Mgmt
- −$448
- Net cashflow
- $-562
Break-even live
UW: 25.0% down · 7.5% · 30yr · 1.5% tax · 5.0% vac · 8.0% maint · 8.0% mgmt
Financing live
Cash to close
- Down payment
- $80,067
- Closing costs
- $9,608
- Reserves months
- —
- Total cash needed
- —
Loan-product check · same deal, 3 products live
Conventional
25% down · 7.5% · 30yr
- Down + closing
- —
- Monthly P&I
- —
- Monthly cashflow
- —
- DSCR
- —
- Eligible?
- —
Personal DTI + credit; lowest rate.
DSCR
20% down · 8.5% · 30yr
- Down + closing
- —
- Monthly P&I
- —
- Monthly cashflow
- —
- DSCR
- —
- Eligible?
- —
No personal income docs; deal must DSCR.
Hard money
10% down · 12.0% · 12mo
- Down + closing
- —
- Monthly P&I
- —
- Monthly cashflow
- —
- DSCR
- —
- Eligible?
- —
Short-term bridge; refi at stabilization.
Rent comps 9 comps
| Address | Beds | Baths | Sqft | Rent | $/sqft | DOM | Units | Dist |
|---|---|---|---|---|---|---|---|---|
| 116 Arborwood Way Temple, GA | 3.0 | 2.0 | 1782 | $1,905 | $1.07 | 12d | 1 | 0.39mi |
| 321 Sue Ct Temple, GA | 4.0 | 3.0 | 1621 | $2,111 | $1.30 | 12d | 1 | 0.55mi |
| 206 Randa Run Temple, GA | 3.0 | 2.5 | 1600 | $1,295 | $0.81 | 15d | 1 | 0.78mi |
| 207 Randa Run Temple, GA | 3.0 | 2.5 | 1600 | $1,395 | $0.87 | 44d | 1 | 0.80mi |
| 241 Amy Blvd Temple, GA | 3.0 | 2.0 | 1819 | $1,729 | $0.95 | 43d | 1 | 0.90mi |
| 142 Waters Edge Pkwy Temple, GA | 4.0 | 2.5 | 2185 | $1,999 | $0.91 | 43d | 1 | 0.92mi |
| 215 Waters Edge Pkwy Temple, GA | 4.0 | 2.5 | 2290 | $2,099 | $0.92 | 24d | 1 | 1.06mi |
| 280 Ivey Lake Pkwy Temple, GA | 4.0 | 2.5 | 2210 | $2,100 | $0.95 | 43d | 1 | 1.08mi |
| 121 Breckenridge Pt Temple, GA | 3.0 | 2.0 | 1687 | $1,800 | $1.07 | 19d | 1 | 1.19mi |
HOA detail
- Monthly dues
- $35 · $420/yr
Listing history 9 events
-
2026-06-18days on market $313,900 Active 14 DOM
-
2026-06-17days on market $313,900 Active 13 DOM
-
2026-06-16pricedays on market $313,900 Active 12 DOM
-
2026-06-15days on market $309,900 Active 11 DOM
-
2026-06-13pricedays on market $309,900 Active 9 DOM
-
2026-06-09days on market $319,550 Active 5 DOM
-
2026-06-08days on market $319,550 Active 4 DOM
-
2026-06-07remarks 699-char remark
-
2026-06-07$319,550 Active 3 DOM
ⓘ Source: listings_history table (triggers on properties + properties_extension) + one-shot
backfill from property_details.listing_events for pre-trigger history.
Nearby sold comps map
Loading sold comps map…
Walkable amenities ~0.75 mi
Loading nearby amenities…
Taxation est. · year 1
- Rental income
- $25,621
- − Mortgage interest
- −$17,940
- − Property taxes
- −$4,804
- − Insurance
- −$1,601
- − Repairs & maintenance
- −$2,050
- − Management
- −$2,050
- − HOA
- −$420
- − Depreciation
- −$9,317
- Taxable loss
- −$12,560
- Est. tax savings @ 24.0%
- +$3,014
- After-tax cash flow
- $-3,724/yr
For passive investors: Depreciation is non-cash, so a rental often shows a tax loss while cash-flowing — sheltering income. Rental losses are passive: they offset passive income freely, and up to $25,000/yr can offset ordinary (W-2) income if you actively participate and your MAGI is under $100k (phasing out to $0 by $150k); unused losses carry forward. On sale, claimed depreciation is recaptured at up to 25%, and gains may owe capital-gains tax (a 1031 exchange can defer both). Figures are a year-1 estimate at your 24.0% rate — not tax advice; consult a CPA.
Schools (NCES district)
- District
- Carroll County
- NCES district ID
- 1300840
- Math proficiency
- 42% ▼ -7.00%
- Reading proficiency
- 41% ▼ -8.00%
- Median HH income
- $48,692
- Composite
- 35.62/100
- National rank
- #4888
- State rank
- #38 of 174 in GA
Livability — Temple
- Score
- 72/100
- State rank
- #60
- US rank
- #5802
Category grades
Schools grade is shown separately in the Schools card above.
Census & demographics
- Census place
- Temple, GA
- County
- Carroll County · 124,888 people
- City population
- 19,882
- Metro
- Atlanta-Sandy Springs-Alpharetta, GA
- Population (ZIP)
- 19,882
- Household income
- $76,571
- Rent vs Own
- Severe rent burden
- 396.0
Population outlook (Carroll County) Hauer SSP2
- Today (2025)
- 123,370 people
- By 2030
- 127,186 · +3.1%
- By 2040
- 133,534 · +8.2%
- By 2050
- 137,612 · +11.5%
- By 2075
- 142,892 · +15.8%
- By 2100
- 136,294 · +10.5%
Race, ethnicity, and origin ACS 2023
- Neighborhood character
- Predominantly White (77%)
- Race & ethnicity
- White 77% Black 15% Hispanic / Latino 5% Two or more races 4%
- Common ancestry
- Italian 1% Lithuanian 1% Serbian 1%
- Foreign-born
- 4% · Canada
- Languages at home
- 95% English-only · Spanish 4%
Political lean MEDSL · Carroll
- 2024 margin
- Solid R (+41.2) · D 29.1% · R 70.3%
- 2008→2024 swing
- -8.2pp toward R · 2008: -32.9pp · 2024: -41.2pp
- All cycles
- 2024: R+41.2 2020: R+39.0 2016: R+40.1 2012: R+37.7 2008: R+32.9
Not yet ingested
- Civics
- —
Market trends
- HPI YoY
- ▲ 27.16%
- Current HPI
- 435.3863
- Rent YoY
- —
- Metro
- Atlanta-Sandy Springs-Alpharetta, GA
- State GDP YoY
- ▲ 2.66%
- F500 in state
- 28
Industry mix (Fortune 500 HQ in GA)
| Industry | F500 HQs | Revenue |
|---|---|---|
| Paper / Packaging | 2 | $29B |
|
||
| Retail | 1 | $160B |
|
||
| Transportation / Logistics | 1 | $91B |
|
||
| Airlines | 1 | $62B |
|
||
| Consumer Goods | 1 | $47B |
|
||
| Utilities | 1 | $25B |
|
||
Price history
+0.0% since first listed3 events — show timeline
- 2026-06-04 Listed $319,550 Zillow
- 2026-06-04 Listed $319,550 GAMLS
- 2026-06-04 Listed $319,550 FMLS
Cash-flow waterfall
monthlySold comps — $/sqft
last 12 mo · ≤1 miLoading sold comps…