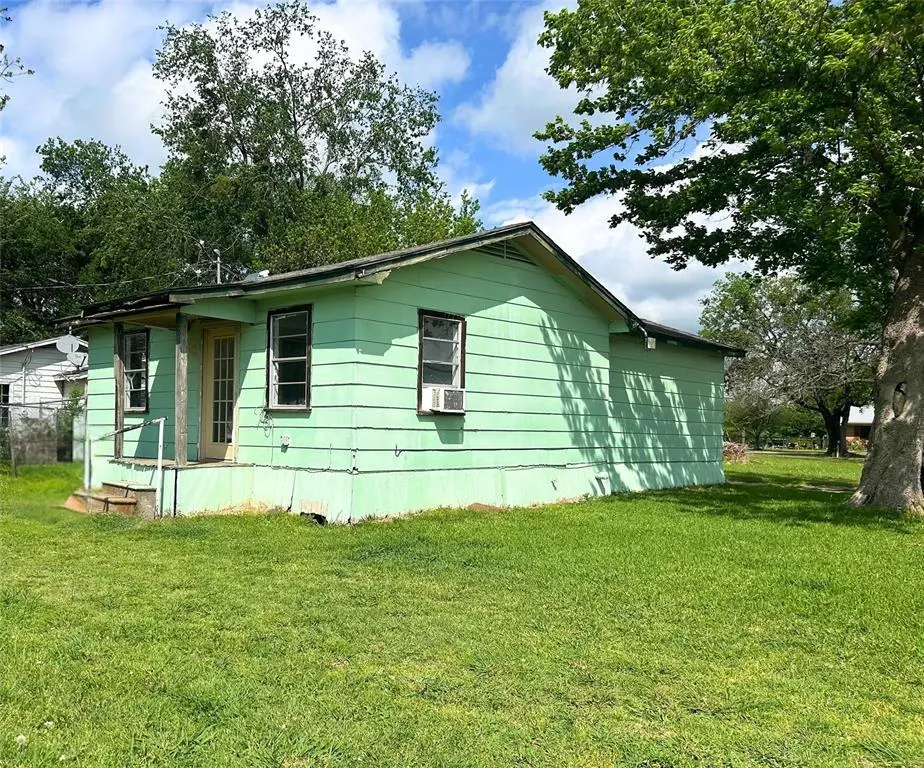
202 N 1st St · Point, TX
Flood risk 1/10 · Minimal
- FEMA flood zone
- X (unshaded)
- Chance of flooding over 30 yrs
- 0.0%
- Est. flood insurance / yr
- $507 – $1,088
Fire risk 4/10 · Minor
- Est. fire insurance / yr
- $1,222 – $2,270
Heat risk 7/10 · Major
- Hot days now (above 110°F)
- 7 days/yr
- Hot days in 30 yrs
- 24 days/yr
Wind risk 6/10 · Moderate
- Chance of severe wind over 30 yrs
- 27.0%
Air-quality risk 2/10 · Minimal
- Unhealthy air days now
- 0 days/yr
- Unhealthy air days in 30 yrs
- 1 days/yr
Risk factors via First Street. Map © Google.
Why this score? — see what drove the B- grade
The composite is a weighted blend of 9 inputs, each scored 0–100. Each bar is that input's sub-score; the figure is the points it added to the 100-point composite (weight × sub-score).
- Cash flow +30.0/30.0
- 1% rule +10.0/10.0
- DSCR +10.0/10.0
- ARV discount +7.5/15.0
- Livability +3.0/5.0
- Rent growth +2.5/5.0
- Condition / age +2.5/5.0
- Schools +2.2/10.0
- Appreciation +0.0/10.0
$44,000
🖨 Deal sheet 📄 Offer letter ✓ Due diligence
Listing remarks
NEW PRICE!! Investor special with tons of potential! Seller is Motivated & Willing to look at offers! This 2-bedroom, 1-bath pier-and-beam home sits on a desirable corner lot within city limits and is full of charm—just bring your tools and imagination. With the right vision, this property could truly shine. Conveniently located between Lake Fork and Lake Tawakoni, making it ideal for fishing enthusiasts or weekend getaways. Great opportunity for investors or buyers looking to add value! HOME IS BEING SOLD AS IS WHERE IS THE SELLER WILL NOT MAKE ANY REPAIRS. All Utilities are currently turned off.
Key facts
- 5,680 sq ft lot
- Built 1986
- Listed 45 days
Property features AI
Finance
- Other: Subdivision: A0206 Raymond Sunigas Survey; Parcel/APN: R4234
- Financial info: Listing for cash offers only; No second mortgage reported
- HOA & community: No association
Exterior
- Parking: Driveway
- Security: Security features: Unknown
- Utilities: City water; City sewer; Electricity available; All-weather road access; No municipal utility district
- Home design: Single-family residence; One story; Residential property; Not attached to another property
- Construction: Built in 1986; Siding exterior; Composition roof; Pillar/post/pier foundation
- Exterior features: Rear porch; Chain link fence in back yard; Corner lot
Interior
- Kitchen: Eat-in kitchen; No appliances included
- Bedrooms: 2 bedrooms (both on the main level)
- Flooring: Carpet; Ceramic tile; Other flooring
- Bathrooms: 1 full bathroom
- Heating & cooling: Electric heating; Other heating; Ceiling fan(s); Window unit(s); Electric cooling
- Interior features: Eat-in kitchen; One living area; One dining area; Total of 3 rooms
- Laundry & utility: Washer hookup in hall
Neighborhood map
What this means for you Summary
Snapshot
- This is a 2-bed/1.0-bath single-family listed at $44k.
Deal economics
- At list price, monthly cash flow is $617 ($7k/yr) — positive.
- The deal already cash-flows at list — no discount required.
- Meets the 1% rule at list price ($1k rent vs $44k).
- Recommended offer: $43k (3.0% below list) — sets the bar for market timing.
Location & tenants
- Location reads 60/100 on livability (#1,092 in TX) — a middle-class / working-renter tenant base. Strengths: cost of living A+, housing A+, crime A-; Watch: amenities F, commute F, employment F.
- Rains ISD (rural): math 22% / reading 30% proficiency, ranked #697 of 826 in TX (top 84%) — low school quality limits family demand, transient renter base, plan for 1-2y turnover.
- Zoned schools: Rains El (437 students, 68% FRL) — zoned schools average 68% FRL vs 48% district-wide (19 pts higher); higher-poverty schools than district average — tighter screening recommended.
- Market conditions: 137 active listings in the ZIP; 21 units permitted in Rains County in 2024 (0 in 5+ unit buildings).
Forward outlook
- Local home prices are declining (-3.0%/yr); year-one equity from $304 of loan paydown is wiped out by about $1k of value loss. Plan a longer hold.
- At projected returns (-3.0% appreciation + 3.0% rent growth), your $12k cash investment doubles in ~2 years — after that, you're playing with house money.
Negotiation context
- It's been on market 46 days — a 3% lower offer ($43k) is reasonable based on typical stale-listing flexibility.
Risks & watch-outs
- Watch-outs: property tax is 3.2% of price.
- Climate carrying-cost: major wind risk, 27% chance of damaging wind over 30y; extreme-heat days projected 7→24/yr by 2055 (HVAC capex compounding) — expect insurance premiums to compound above CPI over the hold.
Questions for the listing agent
- It's been on market 46 days. Have you received any prior offers? Is the seller open to a 3% concession, seller financing, or rate buy-down credit?
- Property tax is high relative to price — has the assessment been appealed recently, and will the sale trigger a re-assessment?
- Is there a deadline driving the sale (1031 exchange, divorce, estate, relocation)? That informs how much negotiation room exists.
- Schools are F-rated, which usually means shorter tenancies and higher turnover. Who's the typical renter profile here, and what's been the actual vacancy rate?
- What's the average days-on-market for RENTAL listings here right now (not sales)? A rising rental-DOM trend means longer vacancies and softer asking-rent achievability than the comps imply.
- What's the recent tenant-quality profile in this submarket — average credit score on applications, eviction rate, late-payment / NSF rate, and stable-employment percentage? A property-management company in the area should have these aggregated.
- How much new for-sale + rental construction is in the pipeline within 1–3 miles? Heavy new supply typically softens prices + rents 12–24 months out; constrained supply supports both.
Investment metrics
- 1% rule
- 2.83% ✓
- Cap rate
- 23.12%
- Cash-on-cash
- 60.09%
- DSCR
- 3.67
- GRM
- 2.9
CMA / ARV
- ARV (median comp)
- $119,428
- List price
- $44,000
- Delta
- -63.16%
- Verdict
- UNDERPRICED
- Comps
- 2 within 1.0 mi
Projected returns pro-forma
-3.0% appreciation · 3.0% rent growth · sell at horizon
- IRR
- 58.9%
- Equity multiple
- 3.62×
- Total profit
- $32,221
- Equity at exit
- $6,561
- IRR
- 63.7%
- Equity multiple
- 7.40×
- Total profit
- $78,889
- Equity at exit
- $3,804
Cash invested: $12,320 (down + closing). Projections, not guarantees.
Landlord ↔ Tenant lean methodology
- Overall (STATE)
- 87 Strongly Landlord-Friendly
- State Texas
- 87 Strongly Landlord-Friendly · R+5
- County
- — inherits STATE
- City
- — inherits STATE
ZIP-level market 75472
- Home prices YoY
- -6.4%
- Active inventory
- 137
- Price-to-rent
- 2.9×
Monthly cashflow live
- Estimated rent
- $1,246 medium interval (Pro) →
- Mortgage (P&I)
- −$231
- Tax from tax record
- −$119 /mo · $1,424/yr
- Insurance
- −$18
- HOA
- −$0
- Vacancy / Maint / Mgmt
- −$262
- Net cashflow
- $617
Break-even live
UW: 25.0% down · 7.5% · 30yr · 1.5% tax · 5.0% vac · 8.0% maint · 8.0% mgmt
Financing live
Cash to close
- Down payment
- $11,000
- Closing costs
- $1,320
- Reserves months
- —
- Total cash needed
- —
Loan-product check · same deal, 3 products live
Conventional
25% down · 7.5% · 30yr
- Down + closing
- —
- Monthly P&I
- —
- Monthly cashflow
- —
- DSCR
- —
- Eligible?
- —
Personal DTI + credit; lowest rate.
DSCR
20% down · 8.5% · 30yr
- Down + closing
- —
- Monthly P&I
- —
- Monthly cashflow
- —
- DSCR
- —
- Eligible?
- —
No personal income docs; deal must DSCR.
Hard money
10% down · 12.0% · 12mo
- Down + closing
- —
- Monthly P&I
- —
- Monthly cashflow
- —
- DSCR
- —
- Eligible?
- —
Short-term bridge; refi at stabilization.
Listing history 20 events
-
2026-06-19days on market $44,000 Active 46 DOM
-
2026-06-18days on market $44,000 Active 45 DOM
-
2026-06-17days on market $44,000 Active 44 DOM
-
2026-06-16days on market $44,000 Active 43 DOM
-
2026-06-15days on market $44,000 Active 42 DOM
-
2026-06-14days on market $44,000 Active 40 DOM
-
2026-06-12days on market $44,000 Active 39 DOM
-
2026-06-09days on market $44,000 Active 36 DOM
-
2026-06-08days on market $44,000 Active 35 DOM
-
2026-06-07days on market $44,000 Active 34 DOM
-
2026-06-07days on market $44,000 Active 33 DOM
-
2026-06-03days on market $44,000 Active 30 DOM
-
2026-06-03remarks 606-char remark
-
2026-06-03price $44,000 Active 29 DOM
-
2026-06-02days on market $59,000 Active 29 DOM
-
2026-06-01days on market $59,000 Active 28 DOM
-
2026-05-31days on market $59,000 Active 27 DOM
-
2026-05-30days on market $59,000 Active 26 DOM
-
2026-04-07$59,000 Active 602-char remark
-
1998-03-31soldstatus
ⓘ Source: listings_history table (triggers on properties + properties_extension) + one-shot
backfill from property_details.listing_events for pre-trigger history.
Tax reassessment forecast TX · Resets to sale price
- Current annual tax
- $1,424 · $119/mo
- Projected year-2 tax
- $1,424 · $119/mo
- Expected delta
- $0/yr ($0/mo · 0.0%)
ⓘ Screening estimate from a state-policy table — verify with the county assessor before closing.
Climate risk First Street
- Flood 1/10 Low FEMA zone X (unshaded) · 0% chance over 30 yrs
- Wildfire 4/10 Moderate
- Heat 7/10 Severe 7 d/yr ≥110°F today · 24 d/yr by 30 yrs out
- Wind 6/10 Major 27% chance of damaging wind over 30 yrs
- Air quality 2/10 Low 0 unhealthy d/yr today · 1 by 30 yrs out
Nearby sold comps map
Loading sold comps map…
Walkable amenities ~0.75 mi
Loading nearby amenities…
Taxation est. · year 1
- Rental income
- $14,957
- − Mortgage interest
- −$2,465
- − Property taxes
- −$1,424
- − Insurance
- −$220
- − Repairs & maintenance
- −$1,197
- − Management
- −$1,197
- − Depreciation
- −$1,280
- Taxable income
- $7,175
- Est. tax owed @ 24.0%
- −$1,722
- After-tax cash flow
- $5,681/yr
For passive investors: Depreciation is non-cash, so a rental often shows a tax loss while cash-flowing — sheltering income. Rental losses are passive: they offset passive income freely, and up to $25,000/yr can offset ordinary (W-2) income if you actively participate and your MAGI is under $100k (phasing out to $0 by $150k); unused losses carry forward. On sale, claimed depreciation is recaptured at up to 25%, and gains may owe capital-gains tax (a 1031 exchange can defer both). Figures are a year-1 estimate at your 24.0% rate — not tax advice; consult a CPA.
Schools (NCES district)
- District
- Rains ISD
- NCES district ID
- 4836360
- Math proficiency
- 22% ▼ -20.00%
- Reading proficiency
- 30% ▼ -10.00%
- Median HH income
- $45,836
- Composite
- 22.46/100
- National rank
- #8106
- State rank
- #697 of 826 in TX
Livability — Point
- Score
- 60/100
- State rank
- #1092
- US rank
- #19350
Category grades
Schools grade is shown separately in the Schools card above.
Census & demographics
- Census place
- Point, TX
- Population (ZIP)
- 4,290
Population outlook (Rains County) Hauer SSP2
- Today (2025)
- 11,516 people
- By 2030
- 11,610 · +0.8%
- By 2040
- 11,622 · +0.9%
- By 2050
- 11,329 · -1.6%
- By 2075
- 10,390 · -9.8%
- By 2100
- 8,809 · -23.5%
Race, ethnicity, and origin ACS 2023
- Neighborhood character
- Predominantly White (80%)
- Race & ethnicity
- White 80% Hispanic / Latino 13% Two or more races 11% Black 3%
- Hispanic origin (detail)
- Mexican 12%
- Common ancestry
- Iranian 3% Lithuanian 2% Slovak 1%
- Foreign-born
- 1% · Canada
- Languages at home
- 96% English-only · Spanish 3%
Political lean MEDSL · Rains
- 2024 margin
- Solid R (+72.9) · D 13.3% · R 86.2%
- 2008→2024 swing
- -23.4pp toward R · 2008: -49.5pp · 2024: -72.9pp
- All cycles
- 2024: R+72.9 2020: R+71.2 2016: R+71.3 2012: R+61.8 2008: R+49.5
Not yet ingested
- Civics
- —
Market trends
- HPI YoY
- ▼ -10.57%
- Current HPI
- 153.54
- Rent YoY
- —
- Metro
- —
- State GDP YoY
- ▲ 3.95%
- F500 in state
- 110
Industry mix (Fortune 500 HQ in TX)
| Industry | F500 HQs | Revenue |
|---|---|---|
| Energy | 16 | $1,198B |
|
||
| Technology | 5 | $198B |
|
||
| Engineering / Construction | 4 | $72B |
|
||
| Energy Services | 3 | $60B |
|
||
| Utilities | 3 | $41B |
|
||
| Healthcare | 2 | $330B |
|
||
Price history
-25.4% since first listed3 events — show timeline
- 2026-06-02 Price Changed $44,000 NTREIS
- 2026-04-07 Listed $59,000 NTREIS
- 1998-03-31 Sold (Public Records) — Public Records
Property tax history
+6.6%/yrLatest (2025): $1,424 · +7.4% YoY. Source: county tax records.
Cash-flow waterfall
monthlySold comps — $/sqft
last 12 mo · ≤1 miLoading sold comps…