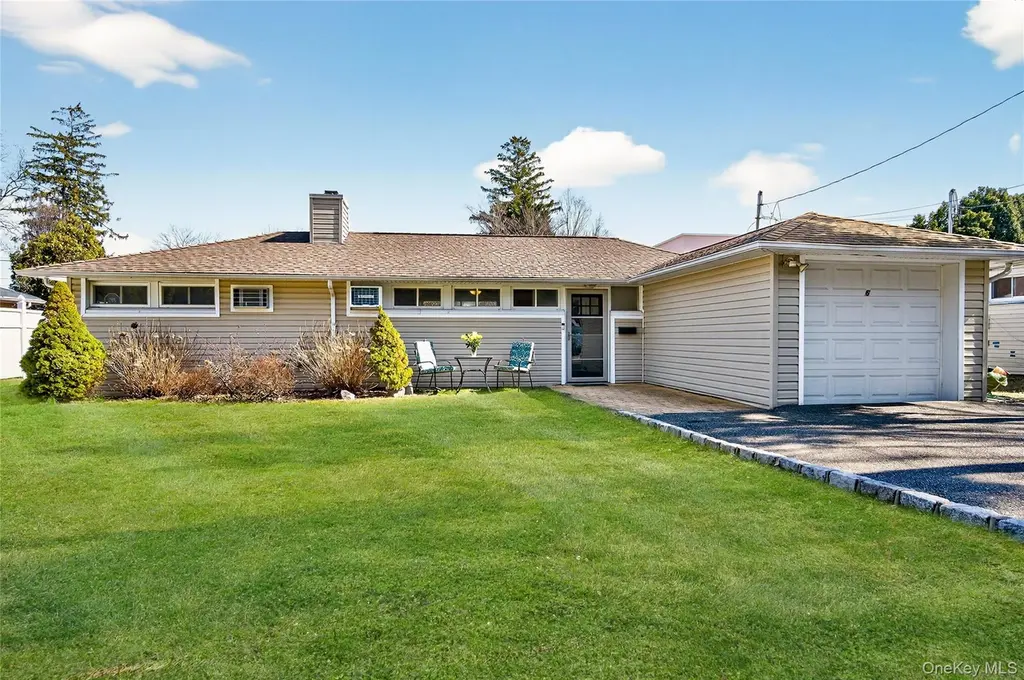
6 Wellington Rd · Greenvale, NY
Flood risk 4/10 · Minor
- FEMA flood zone
- X (unshaded)
- Chance of flooding over 30 yrs
- 0.22%
- Est. flood insurance / yr
- $507 – $1,088
Fire risk 2/10 · Minimal
- Est. fire insurance / yr
- $691 – $1,283
Heat risk 6/10 · Moderate
- Hot days now (above 98°F)
- 7 days/yr
- Hot days in 30 yrs
- 17 days/yr
Wind risk 6/10 · Moderate
- Chance of severe wind over 30 yrs
- 52.0%
Air-quality risk 4/10 · Minor
- Unhealthy air days now
- 4 days/yr
- Unhealthy air days in 30 yrs
- 5 days/yr
Risk factors via First Street. Map © Google.
Why this score? — see what drove the D- grade
The composite is a weighted blend of 9 inputs, each scored 0–100. Each bar is that input's sub-score; the figure is the points it added to the 100-point composite (weight × sub-score).
- Appreciation +7.7/10.0
- Schools +7.7/10.0
- Cash flow +7.2/30.0
- ARV discount +4.1/15.0
- Livability +3.9/5.0
- Rent growth +2.5/5.0
- Condition / age +2.5/5.0
- 1% rule +1.7/10.0
- DSCR +1.4/10.0
$848,000
🖨 Deal sheet (PDF) 📄 Offer letter ✓ Due diligence
Listing remarks
Welcome to 6 Wellington Road, Greenvale – Located in the Roslyn Union Free School District. Nestled mid-block on a private cul-de-sac in the heart of Greenvale, this sun-drenched and beautifully maintained ranch offers effortless one-level living in true move-in condition. Designed with comfort and functionality in mind, the home features an open floor plan with an inviting Living Room and Dining Room highlighted by cathedral ceilings and a cozy wood-burning fireplace — perfect for everyday living and elegant entertaining. The spacious eat-in kitchen boasts brand-new stainless-steel appliances and generous space for gathering. The home includes a spacious primary bedroom, two ad
Key facts
- Open floor plan
- Laundry mud room
- Eat-in kitchen
Tags
Property features AI
Exterior
- Parking: Driveway; Garage (1 space)
- Utilities: PSEG electric service; Natural gas connected; Water connected; Cesspool sewer; Cable connected
- Home design: Single family residence; Living area reported from public records
- Construction: Aluminum siding construction; Crawl attic; No basement
- Exterior features: Aluminum siding; Not waterfront
Interior
- Kitchen: Cooktop; Gas cooktop; Gas oven; Dishwasher; Refrigerator; Freezer; Stainless steel appliances
- Bedrooms: Includes a bedroom on the first floor
- Bathrooms: 1 full bathroom
- Heating & cooling: Oil heating with baseboard radiators; Wall/window air conditioning units
- Interior features: First-floor bedroom; First-floor full bath; Cathedral ceilings; High ceilings; Eat-in kitchen; Storage
- Laundry & utility: Laundry room; Washer; Dryer
Neighborhood map
What this means for you Summary
Snapshot
- This is a 3-bed/1.0-bath single-family listed at $848k.
Deal economics
- At list price, monthly cash flow is $-1k ($-14k/yr) — negative.
- To cash-flow at today's rent, offer at most $640k (24.5% below list).
- To meet the 1% rule (rent ≥ 1% of price), the offer needs to be $571k (32.6% below list).
- Recommended offer: $571k (32.6% below list) — sets the bar for 1% rule.
Location & tenants
- Location reads 77/100 on livability (#204 in NY, #3,174 nationally) — a middle-class / working-renter tenant base. Strengths: crime A+, commute A+, employment A+; Watch: cost of living F, health & safety F.
- Roslyn Union Free School District (suburban): math 83% / reading 82% proficiency, ranked #28 of 590 in NY (top 5%) — strong family-tenant draw, lease renewals of 3-5y typical; only 8% free/reduced lunch — higher-income household profile.
- Zoned schools: Harbor Hill School (math 83% / reading 82%, grade A+, #133 of 2,108 statewide, top 6%, 584 students, 10% FRL); Roslyn Middle School (math 78% / reading 82%, grade A+, #28 of 729 statewide, top 4%, 766 students, 16% FRL); Roslyn High School (math 97% / reading 87%, grade A+, #171 of 1,100 statewide, top 18%, 1,035 students, 15% FRL).
- Market conditions: 10 active listings in the ZIP; 11 comparable units currently listed for rent nearby; rentals leasing fast (median 5d on market — plan ~1-2 weeks tenant-placement turnaround); 824 units permitted in Nassau County in 2024 (153 in 5+ unit buildings).
Forward outlook
- In year one you build about $52k of equity ($6k loan paydown + $46k appreciation (5.4% local appreciation)).
- Nassau County population projected at +7% by 2050 — modest demand growth; plan on rents tracking national, not racing it.
- By year 2, paydown + projected appreciation supports a ~$83k cash-out refi (75% LTV) — recoverable capital for the next deal without selling this one.
Negotiation context
- It's been on market 49 days — a 3% lower offer ($823k) is reasonable based on typical stale-listing flexibility.
- Current owner paid $210k; list at $848k implies a 304% gain — meaningful room to come down on a strong offer.
Risks & watch-outs
- Watch-outs: built in 1947 — expect roof / HVAC / electrical / plumbing capex.
- Climate carrying-cost: major wind risk, 52% chance of damaging wind over 30y; extreme-heat days projected 7→17/yr by 2055 (HVAC capex compounding) — expect insurance premiums to compound above CPI over the hold.
Questions for the listing agent
- What do current leases actually rent for vs. the listed asking? Can we see a recent rent roll and the last 12 months of T-12 income?
- It's been on market 49 days. Have you received any prior offers? Is the seller open to a 33% concession, seller financing, or rate buy-down credit?
- Built in 1947 — when were the roof, HVAC, electrical panel, plumbing, and water heater last replaced?
- Is there a deadline driving the sale (1031 exchange, divorce, estate, relocation)? That informs how much negotiation room exists.
- Schools are A-rated — typically a magnet for longer-tenancy family renters. What's the average tenant stay here, and is there a school-zone premium baked into asking?
- The area grade is low — what's the realistic commute time and amenity access for the typical tenant pool here? Any planned neighborhood developments (good or bad) we should know about?
- What's the average days-on-market for RENTAL listings here right now (not sales)? A rising rental-DOM trend means longer vacancies and softer asking-rent achievability than the comps imply.
- What's the recent tenant-quality profile in this submarket — average credit score on applications, eviction rate, late-payment / NSF rate, and stable-employment percentage? A property-management company in the area should have these aggregated.
- How much new for-sale + rental construction is in the pipeline within 1–3 miles? Heavy new supply typically softens prices + rents 12–24 months out; constrained supply supports both.
Investment metrics
- 1% rule
- 0.67% ✗
- Cap rate
- 4.63%
- Cash-on-cash
- -5.95%
- DSCR
- 0.74
- GRM
- 12.4
CMA / ARV
- ARV (on-the-fly)
- $789,113
- Comps found
- 6
Show comp detail 6 sales within ~0.75 mi
| Address | Dist | Beds/Ba | Sqft | Sold | Price | $/sf | Match |
|---|---|---|---|---|---|---|---|
| 15 Wellington Rd | 0.06mi | 3/1.5 | 1,265 (-4%) | 7mo | $760,000 | $601 | 83 |
| 37 Wellington Rd | 0.16mi | 3/1.0 | 1,275 (-3%) | 11mo | $565,000 | $443 | 79 |
| 39 Wellington Rd | 0.16mi | 3/1.5 | 1,359 (+4%) | 10mo | $830,000 | $611 | 76 |
| 4 Elm St | 0.26mi | 3/2.0 | 1,380 (+5%) | 4mo | $875,000 | $634 | 72 |
| 11 Waldo Ave | 0.26mi | 4/1.5 (+1) | 1,456 (+11%) | 2mo | $715,000 | $491 | 61 |
| 9 West St | 0.36mi | 4/2.0 (+1) | 1,494 (+14%) | 0mo | $870,000 | $582 | 51 |
Match score weights: distance 35% · size 25% · config 20% · recency 20%. Top-matched comps best support the ARV.
Projected returns pro-forma
5.43% appreciation · 3.0% rent growth · sell at horizon
- IRR
- 9.0%
- Equity multiple
- 1.60×
- Total profit
- $141,443
- Equity at exit
- $502,926
- IRR
- 10.6%
- Equity multiple
- 3.04×
- Total profit
- $483,250
- Equity at exit
- $887,072
Cash invested: $237,440 (down + closing). Projections, not guarantees.
Landlord ↔ Tenant lean methodology
- Overall (STATE)
- 15 Strongly Tenant-Friendly
- State New York
- 15 Strongly Tenant-Friendly · D+10
- County
- — inherits STATE
- City
- — inherits STATE
ZIP-level market 11548
- Home prices YoY
- 2.0%
- Active inventory
- 10
- Price-to-rent
- 12.4×
Monthly cashflow live
- Estimated rent
- $5,714 high interval (Pro) →
- Mortgage (P&I)
- −$4,447
- Tax from tax record
- −$892 /mo · $10,705/yr
- Insurance
- −$353
- HOA
- −$0
- Vacancy / Maint / Mgmt
- −$1,200
- Net cashflow
- $-1,178
Break-even live
Sensitivity live
| Price | -10% $-698 | -5% $-938 | +0% $-1,178 | +5% $-1,418 | +10% $-1,658 |
|---|---|---|---|---|---|
| Rent | -10% $-1,629 | -5% $-1,404 | +0% $-1,178 | +5% $-952 | +10% $-727 |
| Rate | -1.0pp $-751 | -0.5pp $-962 | base $-1,178 | +0.5pp $-1,398 | +1.0pp $-1,621 |
UW: 25.0% down · 7.5% · 30yr · 1.5% tax · 5.0% vac · 8.0% maint · 8.0% mgmt
Financing live
Cash to close
- Down payment
- $212,000
- Closing costs
- $25,440
- Reserves months
- —
- Total cash needed
- —
Loan-product check · same deal, 3 products live
Conventional
25% down · 7.5% · 30yr
- Down + closing
- —
- Monthly P&I
- —
- Monthly cashflow
- —
- DSCR
- —
- Eligible?
- —
Personal DTI + credit; lowest rate.
DSCR
20% down · 8.5% · 30yr
- Down + closing
- —
- Monthly P&I
- —
- Monthly cashflow
- —
- DSCR
- —
- Eligible?
- —
No personal income docs; deal must DSCR.
Hard money
10% down · 12.0% · 12mo
- Down + closing
- —
- Monthly P&I
- —
- Monthly cashflow
- —
- DSCR
- —
- Eligible?
- —
Short-term bridge; refi at stabilization.
Rent comps 11 comps
| Address | Beds | Baths | Sqft | Rent | $/sqft | DOM | Units | Dist |
|---|---|---|---|---|---|---|---|---|
| 1026 Glen Cove Ave Glen Head, NY | 4.0 | 1.0 | 1165 | $4,200 | $3.61 | 0d | 1 | 0.78mi |
| 61 Bryant Ave Roslyn, NY | 2.0 | 2.0 | 1220 | $6,875 | $5.64 | 0d | 1 | 1.00mi |
| 36 Coolidge Ave Glen Head, NY | 3.0 | 1.0 | 1410 | $4,600 | $3.26 | 26d | 1 | 1.00mi |
| 24 Skillman St Unit Lower Roslyn, NY | 2.0 | 2.0 | 1250 | $4,950 | $3.96 | 4d | 1 | 1.07mi |
| 1353 Old Northern Blvd Roslyn, NY | 3.0 | 2.0 | 1200 | $4,750 | $3.96 | 45d | 1 | 1.20mi |
| 41 Woodbine Rd Roslyn Heights, NY | 4.0 | 2.0 | 1769 | $6,000 | $3.39 | 22d | 1 | 1.30mi |
| 94 Main St Roslyn, NY | 3.0 | 2.5 | 1462 | $9,200 | $6.29 | 0d | 1 | 1.32mi |
| 15 Hicks St Roslyn, NY | 2.0 | 2.0 | 1200 | $5,450 | $4.54 | 45d | 1 | 1.42mi |
| 333 Warner Ave Unit 316 Roslyn Heights, NY | 2.0 | 2.5 | 1784 | $7,850 | $4.40 | 4d | 1 | 1.42mi |
| 333 Warner Ave Unit 210 Roslyn Heights, NY | 2.0 | 2.0 | 1158 | $6,000 | $5.18 | 45d | 1 | 1.42mi |
| 300 Edwards St Roslyn, NY | 1.0–2.0 | 1.0–2.0 | 1250 | $4,904 | $3.92 | 0d | 1 | 1.42mi |
Listing history 4 events
-
2026-04-30status Pending
-
2026-03-12$848,000 Active
-
1999-11-04soldstatus $210,000
-
1995-03-10soldstatus $155,000
ⓘ Source: listings_history table (triggers on properties + properties_extension) + one-shot
backfill from property_details.listing_events for pre-trigger history.
Tax reassessment forecast NY · Partial reset (capped growth)
- Current annual tax
- $10,705 · $892/mo
- Projected year-2 tax
- $12,518 · $1,043/mo
- Expected delta
- +$1,813/yr (+$151/mo · 16.9%)
ⓘ Screening estimate from a state-policy table — verify with the county assessor before closing.
Climate risk First Street
- Flood 4/10 Moderate FEMA zone X (unshaded) · 22% chance over 30 yrs
- Wildfire 2/10 Low
- Heat 6/10 Major 7 d/yr ≥98°F today · 17 d/yr by 30 yrs out
- Wind 6/10 Major 52% chance of damaging wind over 30 yrs
- Air quality 4/10 Moderate 4 unhealthy d/yr today · 5 by 30 yrs out
Nearby sold comps map
Loading sold comps map…
Walkable amenities ~0.75 mi
Loading nearby amenities…
Taxation est. · year 1
- Rental income
- $68,574
- − Mortgage interest
- −$47,501
- − Property taxes
- −$10,705
- − Insurance
- −$4,240
- − Repairs & maintenance
- −$5,486
- − Management
- −$5,486
- − Depreciation
- −$24,669
- Taxable loss
- −$29,513
- Est. tax savings @ 24.0%
- +$7,083
- After-tax cash flow
- $-7,052/yr
For passive investors: Depreciation is non-cash, so a rental often shows a tax loss while cash-flowing — sheltering income. Rental losses are passive: they offset passive income freely, and up to $25,000/yr can offset ordinary (W-2) income if you actively participate and your MAGI is under $100k (phasing out to $0 by $150k); unused losses carry forward. On sale, claimed depreciation is recaptured at up to 25%, and gains may owe capital-gains tax (a 1031 exchange can defer both). Figures are a year-1 estimate at your 24.0% rate — not tax advice; consult a CPA.
Schools (NCES district)
- District
- Roslyn Union Free School District
- NCES district ID
- 3625050
- Math proficiency
- 83% ▼ -2.00%
- Reading proficiency
- 82% ▲ 3.00%
- Median HH income
- $128,640
- Composite
- 77.26/100
- National rank
- #101
- State rank
- #28 of 590 in NY
Livability — Greenvale
- Score
- 77/100
- State rank
- #204
- US rank
- #3174
Category grades
Schools grade is shown separately in the Schools card above.
Census & demographics
- Census place
- Greenvale, NY
- Population (ZIP)
- 2,171
Population outlook (Nassau County) Hauer SSP2
- Today (2025)
- 1,409,302 people
- By 2030
- 1,431,482 · +1.6%
- By 2040
- 1,471,607 · +4.4%
- By 2050
- 1,502,845 · +6.6%
- By 2075
- 1,575,403 · +11.8%
- By 2100
- 1,554,356 · +10.3%
Race, ethnicity, and origin ACS 2023
- Neighborhood character
- Predominantly White (71%)
- Race & ethnicity
- White 71% Asian 17% Hispanic / Latino 5% Black 5% Two or more races 3%
- Common ancestry
- Scotch-Irish 5% Romanian 3% Subsaharan African 1%
- Foreign-born
- 36% · China, Canada, South Korea
- Languages at home
- 66% English-only · Chinese 11% Other Indo-European 9% Russian/Polish/Slavic 5%
Political lean MEDSL · Nassau
- 2024 margin
- Toss-up / Even · D 47.9% · R 52.1%
- 2008→2024 swing
- -12.6pp toward R · 2008: 8.4pp · 2024: -4.2pp
- All cycles
- 2024: R+4.2 2020: D+9.5 2016: D+5.3 2012: D+6.7 2008: D+8.4
Not yet ingested
- Civics
- —
Market trends
- HPI YoY
- ▲ 5.43%
- Current HPI
- 273.4132
- Rent YoY
- —
- Metro
- —
- State GDP YoY
- ▲ 2.60%
- F500 in state
- 92
Industry mix (Fortune 500 HQ in NY)
| Industry | F500 HQs | Revenue |
|---|---|---|
| Financial Services | 10 | $950B |
|
||
| Consumer Goods | 9 | $162B |
|
||
| Insurance | 4 | $225B |
|
||
| Telecommunications | 2 | $144B |
|
||
| Pharmaceuticals | 2 | $112B |
|
||
| Media / Entertainment | 2 | $69B |
|
||
Price history
+447.1% since first listed4 events — show timeline
- 2026-04-30 Pending — OneKey® MLS as Distributed by MLS Grid
- 2026-03-12 Listed $848,000 OneKey® MLS as Distributed by MLS Grid
- 1999-11-04 Sold (Public Records) $210,000 Public Records
- 1995-03-10 Sold (Public Records) $155,000 Public Records
Property tax history
+1.8%/yrLatest (2024): $10,705 · +8.2% YoY. Source: county tax records.
Cash-flow waterfall
monthlySold comps — $/sqft
last 12 mo · ≤1 miLoading sold comps…