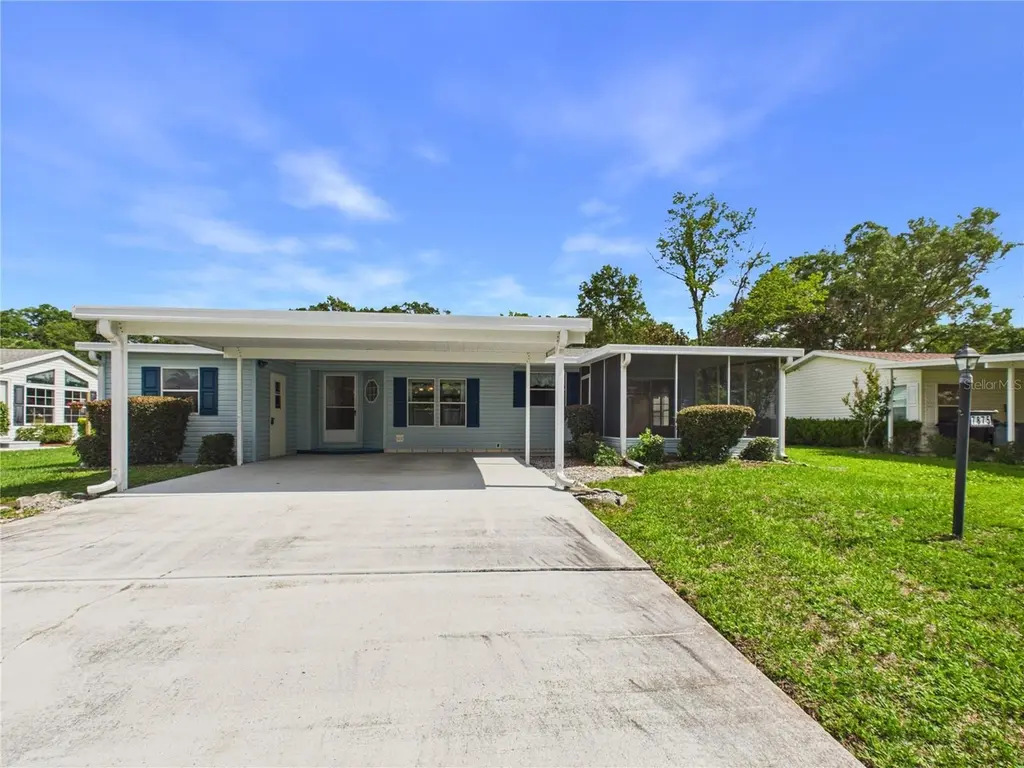
7875 SW 5th Pl · Ocala, FL
Flood risk 1/10 · Minimal
- FEMA flood zone
- X (unshaded)
- Chance of flooding over 30 yrs
- 0.0%
- Est. flood insurance / yr
- $507 – $1,088
Fire risk 5/10 · Moderate
- Est. fire insurance / yr
- $947 – $1,759
Heat risk 8/10 · Major
- Hot days now (above 107°F)
- 7 days/yr
- Hot days in 30 yrs
- 21 days/yr
Wind risk 9/10 · Severe
- Chance of severe wind over 30 yrs
- 99.0%
Air-quality risk 3/10 · Minor
- Unhealthy air days now
- 3 days/yr
- Unhealthy air days in 30 yrs
- 3 days/yr
Risk factors via First Street. Map © Google.
Why this score? — see what drove the B- grade
The composite is a weighted blend of 9 inputs, each scored 0–100. Each bar is that input's sub-score; the figure is the points it added to the 100-point composite (weight × sub-score).
- Cash flow +30.0/30.0
- DSCR +10.0/10.0
- 1% rule +9.9/10.0
- ARV discount +7.5/15.0
- Schools +3.6/10.0
- Livability +3.5/5.0
- Rent growth +2.5/5.0
- Condition / age +2.5/5.0
- Appreciation +0.0/10.0
$140,000
🖨 Deal sheet (PDF) 📄 Offer letter ✓ Due diligence
Listing remarks
Welcome home to 7875 SW 5th Pl in The Falls of Ocala! This charming 2-bedroom, 2-bath manufactured home offers a desirable split floor plan with comfortable flow throughout. Enjoy peaceful mornings and evenings on the front screened lanai, plus extra storage in the carport utility room. Located in a 55+ community with low HOA fees and access to a community pool, this home is conveniently close to dining, medical facilities, shopping, and everyday essentials. Built by Skyline in 2000, with a 2020 roof, 2017 HVAC, and reverse osmosis system. Schedule your private showing today!
Key facts
- Extra storage
- Community pool
- Split floor plan
Tags
Property features AI
Finance
- Other: Total acreage: less than 1/4 acre (approx. 0.17 acres)
- Financial info: Lease restrictions apply
- HOA & community: HOA managed by MEB Real Estate; Monthly HOA fee of $200; HOA covers common area taxes, pool, sewer, trash and water; Community pool; Senior community; Pets allowed
Exterior
- Parking: Carport with 2 spaces
- Utilities: Public water; Public sewer; Electricity connected; Cable connected; Sewer connected; Water connected
- Home design: Manufactured double-wide home; One level; Faces south; PUD zoning; Homestead property
- Construction: Vinyl siding; Shingle roof; Pillar/post/pier foundation; Built as a manufactured home (double wide)
- Exterior features: Paved road access; Other exterior features
Interior
- Kitchen: Dishwasher; Microwave; Range
- Bedrooms: 2 bedrooms
- Flooring: Carpet; Vinyl
- Bathrooms: 2 full bathrooms
- Heating & cooling: Central heating; Central air conditioning
- Interior features: Living room and dining room combo; Split bedroom layout; Sliding doors
- Laundry & utility: Indoor laundry
Neighborhood map
What this means for you Summary
Snapshot
- This is a 2-bed/2.0-bath manufactured listed at $140k.
Deal economics
- At list price, monthly cash flow is $583 ($7k/yr) — positive.
- The deal already cash-flows at list — no discount required.
- Meets the 1% rule at list price ($2k rent vs $140k).
- Recommended offer: $138k (1.5% below list) — sets the bar for market timing.
- Cap rate 11.3% vs local median 4.2% in Ocala — top-decile yield for the area; either an underpriced asset or a hidden risk that comps aren't pricing in. Stress-test before assuming the spread holds.
Location & tenants
- Location reads 69/100 on livability (#476 in FL) — a middle-class / working-renter tenant base. Strengths: cost of living A+, housing A+, health & safety A+; Watch: crime F, amenities F, commute F.
- Marion (rural): math 42% / reading 43% proficiency, ranked #61 of 73 in FL (top 84%) — families likely to look elsewhere, expect single-tenant / working-renter base with shorter leases; 61% free/reduced lunch — lower-income household profile, screen leases tightly.
- Market conditions: Rents flat; 295 active listings in the ZIP; 4 comparable units currently listed for rent nearby; rentals at typical pace (median 22d on market — plan ~3-4 weeks tenant-placement turnaround); 7,071 units permitted in Marion County in 2024 (534 in 5+ unit buildings).
- This rent runs 38% of the median local income ($65k/yr) — at the standard rent-burdened threshold; future hikes will face affordability resistance.
Forward outlook
- Local home prices are declining (-3.0%/yr); year-one equity from $968 of loan paydown is wiped out by about $4k of value loss. Plan a longer hold.
- Marion County population projected at +13% by 2050 — modest demand growth; plan on rents tracking national, not racing it.
- At projected returns (-3.0% appreciation + 0.1% rent growth), your $39k cash investment doubles in ~10 years — after that, you're playing with house money.
Negotiation context
- It's been on market 20 days — a 2% lower offer ($138k) is reasonable based on typical stale-listing flexibility.
- Current owner paid $28k; list at $140k implies a 409% gain — meaningful room to come down on a strong offer.
Risks & watch-outs
- Climate carrying-cost: severe wind risk, 99% chance of damaging wind over 30y; moderate wildfire risk; extreme-heat days projected 7→21/yr by 2055 (HVAC capex compounding) — expect insurance premiums to compound above CPI over the hold.
Questions for the listing agent
- What does the HOA fee cover, when was the last increase, and are there any pending special assessments or reserve-fund shortfalls?
- Is there a deadline driving the sale (1031 exchange, divorce, estate, relocation)? That informs how much negotiation room exists.
- Crime grade is F in this area — have there been break-ins, vandalism, or insurance claims at this property in the last 3 years? What carrier currently insures it and at what premium?
- What's the average days-on-market for RENTAL listings here right now (not sales)? A rising rental-DOM trend means longer vacancies and softer asking-rent achievability than the comps imply.
- What's the recent tenant-quality profile in this submarket — average credit score on applications, eviction rate, late-payment / NSF rate, and stable-employment percentage? A property-management company in the area should have these aggregated.
- How much new for-sale + rental construction is in the pipeline within 1–3 miles? Heavy new supply typically softens prices + rents 12–24 months out; constrained supply supports both.
Investment metrics
- 1% rule
- 1.49% ✓
- Cap rate
- 11.29%
- Cash-on-cash
- 17.85%
- DSCR
- 1.79
- GRM
- 5.6
CMA / ARV
No comps found within radius.
Projected returns pro-forma
-3.0% appreciation · 0.12% rent growth · sell at horizon
- IRR
- 5.9%
- Equity multiple
- 1.22×
- Total profit
- $8,687
- Equity at exit
- $20,874
- IRR
- 12.4%
- Equity multiple
- 1.84×
- Total profit
- $33,054
- Equity at exit
- $12,105
Cash invested: $39,200 (down + closing). Projections, not guarantees.
Landlord ↔ Tenant lean methodology
- Overall (STATE)
- 87 Strongly Landlord-Friendly
- State Florida
- 87 Strongly Landlord-Friendly · R+3
- County
- — inherits STATE
- City
- — inherits STATE
ZIP-level market 34474
- Home prices YoY
- -28.4%
- Rents YoY
- 0.1%
- Active inventory
- 295
- Price-to-rent
- 5.6×
Monthly cashflow live
- Estimated rent
- $2,080 medium interval (Pro) →
- Mortgage (P&I)
- −$734
- Tax from tax record
- −$68 /mo · $812/yr
- Insurance
- −$58
- HOA
- −$200
- Vacancy / Maint / Mgmt
- −$437
- Net cashflow
- $583
Break-even live
Sensitivity live
| Price | -10% $662 | -5% $623 | +0% $583 | +5% $544 | +10% $504 |
|---|---|---|---|---|---|
| Rent | -10% $419 | -5% $501 | +0% $583 | +5% $665 | +10% $748 |
| Rate | -1.0pp $654 | -0.5pp $619 | base $583 | +0.5pp $547 | +1.0pp $510 |
UW: 25.0% down · 7.5% · 30yr · 1.5% tax · 5.0% vac · 8.0% maint · 8.0% mgmt
Financing live
Cash to close
- Down payment
- $35,000
- Closing costs
- $4,200
- Reserves months
- —
- Total cash needed
- —
Loan-product check · same deal, 3 products live
Conventional
25% down · 7.5% · 30yr
- Down + closing
- —
- Monthly P&I
- —
- Monthly cashflow
- —
- DSCR
- —
- Eligible?
- —
Personal DTI + credit; lowest rate.
DSCR
20% down · 8.5% · 30yr
- Down + closing
- —
- Monthly P&I
- —
- Monthly cashflow
- —
- DSCR
- —
- Eligible?
- —
No personal income docs; deal must DSCR.
Hard money
10% down · 12.0% · 12mo
- Down + closing
- —
- Monthly P&I
- —
- Monthly cashflow
- —
- DSCR
- —
- Eligible?
- —
Short-term bridge; refi at stabilization.
Rent comps 4 comps
| Address | Beds | Baths | Sqft | Rent | $/sqft | DOM | Units | Dist |
|---|---|---|---|---|---|---|---|---|
| 238 NW 76th Ter Ocala, FL | 3.0 | 2.0 | 1000 | $1,750 | $1.75 | 22d | 1 | 0.52mi |
| 7640 SW 14th St Ocala, FL | 3.0 | 2.0 | 1173 | $1,699 | $1.45 | 22d | 1 | 0.64mi |
| 7710 NW 14th St Ocala, FL | 3.0 | 3.0 | 1521 | $4,500 | $2.96 | 22d | 1 | 1.24mi |
| 7444 NW 14th St Ocala, FL | 1.0 | 1.5 | 1000 | $2,500 | $2.50 | 22d | 1 | 1.32mi |
HOA detail
- Monthly dues
- $200 · $2,400/yr
- Likely covers
- pool
Listing history 17 events
-
2026-06-18days on market $140,000 Active 20 DOM
-
2026-06-17days on market $140,000 Active 19 DOM
-
2026-06-16days on market $140,000 Active 18 DOM
-
2026-06-15days on market $140,000 Active 17 DOM
-
2026-06-14days on market $140,000 Active 15 DOM
-
2026-06-13days on market $140,000 Active 14 DOM
-
2026-06-10days on market $140,000 Active 12 DOM
-
2026-06-09days on market $140,000 Active 11 DOM
-
2026-06-08days on market $140,000 Active 10 DOM
-
2026-06-07days on market $140,000 Active 9 DOM
-
2026-06-03days on market $140,000 Active 5 DOM
-
2026-06-02days on market $140,000 Active 4 DOM
-
2026-06-01days on market $140,000 Active 3 DOM
-
2026-05-31days on market $140,000 Active 2 DOM
-
2026-05-29$140,000 Active
-
2005-09-30soldstatus $27,500
-
2003-12-17soldstatus $600,000
ⓘ Source: listings_history table (triggers on properties + properties_extension) + one-shot
backfill from property_details.listing_events for pre-trigger history.
Tax reassessment forecast FL · Resets to sale price
- Current annual tax
- $812 · $68/mo
- Projected year-2 tax
- $1,162 · $97/mo
- Expected delta
- +$350/yr (+$29/mo · 43.1%)
ⓘ Screening estimate from a state-policy table — verify with the county assessor before closing.
Climate risk First Street
- Flood 1/10 Low FEMA zone X (unshaded) · 0% chance over 30 yrs
- Wildfire 5/10 Major
- Heat 8/10 Severe 7 d/yr ≥107°F today · 21 d/yr by 30 yrs out
- Wind 9/10 Extreme 99% chance of damaging wind over 30 yrs
- Air quality 3/10 Moderate 3 unhealthy d/yr today · 3 by 30 yrs out
Nearby sold comps map
Loading sold comps map…
Walkable amenities ~0.75 mi
Loading nearby amenities…
Taxation est. · year 1
- Rental income
- $24,963
- − Mortgage interest
- −$7,842
- − Property taxes
- −$812
- − Insurance
- −$700
- − Repairs & maintenance
- −$1,997
- − Management
- −$1,997
- − HOA
- −$2,400
- − Depreciation
- −$4,073
- Taxable income
- $5,142
- Est. tax owed @ 24.0%
- −$1,234
- After-tax cash flow
- $5,764/yr
For passive investors: Depreciation is non-cash, so a rental often shows a tax loss while cash-flowing — sheltering income. Rental losses are passive: they offset passive income freely, and up to $25,000/yr can offset ordinary (W-2) income if you actively participate and your MAGI is under $100k (phasing out to $0 by $150k); unused losses carry forward. On sale, claimed depreciation is recaptured at up to 25%, and gains may owe capital-gains tax (a 1031 exchange can defer both). Figures are a year-1 estimate at your 24.0% rate — not tax advice; consult a CPA.
Schools (NCES district)
- District
- Marion
- NCES district ID
- 1201260
- Math proficiency
- 42% ▼ -7.00%
- Reading proficiency
- 43% ▼ -4.00%
- Median HH income
- $40,015
- Composite
- 35.61/100
- National rank
- #4890
- State rank
- #61 of 73 in FL
Livability — Ocala
- Score
- 69/100
- State rank
- #476
- US rank
- #8461
Category grades
Schools grade is shown separately in the Schools card above.
Census & demographics
- County
- Marion County · 315,796 people
- City population
- 263,375
- Metro
- Ocala, FL
- Population (ZIP)
- 20,258
- Household income
- $65,291
- Rent vs Own
- Severe rent burden
- 1062.0
Population outlook (Marion County) Hauer SSP2
- Today (2025)
- 365,905 people
- By 2030
- 376,768 · +3.0%
- By 2040
- 396,555 · +8.4%
- By 2050
- 412,723 · +12.8%
- By 2075
- 446,090 · +21.9%
- By 2100
- 436,193 · +19.2%
Race, ethnicity, and origin ACS 2023
- Neighborhood character
- Diverse neighborhood (Simpson 0.64)
- Race & ethnicity
- White 52% Hispanic / Latino 25% Black 13% Two or more races 8% Asian 8%
- Hispanic origin (detail)
- Mexican 2% Puerto Rican 10%
- Common ancestry
- Lithuanian 2% Romanian 2% Slovak 1%
- Foreign-born
- 21% · Canada, Jamaica, Vietnam
- Languages at home
- 71% English-only · Spanish 22% Other Indo-European 4% Vietnamese 1%
Political lean MEDSL · Marion
- 2024 margin
- Solid R (+31.6) · D 33.8% · R 65.5%
- 2008→2024 swing
- -20.0pp toward R · 2008: -11.6pp · 2024: -31.6pp
- All cycles
- 2024: R+31.6 2020: R+25.9 2016: R+26.2 2012: R+16.2 2008: R+11.6
Not yet ingested
- Civics
- —
Market trends
- HPI YoY
- ▼ -78.16%
- Current HPI
- 196.5607
- Rent YoY
- ▲ 0.12%
- Metro
- Ocala, FL
- State GDP YoY
- ▲ 3.28%
- F500 in state
- 36
Industry mix (Fortune 500 HQ in FL)
| Industry | F500 HQs | Revenue |
|---|---|---|
| Industrial Technology | 2 | $29B |
|
||
| Insurance | 2 | $17B |
|
||
| Retail | 1 | $60B |
|
||
| Technology Distribution | 1 | $58B |
|
||
| Homebuilding | 1 | $35B |
|
||
| Technology Manufacturing | 1 | $35B |
|
||
Price history
-76.7% since first listed3 events — show timeline
- 2026-05-29 Listed $140,000 Stellar MLS as Distributed by MLS Grid
- 2005-09-30 Sold (Public Records) $27,500 Public Records
- 2003-12-17 Sold (Public Records) $600,000 Public Records
Property tax history
+6.0%/yrLatest (2025): $812 · +38.6% YoY. Source: county tax records.
Cash-flow waterfall
monthlySold comps — $/sqft
last 12 mo · ≤1 miLoading sold comps…