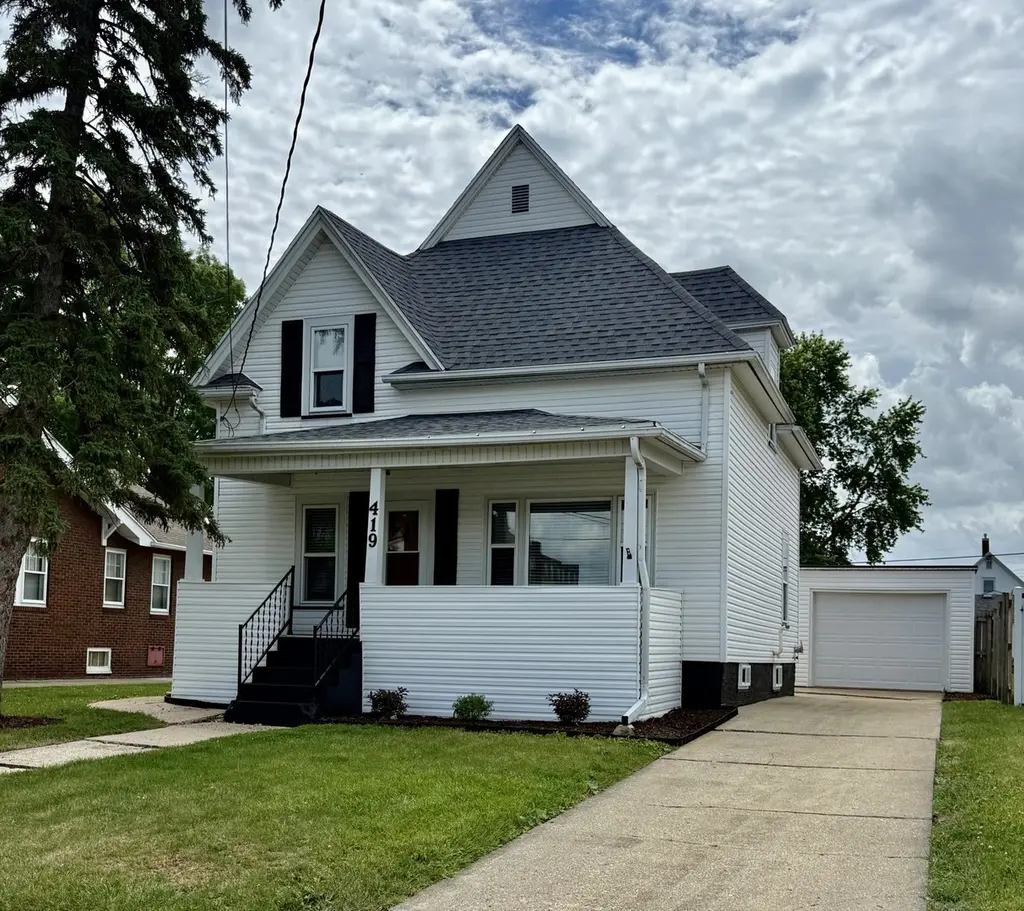
419 Rockwell St · Kewanee, IL
Flood risk 1/10 · Minimal
- FEMA flood zone
- X (unshaded)
- Chance of flooding over 30 yrs
- 0.0%
- Est. flood insurance / yr
- $473 – $860
Fire risk 1/10 · Minimal
- Est. fire insurance / yr
- $804 – $1,492
Heat risk 3/10 · Minor
- Hot days now (above 103°F)
- 7 days/yr
- Hot days in 30 yrs
- 17 days/yr
Wind risk 2/10 · Minimal
- Chance of severe wind over 30 yrs
- —
Air-quality risk 3/10 · Minor
- Unhealthy air days now
- 2 days/yr
- Unhealthy air days in 30 yrs
- 3 days/yr
Risk factors via First Street. Map © Google.
Why this score? — see what drove the C grade
The composite is a weighted blend of 9 inputs, each scored 0–100. Each bar is that input's sub-score; the figure is the points it added to the 100-point composite (weight × sub-score).
- Cash flow +23.1/30.0
- ARV discount +11.3/15.0
- DSCR +7.4/10.0
- 1% rule +6.7/10.0
- Livability +3.5/5.0
- Rent growth +2.5/5.0
- Condition / age +2.5/5.0
- Schools +1.2/10.0
- Appreciation +0.0/10.0
$90,000
🖨 Deal sheet (PDF) 📄 Offer letter ✓ Due diligence
Listing remarks
Charming 3-bedroom home with plenty of character & space. The main floor features: 1st floor bedroom, open living/ dining room, a bright & inviting kitchen w/ lots of white cabinetry & beautiful granite countertops! Upstairs you will find an updated bath & a tandem bedroom offering flexible options for sleeping quarters, dressing room or office area! Enjoy relaxing on the front porch, perfect for your morning coffee or unwinding in the evening! Outside, the spacious yard provides plenty of room for gardening, pets & outdoor gatherings! A detached 1- car garage adds extra storage & convenience. Don't miss the opportunity to make this well- maintained home
Key facts
- 1st floor bedroom
- Updated bath
- 8,120 sq ft lot
Tags
Property features AI
Finance
- Other: Property is in unincorporated Kewanee; Directions: From Main St, turn onto W Prospect St, then left onto Beach St. Turn left onto Rockwell; home is on the left.
- HOA & community: No master association fee required
Exterior
- Parking: Detached garage (1 garage space; 1 total parking space)
- Utilities: Public water; Public sewer
- Home design: Detached single-family home; 1.5-story design; House is over 100 years old; Living area measured by assessor
- Construction: Vinyl siding; Brick/mortar foundation; Asphalt and rubber roof
- Exterior features: Front porch; Level lot; Lot dimensions approximately 56 x 145
Interior
- Kitchen: Updated kitchen; Range; Refrigerator
- Bedrooms: 3 bedrooms (master on main; two additional bedrooms on second floor)
- Flooring: Hardwood in parts of the home; Luxury vinyl in kitchen and living room; Carpet in second-floor bedrooms
- Bathrooms: 1 full bathroom
- Heating & cooling: Natural gas forced-air heating; Central air conditioning
- Interior features: First-floor bedroom; Unfinished full basement; 5 total rooms
- Laundry & utility: Laundry room
Neighborhood map
What this means for you Summary
Snapshot
- This is a 3-bed/1.0-bath single-family listed at $90k.
Deal economics
- At list price, monthly cash flow is $161 ($2k/yr) — positive.
- The deal already cash-flows at list — no discount required.
- Meets the 1% rule at list price ($1k rent vs $90k).
Location & tenants
- Location reads 69/100 on livability (#409 in IL) — a middle-class / working-renter tenant base. Strengths: cost of living A+, health & safety A+, housing A; Watch: crime D-, amenities F, commute F.
- Kewanee CUSD 229 (town): math 8% / reading 20% proficiency, ranked #540 of 620 in IL (top 87%) — low school quality limits family demand, transient renter base, plan for 1-2y turnover; 73% free/reduced lunch — lower-income household profile, screen leases tightly.
- Zoned schools: Belle Alexander Elem School (254 students, 0% FRL); Central Elem (math 5% / reading 15%, grade F, #583 of 665 statewide, top 89%, 344 students, 0% FRL); Kewanee High School (math 8% / reading 17%, grade F, #506 of 693 statewide, top 74%, 581 students, 0% FRL) — zoned schools average 0% FRL vs 73% district-wide (73 pts lower); this property's tenant base skews higher-income than the district average.
- Market conditions: 39 active listings in the ZIP; 32 units permitted in Henry County in 2024 (0 in 5+ unit buildings).
Forward outlook
- Local home prices are declining (-3.0%/yr); year-one equity from $622 of loan paydown is wiped out by about $3k of value loss. Plan a longer hold.
- Henry County population projected at -16% by 2050 — secular population decline; favor cash flow + early exit over multi-decade hold.
Negotiation context
- Only 13 days on market — expect competitive offers; lowballing is unlikely to land.
Risks & watch-outs
- Watch-outs: built in 1899 — expect roof / HVAC / electrical / plumbing capex.
Questions for the listing agent
- Built in 1899 — when were the roof, HVAC, electrical panel, plumbing, and water heater last replaced?
- Is there a deadline driving the sale (1031 exchange, divorce, estate, relocation)? That informs how much negotiation room exists.
- Schools are F-rated, which usually means shorter tenancies and higher turnover. Who's the typical renter profile here, and what's been the actual vacancy rate?
- Crime grade is D in this area — have there been break-ins, vandalism, or insurance claims at this property in the last 3 years? What carrier currently insures it and at what premium?
- What's the average days-on-market for RENTAL listings here right now (not sales)? A rising rental-DOM trend means longer vacancies and softer asking-rent achievability than the comps imply.
- What's the recent tenant-quality profile in this submarket — average credit score on applications, eviction rate, late-payment / NSF rate, and stable-employment percentage? A property-management company in the area should have these aggregated.
- How much new for-sale + rental construction is in the pipeline within 1–3 miles? Heavy new supply typically softens prices + rents 12–24 months out; constrained supply supports both.
Investment metrics
- 1% rule
- 1.17% ✓
- Cap rate
- 8.44%
- Cash-on-cash
- 7.68%
- DSCR
- 1.34
- GRM
- 7.1
CMA / ARV
- ARV (on-the-fly)
- $98,358
- Comps found
- 12
Show comp detail 12 sales within ~0.75 mi
| Address | Dist | Beds/Ba | Sqft | Sold | Price | $/sf | Match |
|---|---|---|---|---|---|---|---|
| 136 W Mill St | 0.28mi | 3/1.0 | 1,039 (+2%) | 1mo | $107,000 | $103 | 82 |
| 236 W Mcclure St | 0.52mi | 3/1.0 | 1,002 (-1%) | 6mo | $9,000 | $9 | 69 |
| 218 W Mcclure St | 0.54mi | 3/2.0 | 1,008 (-1%) | 6mo | $152,000 | $151 | 65 |
| 110 N Park St | 0.51mi | 3/1.0 | 1,088 (+7%) | 2mo | $105,000 | $97 | 62 |
| 434 Payson St | 0.66mi | 3/1.0 | 988 (-3%) | 6mo | $122,500 | $124 | 60 |
| 716 Morton Ave | 0.47mi | 2/1.0 (-1) | 912 (-10%) | 2mo | $94,000 | $103 | 55 |
| 1208 Pine St | 0.53mi | 2/1.0 (-1) | 936 (-8%) | 4mo | $55,000 | $59 | 54 |
| 1202 W Prospect St | 0.54mi | 4/1.0 (+1) | 1,083 (+7%) | 6mo | $56,540 | $52 | 53 |
| 323 S Vine St | 0.66mi | 3/1.0 | 1,116 (+10%) | 0mo | $17,000 | $15 | 52 |
| 205 Ross St | 0.59mi | 3/1.0 | 884 (-13%) | 1mo | $58,000 | $66 | 50 |
| 416 Payson St | 0.62mi | 2/1.5 (-1) | 900 (-11%) | 2mo | $110,000 | $122 | 44 |
| 414 E Oak St | 0.65mi | 2/1.0 (-1) | 912 (-10%) | 8mo | $80,000 | $88 | 42 |
Match score weights: distance 35% · size 25% · config 20% · recency 20%. Top-matched comps best support the ARV.
Projected returns pro-forma
-3.0% appreciation · 3.0% rent growth · sell at horizon
- IRR
- -4.5%
- Equity multiple
- 0.83×
- Total profit
- $-4,259
- Equity at exit
- $13,419
- IRR
- 5.2%
- Equity multiple
- 1.39×
- Total profit
- $9,718
- Equity at exit
- $7,782
Cash invested: $25,200 (down + closing). Projections, not guarantees.
Landlord ↔ Tenant lean methodology
- Overall (STATE)
- 43 Moderately Tenant-Leaning
- State Illinois
- 43 Moderately Tenant-Leaning · D+7
- County
- — inherits STATE
- City
- — inherits STATE
ZIP-level market 61443
- Active inventory
- 39
- Price-to-rent
- 7.1×
Monthly cashflow live
- Estimated rent
- $1,056 medium interval (Pro) →
- Mortgage (P&I)
- −$472
- Tax from tax record
- −$163 /mo · $1,958/yr
- Insurance
- −$38
- HOA
- −$0
- Vacancy / Maint / Mgmt
- −$222
- Net cashflow
- $161
Break-even live
Sensitivity live
| Price | -10% $212 | -5% $187 | +0% $161 | +5% $136 | +10% $110 |
|---|---|---|---|---|---|
| Rent | -10% $78 | -5% $120 | +0% $161 | +5% $203 | +10% $245 |
| Rate | -1.0pp $207 | -0.5pp $184 | base $161 | +0.5pp $138 | +1.0pp $114 |
UW: 25.0% down · 7.5% · 30yr · 1.5% tax · 5.0% vac · 8.0% maint · 8.0% mgmt
Financing live
Cash to close
- Down payment
- $22,500
- Closing costs
- $2,700
- Reserves months
- —
- Total cash needed
- —
Loan-product check · same deal, 3 products live
Conventional
25% down · 7.5% · 30yr
- Down + closing
- —
- Monthly P&I
- —
- Monthly cashflow
- —
- DSCR
- —
- Eligible?
- —
Personal DTI + credit; lowest rate.
DSCR
20% down · 8.5% · 30yr
- Down + closing
- —
- Monthly P&I
- —
- Monthly cashflow
- —
- DSCR
- —
- Eligible?
- —
No personal income docs; deal must DSCR.
Hard money
10% down · 12.0% · 12mo
- Down + closing
- —
- Monthly P&I
- —
- Monthly cashflow
- —
- DSCR
- —
- Eligible?
- —
Short-term bridge; refi at stabilization.
Listing history 11 events
-
2026-06-22days on market $90,000 Active 13 DOM
-
2026-06-21days on market $90,000 Active 12 DOM
-
2026-06-21days on market $90,000 Active 11 DOM
-
2026-06-18days on market $90,000 Active 9 DOM
-
2026-06-17days on market $90,000 Active 8 DOM
-
2026-06-16days on market $90,000 Active 7 DOM
-
2026-06-15days on market $90,000 Active 6 DOM
-
2026-06-13days on market $90,000 Active 4 DOM
-
2026-06-12days on market $90,000 Active 3 DOM
-
2026-06-09remarks 675-char remark
-
2026-06-09$90,000 Active 1 DOM
ⓘ Source: listings_history table (triggers on properties + properties_extension) + one-shot
backfill from property_details.listing_events for pre-trigger history.
Tax reassessment forecast IL · Partial reset (capped growth)
- Current annual tax
- $1,958 · $163/mo
- Projected year-2 tax
- $2,000 · $167/mo
- Expected delta
- +$43/yr (+$4/mo · 2.2%)
ⓘ Screening estimate from a state-policy table — verify with the county assessor before closing.
Climate risk First Street
- Flood 1/10 Low FEMA zone X (unshaded) · 0% chance over 30 yrs
- Wildfire 1/10 Low
- Heat 3/10 Moderate 7 d/yr ≥103°F today · 17 d/yr by 30 yrs out
- Wind 2/10 Low
- Air quality 3/10 Moderate 2 unhealthy d/yr today · 3 by 30 yrs out
Nearby sold comps map
Loading sold comps map…
Walkable amenities ~0.75 mi
Loading nearby amenities…
Taxation est. · year 1
- Rental income
- $12,668
- − Mortgage interest
- −$5,041
- − Property taxes
- −$1,958
- − Insurance
- −$450
- − Repairs & maintenance
- −$1,013
- − Management
- −$1,013
- − Depreciation
- −$2,618
- Taxable income
- $574
- Est. tax owed @ 24.0%
- −$138
- After-tax cash flow
- $1,799/yr
For passive investors: Depreciation is non-cash, so a rental often shows a tax loss while cash-flowing — sheltering income. Rental losses are passive: they offset passive income freely, and up to $25,000/yr can offset ordinary (W-2) income if you actively participate and your MAGI is under $100k (phasing out to $0 by $150k); unused losses carry forward. On sale, claimed depreciation is recaptured at up to 25%, and gains may owe capital-gains tax (a 1031 exchange can defer both). Figures are a year-1 estimate at your 24.0% rate — not tax advice; consult a CPA.
Schools (NCES district)
- District
- Kewanee CUSD 229
- NCES district ID
- 1721000
- Math proficiency
- 8% ▼ -8.00%
- Reading proficiency
- 20% ▼ -12.00%
- Median HH income
- $38,294
- Composite
- 11.77/100
- National rank
- #9682
- State rank
- #540 of 620 in IL
Livability — Kewanee
- Score
- 69/100
- State rank
- #409
- US rank
- #8423
Category grades
Schools grade is shown separately in the Schools card above.
Census & demographics
- Census place
- Kewanee, IL
- Population (ZIP)
- 13,529
Population outlook (Henry County) Hauer SSP2
- Today (2025)
- 47,376 people
- By 2030
- 45,920 · -3.1%
- By 2040
- 42,829 · -9.6%
- By 2050
- 39,606 · -16.4%
- By 2075
- 31,848 · -32.8%
- By 2100
- 23,503 · -50.4%
Race, ethnicity, and origin ACS 2023
- Neighborhood character
- Predominantly White (79%)
- Race & ethnicity
- White 79% Hispanic / Latino 11% Black 6% Two or more races 5%
- Hispanic origin (detail)
- Mexican 9% Puerto Rican 1%
- Common ancestry
- Romanian 4% English 3% Italian 3%
- Foreign-born
- 3% · Canada
- Languages at home
- 92% English-only · Spanish 7%
Political lean MEDSL · Henry
- 2024 margin
- Strong R (+24.5) · D 36.8% · R 61.3% · Other 1.9%
- 2008→2024 swing
- -32.2pp toward R · 2008: 7.7pp · 2024: -24.5pp
- All cycles
- 2024: R+24.5 2020: R+21.4 2016: R+21.2 2012: D+3.1 2008: D+7.7
Not yet ingested
- Civics
- —
Market trends
- HPI YoY
- ▼ -68.32%
- Current HPI
- 121.8672
- Rent YoY
- —
- Metro
- —
- State GDP YoY
- ▲ 1.59%
- F500 in state
- 60
Industry mix (Fortune 500 HQ in IL)
| Industry | F500 HQs | Revenue |
|---|---|---|
| Insurance | 4 | $201B |
|
||
| Consumer Goods | 4 | $87B |
|
||
| Industrial Machinery | 3 | $64B |
|
||
| Healthcare | 2 | $55B |
|
||
| Retail / Pharmacy | 1 | $148B |
|
||
| Agriculture / Food | 1 | $86B |
|
||
Price history
1 event — show timeline
- 2026-06-08 Listed $90,000 MRED as Distributed by MLS Grid
Property tax history
+2.0%/yrLatest (2024): $1,958 · +10.0% YoY. Source: county tax records.
Cash-flow waterfall
monthlySold comps — $/sqft
last 12 mo · ≤1 miLoading sold comps…