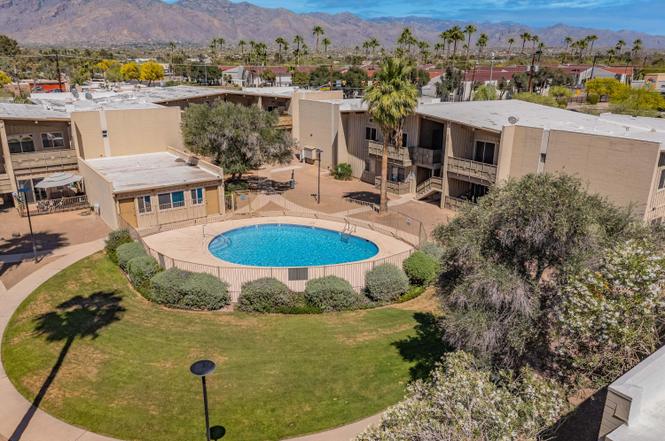
2525 N Alvernon Way Unit B1 · Tucson, AZ
Flood risk 1/10 · Minimal
- FEMA flood zone
- X (shaded)
- Chance of flooding over 30 yrs
- 0.0%
- Est. flood insurance / yr
- $507 – $1,088
Fire risk 1/10 · Minimal
- Est. fire insurance / yr
- $610 – $1,132
Heat risk 8/10 · Major
- Hot days now (above 106°F)
- 7 days/yr
- Hot days in 30 yrs
- 19 days/yr
Wind risk 1/10 · Minimal
- Chance of severe wind over 30 yrs
- —
Air-quality risk 1/10 · Minimal
- Unhealthy air days now
- 0 days/yr
- Unhealthy air days in 30 yrs
- 0 days/yr
Risk factors via First Street. Map © Google.
Why this score? — see what drove the F grade
The composite is a weighted blend of 9 inputs, each scored 0–100. Each bar is that input's sub-score; the figure is the points it added to the 100-point composite (weight × sub-score).
- ARV discount +13.6/15.0
- Cash flow +5.5/30.0
- 1% rule +4.8/10.0
- Livability +3.7/5.0
- Rent growth +2.9/5.0
- Condition / age +2.5/5.0
- Schools +1.6/10.0
- DSCR +0.0/10.0
- Appreciation +0.0/10.0
$100,000
🖨 Deal sheet 📄 Offer letter ✓ Due diligence
Listing remarks MLS
Perfect location in the community, front door leads right out to the pool, laundry included in the unit, no carpet, outdoor patio, all appliance included. Low cost opportunity, check it out today!
Key facts
- Pool access
- Laundry included
- Outdoor patio
Tags
Neighborhood map
What this means for you Summary
Snapshot
- This is a 1-bed/1.0-bath condo listed at $100k.
Deal economics
- At list price, monthly cash flow is $-214 ($-3k/yr) — negative.
- The deal already cash-flows at list — no discount required.
- To meet the 1% rule (rent ≥ 1% of price), the offer needs to be $98k (2.2% below list).
- Recommended offer: $94k (6.0% below list) — sets the bar for market timing.
Location & tenants
- Location reads 74/100 on livability (#17 in AZ, #4,502 nationally) — a middle-class / working-renter tenant base. Strengths: commute A+, cost of living A+, housing A+; Watch: health & safety C-, schools D+, crime F.
- Tucson Unified District (4403) (urban): math 14% / reading 23% proficiency, ranked #190 of 249 in AZ (top 76%) — low school quality limits family demand, transient renter base, plan for 1-2y turnover.
- Market conditions: Rents rising (+1.5%/yr); 139 active listings in the ZIP; 40 comparable units currently listed for rent nearby; rentals at typical pace (median 24d on market — plan ~3-4 weeks tenant-placement turnaround); 42% of comp listings sitting > 30 days — soft ceiling on asking rent; 5,268 units permitted in Pima County in 2024 (996 in 5+ unit buildings).
Forward outlook
- Local home prices are declining (-3.0%/yr); year-one equity from $691 of loan paydown is wiped out by about $3k of value loss. Plan a longer hold.
- Pima County population projected at +8% by 2050 — modest demand growth; plan on rents tracking national, not racing it.
Negotiation context
- It's been on market 66 days — a 6% lower offer ($94k) is reasonable based on typical stale-listing flexibility.
- 6 sale attempts since 21y ago with the ask held roughly flat each time — persistent listings suggest the price (not the market) is what's stuck; bring a comps-based counter.
Risks & watch-outs
- Watch-outs: HOA is 39% of rent.
- Climate carrying-cost: extreme-heat days projected 7→19/yr by 2055 (HVAC capex compounding) — expect insurance premiums to compound above CPI over the hold.
Questions for the listing agent
- What do current leases actually rent for vs. the listed asking? Can we see a recent rent roll and the last 12 months of T-12 income?
- It's been on market 66 days. Have you received any prior offers? Is the seller open to a 6% concession, seller financing, or rate buy-down credit?
- What does the HOA fee cover, when was the last increase, and are there any pending special assessments or reserve-fund shortfalls?
- Any open or pending special assessments — roof, HVAC, plumbing, elevator, façade? What's the per-unit balance and payoff schedule, and is the seller paying it off at close or rolling it to the buyer?
- Why hasn't it sold? Are there any deal-killer items the seller is aware of (foundation, flood, title, zoning, code violations)?
- Is there a deadline driving the sale (1031 exchange, divorce, estate, relocation)? That informs how much negotiation room exists.
- Schools are D-rated, which usually means shorter tenancies and higher turnover. Who's the typical renter profile here, and what's been the actual vacancy rate?
- Crime grade is F in this area — have there been break-ins, vandalism, or insurance claims at this property in the last 3 years? What carrier currently insures it and at what premium?
- The area grade is low — what's the realistic commute time and amenity access for the typical tenant pool here? Any planned neighborhood developments (good or bad) we should know about?
- What's the average days-on-market for RENTAL listings here right now (not sales)? A rising rental-DOM trend means longer vacancies and softer asking-rent achievability than the comps imply.
- What's the recent tenant-quality profile in this submarket — average credit score on applications, eviction rate, late-payment / NSF rate, and stable-employment percentage? A property-management company in the area should have these aggregated.
- How much new apartment / multifamily construction is in the pipeline within 1–3 miles? Heavy new supply (>2% of stock underway) typically softens rents 12–24 months out; light construction supports rent growth.
Investment metrics
- 1% rule
- 0.98% ✗
- Cap rate
- 3.72%
- Cash-on-cash
- -9.18%
- DSCR
- 0.59
- GRM
- 8.5
CMA / ARV
- ARV (median comp)
- $115,787
- List price
- $100,000
- Delta
- -13.63%
- Verdict
- UNDERPRICED
- Comps
- 20 within 1.0 mi
Projected returns pro-forma
-3.0% appreciation · 1.47% rent growth · sell at horizon
- IRR
- -35.0%
- Equity multiple
- -0.11×
- Total profit
- $-31,135
- Equity at exit
- $14,910
- IRR
- -62.6%
- Equity multiple
- -0.78×
- Total profit
- $-49,783
- Equity at exit
- $8,646
Cash invested: $28,000 (down + closing). Projections, not guarantees.
Landlord ↔ Tenant lean methodology
- Overall (STATE)
- 87 Strongly Landlord-Friendly
- State Arizona
- 87 Strongly Landlord-Friendly · R+3
- County
- — inherits STATE
- City
- — inherits STATE
ZIP-level market 85712
- Rents YoY
- 1.5%
- Active inventory
- 139
- Price-to-rent
- 8.5×
Monthly cashflow live
- Estimated rent
- $978 high interval (Pro) →
- Mortgage (P&I)
- −$524
- Tax from tax record
- −$41 /mo · $487/yr
- Insurance
- −$42
- HOA est. from 4 same-building comps
- −$380
- Vacancy / Maint / Mgmt
- −$205
- Net cashflow
- $-214
Break-even live
UW: 25.0% down · 7.5% · 30yr · 1.5% tax · 5.0% vac · 8.0% maint · 8.0% mgmt
Financing live
Cash to close
- Down payment
- $25,000
- Closing costs
- $3,000
- Reserves months
- —
- Total cash needed
- —
Loan-product check · same deal, 3 products live
Conventional
25% down · 7.5% · 30yr
- Down + closing
- —
- Monthly P&I
- —
- Monthly cashflow
- —
- DSCR
- —
- Eligible?
- —
Personal DTI + credit; lowest rate.
DSCR
20% down · 8.5% · 30yr
- Down + closing
- —
- Monthly P&I
- —
- Monthly cashflow
- —
- DSCR
- —
- Eligible?
- —
No personal income docs; deal must DSCR.
Hard money
10% down · 12.0% · 12mo
- Down + closing
- —
- Monthly P&I
- —
- Monthly cashflow
- —
- DSCR
- —
- Eligible?
- —
Short-term bridge; refi at stabilization.
Rent comps 40 comps
| Address | Beds | Baths | Sqft | Rent | $/sqft | DOM | Units | Dist |
|---|---|---|---|---|---|---|---|---|
| 2525 N Alvernon Way Unit B-4 Tucson, AZ | 1.0 | 1.0 | 785 | $795 | $1.01 | 2d | 1 | 0.05mi |
| 2510 N Winstel Blvd Tucson, AZ | 1.0–2.0 | 1.0 | 699 | $725 | $1.04 | 23d | 7 | 0.09mi |
| 2485 N Alvernon Way Tucson, AZ | 2.0–3.0 | 1.0–2.0 | 955 | $925 | $0.97 | 16d | 3 | 0.09mi |
| 2643 N Alvernon Way Tucson, AZ | 2.0 | 1.0 | 720 | $1,195 | $1.66 | 43d | 1 | 0.11mi |
| 2660 N Alvernon Way Tucson, AZ | 1.0 | 1.0 | 580 | $1,049 | $1.81 | 43d | 1 | 0.11mi |
| 3960 E Flower St Unit 15 Tucson, AZ | 2.0 | 1.0 | 912 | $1,450 | $1.59 | 43d | 1 | 0.11mi |
| 2475 N Haskell Dr Tucson, AZ | 1.0 | 1.0 | 567 | $699 | $1.23 | 43d | 1 | 0.16mi |
| 4044 E Flower St Tucson, AZ | 1.0–2.0 | 1.0 | 675 | $900 | $1.33 | 10d | 2 | 0.22mi |
| 2535 N Dodge Blvd Unit 2 Tucson, AZ | 1.0 | 1.0 | 600 | $1,250 | $2.08 | 21d | 1 | 0.26mi |
| 2535 N Dodge Blvd Unit 3 Tucson, AZ | 2.0 | 1.0 | 880 | $1,650 | $1.88 | 21d | 1 | 0.26mi |
| 3671 E Bermuda St Unit 3679 Tucson, AZ | 2.0 | 2.0 | 1050 | $1,295 | $1.23 | 3d | 1 | 0.30mi |
| 3839 E Glenn St Tucson, AZ | 2.0 | 1.0 | 800 | $800 | $1.00 | 43d | 1 | 0.31mi |
| 2455 N Dodge Blvd Tucson, AZ | 1.0–3.0 | 1.0–2.0 | 820 | $964 | $1.17 | 43d | 1 | 0.32mi |
| 2850 N Alvernon Way Apt 8 Tucson, AZ | 1.0 | 1.0 | 590 | $895 | $1.52 | 43d | 1 | 0.35mi |
| 2850 N Alvernon Way Apt 16 Tucson, AZ | 2.0 | 1.0 | 680 | $1,095 | $1.61 | 43d | 1 | 0.35mi |
| 3810 E Monte Vista Dr Unit 206 Tucson, AZ | 1.0 | 1.0 | 592 | $850 | $1.44 | 43d | 1 | 0.36mi |
| 3750 E Monte Vista Dr Tucson, AZ | 2.0 | 1.0 | 754 | $950 | $1.26 | 43d | 1 | 0.38mi |
| 2501 N Richey Blvd Unit 2505 Tucson, AZ | 1.0 | 1.0 | 675 | $695 | $1.03 | 43d | 1 | 0.39mi |
| 3551 E Water St Tucson, AZ | 2.0 | 1.0 | 916 | $1,300 | $1.42 | 3d | 1 | 0.40mi |
| 4115 E North St #6 Tucson, AZ | 2.0 | 1.0 | 868 | $995 | $1.15 | 23d | 1 | 0.41mi |
| 4115 E North St Apt 3 Tucson, AZ | 2.0 | 1.0 | 868 | $995 | $1.15 | 43d | 1 | 0.41mi |
| 2950 N Alvernon Way Unit ALV2950-10103 Tucson, AZ | 2.0 | 2.0 | 957 | $1,325 | $1.38 | 3d | 1 | 0.42mi |
| 2950 N Alvernon Way #10103 Tucson, AZ | 2.0 | 2.0 | 957 | $1,425 | $1.49 | 3d | 1 | 0.42mi |
| 2412 N Bryant Ave Unit A Tucson, AZ | 1.0 | 1.0 | 600 | $800 | $1.33 | 17d | 1 | 0.42mi |
| 4123 E North St Unit C Tucson, AZ | 2.0 | 1.0 | 750 | $1,000 | $1.33 | 43d | 1 | 0.43mi |
| 3949 E Monte Vista Dr Tucson, AZ | 3.0 | 1.0 | 722 | $708 | $0.98 | 3d | 5 | 0.44mi |
| 3731 E Hampton St Tucson, AZ | 2.0 | 1.0 | 875 | $1,100 | $1.26 | 43d | 1 | 0.44mi |
| 2924 N Winstel Blvd Unit 02 Tucson, AZ | 2.0 | 2.0 | 951 | $1,495 | $1.57 | 23d | 1 | 0.44mi |
| 2053 N Alvernon Way Unit AL2053-9 Tucson, AZ | 1.0 | 1.0 | 546 | $795 | $1.46 | 23d | 1 | 0.49mi |
| 2053 N Alvernon Way Unit AL2053-24 Tucson, AZ | 1.0 | 1.0 | 546 | $795 | $1.46 | 43d | 1 | 0.49mi |
| 2053 N Alvernon Way Unit AL2053-18 Tucson, AZ | 1.0 | 1.0 | 542 | $750 | $1.38 | 43d | 1 | 0.49mi |
| 2053 N Alvernon Way Unit AL2053-7 Tucson, AZ | 1.0 | 1.0 | 546 | $695 | $1.27 | 43d | 1 | 0.49mi |
| 2053 N Alvernon Way Unit AL2053-21 Tucson, AZ | 1.0 | 1.0 | 546 | $795 | $1.46 | 11d | 1 | 0.50mi |
| 2415 N Columbus Blvd Tucson, AZ | 2.0 | 1.0 | 900 | $1,100 | $1.22 | 23d | 1 | 0.52mi |
| 3475 E Water St Tucson, AZ | 1.0 | 1.0 | 595 | $793 | $1.33 | 3d | 1 | 0.52mi |
| 2606 N Columbus Blvd Unit 2610 02 Tucson, AZ | 1.0 | 1.0 | 672 | $750 | $1.12 | 23d | 1 | 0.53mi |
| 2707 N Palo Verde Ave Unit 2709 Tucson, AZ | 2.0 | 1.0 | 784 | $1,050 | $1.34 | 3d | 1 | 0.53mi |
| 3925 E Blacklidge Dr Apt 4 Tucson, AZ | 2.0 | 2.0 | 795 | $900 | $1.13 | 10d | 1 | 0.54mi |
| 3003 N Alvernon Way Tucson, AZ | 2.0 | 1.0 | 900 | $799 | $0.89 | 3d | 4 | 0.55mi |
| 3529 E Florence Dr Tucson, AZ | 2.0 | 2.0 | 914 | $1,050 | $1.15 | 2d | 1 | 0.55mi |
HOA detail condo
- Monthly dues
- $0 · $0/yr
- Likely covers
- pool
- Assessments
- None detected in remarks — confirm with the listing agent.
Listing history 36 events
-
2026-06-18days on market $100,000 Active 66 DOM
-
2026-06-17days on market $100,000 Active 65 DOM
-
2026-06-16days on market $100,000 Active 64 DOM
-
2026-06-15days on market $100,000 Active 63 DOM
-
2026-06-13days on market $100,000 Active 61 DOM
-
2026-06-10days on market $100,000 Active 58 DOM
-
2026-06-09days on market $100,000 Active 57 DOM
-
2026-06-08days on market $100,000 Active 56 DOM
-
2026-06-07days on market $100,000 Active 55 DOM
-
2026-06-05days on market $100,000 Active 52 DOM
-
2026-06-03days on market $100,000 Active 51 DOM
-
2026-06-02days on market $100,000 Active 50 DOM
-
2026-06-01days on market $100,000 Active 49 DOM
-
2026-05-31days on market $100,000 Active 48 DOM
-
2026-04-13$100,000 Active 196-char remark
Show marketing remark (196 chars)
Perfect location in the community, front door leads right out to the pool, laundry included in the unit, no carpet, outdoor patio, all appliance included. Low cost opportunity, check it out today!
-
2022-07-28soldstatus $99,900 Closed 231-char remark
Show marketing remark (231 chars)
Very clean and ready to move in. Bottom floor unit that has easy access to community pool. Centrally located close to bus lines, shopping, and restaurants. HOA fee covers lots of utility costs. Affordable living in Central Tucson.
-
2022-07-28soldstatus $99,900
Show marketing remark (231 chars)
Very clean and ready to move in. Bottom floor unit that has easy access to community pool. Centrally located close to bus lines, shopping, and restaurants. HOA fee covers lots of utility costs. Affordable living in Central Tucson.
-
2022-07-23status Pending 231-char remark
Show marketing remark (231 chars)
Very clean and ready to move in. Bottom floor unit that has easy access to community pool. Centrally located close to bus lines, shopping, and restaurants. HOA fee covers lots of utility costs. Affordable living in Central Tucson.
-
2022-06-30historical Active Contingent 231-char remark
Show marketing remark (231 chars)
Very clean and ready to move in. Bottom floor unit that has easy access to community pool. Centrally located close to bus lines, shopping, and restaurants. HOA fee covers lots of utility costs. Affordable living in Central Tucson.
-
2022-06-14price $99,900 231-char remark
Show marketing remark (231 chars)
Very clean and ready to move in. Bottom floor unit that has easy access to community pool. Centrally located close to bus lines, shopping, and restaurants. HOA fee covers lots of utility costs. Affordable living in Central Tucson.
-
2022-06-04price $109,900 231-char remark
Show marketing remark (231 chars)
Very clean and ready to move in. Bottom floor unit that has easy access to community pool. Centrally located close to bus lines, shopping, and restaurants. HOA fee covers lots of utility costs. Affordable living in Central Tucson.
-
2022-05-29price $117,900 231-char remark
Show marketing remark (231 chars)
Very clean and ready to move in. Bottom floor unit that has easy access to community pool. Centrally located close to bus lines, shopping, and restaurants. HOA fee covers lots of utility costs. Affordable living in Central Tucson.
-
2022-05-28$17,900 Active 231-char remark
Show marketing remark (231 chars)
Very clean and ready to move in. Bottom floor unit that has easy access to community pool. Centrally located close to bus lines, shopping, and restaurants. HOA fee covers lots of utility costs. Affordable living in Central Tucson.
-
2018-10-09soldstatus $45,000 Closed
-
2018-10-09soldstatus $45,000
-
2018-09-27status Pending
-
2018-08-14$55,000 Active
-
2009-02-13historical
-
2008-12-01$96,500
-
2006-08-02soldstatus $105,000
-
2006-08-02soldstatus $105,000
-
2006-06-10$109,900
-
2005-10-31soldstatus $124,900
-
2005-06-30soldstatus $99,900
-
2005-05-17$99,900
-
1996-07-25soldstatus $935,000
ⓘ Source: listings_history table (triggers on properties + properties_extension) + one-shot
backfill from property_details.listing_events for pre-trigger history.
Tax reassessment forecast AZ · Resets to sale price
- Current annual tax
- $487 · $41/mo
- Projected year-2 tax
- $660 · $55/mo
- Expected delta
- +$173/yr (+$14/mo · 35.6%)
ⓘ Screening estimate from a state-policy table — verify with the county assessor before closing.
Climate risk First Street
- Flood 1/10 Low FEMA zone X (shaded) · 0% chance over 30 yrs
- Wildfire 1/10 Low
- Heat 8/10 Severe 7 d/yr ≥106°F today · 19 d/yr by 30 yrs out
- Wind 1/10 Low
- Air quality 1/10 Low 0 unhealthy d/yr today · 0 by 30 yrs out
Nearby sold comps map
Loading sold comps map…
Walkable amenities ~0.75 mi
Loading nearby amenities…
Taxation est. · year 1
- Rental income
- $11,733
- − Mortgage interest
- −$5,602
- − Property taxes
- −$487
- − Insurance
- −$500
- − Repairs & maintenance
- −$939
- − Management
- −$939
- − HOA
- −$4,560
- − Depreciation
- −$2,909
- Taxable loss
- −$4,202
- Est. tax savings @ 24.0%
- +$1,008
- After-tax cash flow
- $-1,562/yr
For passive investors: Depreciation is non-cash, so a rental often shows a tax loss while cash-flowing — sheltering income. Rental losses are passive: they offset passive income freely, and up to $25,000/yr can offset ordinary (W-2) income if you actively participate and your MAGI is under $100k (phasing out to $0 by $150k); unused losses carry forward. On sale, claimed depreciation is recaptured at up to 25%, and gains may owe capital-gains tax (a 1031 exchange can defer both). Figures are a year-1 estimate at your 24.0% rate — not tax advice; consult a CPA.
Schools (NCES district)
- District
- Tucson Unified District (4403)
- NCES district ID
- 0408800
- Math proficiency
- 14% ▼ -17.00%
- Reading proficiency
- 23% ▼ -11.00%
- Median HH income
- $40,962
- Composite
- 15.78/100
- National rank
- #9270
- State rank
- #190 of 249 in AZ
Livability — Tucson
- Score
- 74/100
- State rank
- #17
- US rank
- #4502
Category grades
Schools grade is shown separately in the Schools card above.
Census & demographics
- Census place
- Tucson, AZ
- County
- Pima County · 1,012,107 people
- City population
- 839,336
- Metro
- Tucson, AZ
- Population (ZIP)
- 31,571
- Household income
- $50,625
- Rent vs Own
- Severe rent burden
- 2140.0
Population outlook (Pima County) Hauer SSP2
- Today (2025)
- 1,066,056 people
- By 2030
- 1,086,684 · +1.9%
- By 2040
- 1,117,160 · +4.8%
- By 2050
- 1,149,778 · +7.9%
- By 2075
- 1,271,480 · +19.3%
- By 2100
- 1,321,160 · +23.9%
Race, ethnicity, and origin ACS 2023
- Neighborhood character
- Diverse neighborhood (Simpson 0.60)
- Race & ethnicity
- White 57% Hispanic / Latino 27% Two or more races 15% Black 6% Asian 3% Native American 2%
- Hispanic origin (detail)
- Mexican 21% Puerto Rican 1%
- Common ancestry
- Romanian 4% Lithuanian 2% Slovak 2%
- Foreign-born
- 10% · Canada, China
- Languages at home
- 80% English-only · Spanish 13% Other Indo-European 2% Russian/Polish/Slavic 1%
Political lean MEDSL · Pima
- 2024 margin
- D (+15.2) · D 57.0% · R 41.8% · Other 1.2%
- 2008→2024 swing
- +9.1pp toward D · 2008: 6.1pp · 2024: 15.2pp
- All cycles
- 2024: D+15.2 2020: D+18.7 2016: D+13.5 2012: D+5.8 2008: D+6.1
Not yet ingested
- Civics
- —
Market trends
- HPI YoY
- ▼ -324.39%
- Current HPI
- 266.7562
- Rent YoY
- ▲ 1.47%
- Metro
- Tucson, AZ
- State GDP YoY
- ▲ 4.54%
- F500 in state
- 20
Industry mix (Fortune 500 HQ in AZ)
| Industry | F500 HQs | Revenue |
|---|---|---|
| Technology | 2 | $13B |
|
||
| Mining / Metals | 1 | $23B |
|
||
| Environmental Services | 1 | $16B |
|
||
| Metals / Steel | 1 | $14B |
|
||
| Technology Distribution | 1 | $9B |
|
||
| Homebuilding | 1 | $8B |
|
||
Price history
-89.3% since first listed22 events — show timeline
- 2026-04-13 Listed $100,000 MLSSAZ
- 2022-07-28 Sold (Public Records) $99,900 Public Records
- 2022-07-28 Sold (MLS) $99,900 MLSSAZ
- 2022-07-23 Pending — MLSSAZ
- 2022-06-30 Contingent — MLSSAZ
- 2022-06-14 Price Changed $99,900 MLSSAZ
- 2022-06-04 Price Changed $109,900 MLSSAZ
- 2022-05-29 Price Changed $117,900 MLSSAZ
- 2022-05-28 Listed $17,900 MLSSAZ
- 2018-10-09 Sold (Public Records) $45,000 Public Records
- 2018-10-09 Sold (MLS) $45,000 MLSSAZ
- 2018-09-27 Pending — MLSSAZ
- 2018-08-14 Listed $55,000 MLSSAZ
- 2009-02-13 Listing Removed — MLSSAZ
- 2008-12-01 Listed $96,500 MLSSAZ
- 2006-08-02 Sold (Public Records) $105,000 Public Records
- 2006-08-02 Sold (MLS) $105,000 MLSSAZ
- 2006-06-10 Listed $109,900 MLSSAZ
- 2005-10-31 Sold (Public Records) $124,900 Public Records
- 2005-06-30 Sold (MLS) $99,900 MLSSAZ
- 2005-05-17 Listed $99,900 MLSSAZ
- 1996-07-25 Sold (Public Records) $935,000 Public Records
Property tax history
+2.6%/yrLatest (2025): $487 · +4.4% YoY. Source: county tax records.
Cash-flow waterfall
monthlySold comps — $/sqft
last 12 mo · ≤1 miLoading sold comps…