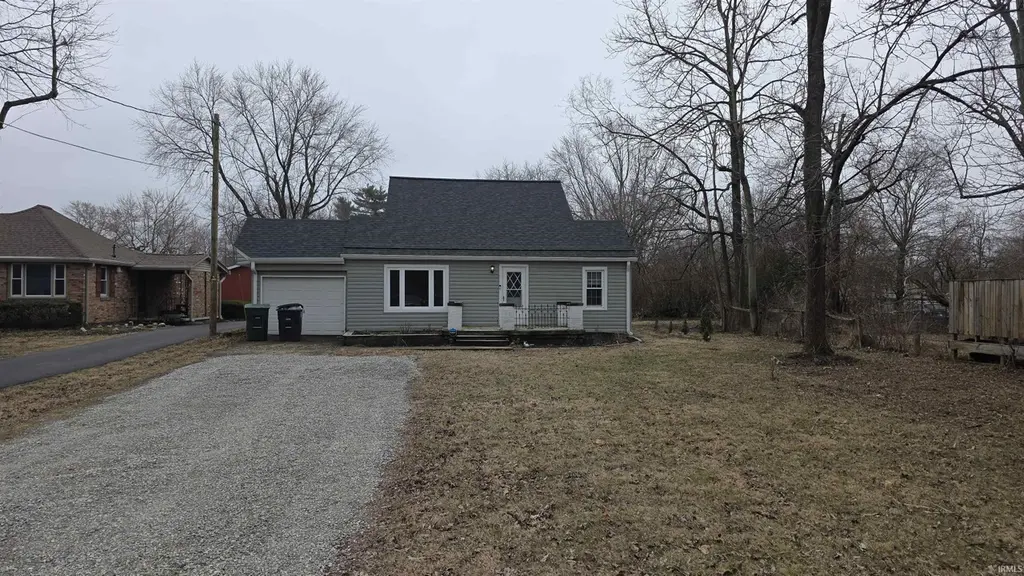
4413 W Garver Dr · Muncie, IN
Flood risk 1/10 · Minimal
- FEMA flood zone
- X (unshaded)
- Chance of flooding over 30 yrs
- 0.0%
- Est. flood insurance / yr
- $473 – $860
Fire risk 1/10 · Minimal
- Est. fire insurance / yr
- $717 – $1,331
Heat risk 3/10 · Minor
- Hot days now (above 100°F)
- 7 days/yr
- Hot days in 30 yrs
- 18 days/yr
Wind risk 2/10 · Minimal
- Chance of severe wind over 30 yrs
- 1.0%
Air-quality risk 3/10 · Minor
- Unhealthy air days now
- 2 days/yr
- Unhealthy air days in 30 yrs
- 3 days/yr
Risk factors via First Street. Map © Google.
Why this score? — see what drove the C- grade
The composite is a weighted blend of 9 inputs, each scored 0–100. Each bar is that input's sub-score; the figure is the points it added to the 100-point composite (weight × sub-score).
- Cash flow +20.6/30.0
- ARV discount +8.3/15.0
- DSCR +6.6/10.0
- 1% rule +4.5/10.0
- Rent growth +4.5/5.0
- Livability +4.0/5.0
- Condition / age +2.5/5.0
- Schools +1.7/10.0
- Appreciation +0.0/10.0
$169,000
🖨 Deal sheet 📄 Offer letter ✓ Due diligence
Listing remarks MLS
Enjoy this spacious home offering over 1,597 square feet of comfortable living space. This 3-bedroom, 1.5-bath property features a functional layout with two separate living areas, providing flexibility for entertaining, relaxing, or creating a dedicated office, playroom, or second family room. Major updates offer peace of mind, including new windows and siding in 2024, a new roof in 2021, and a new furnace in 2017. These improvements enhance both efficiency and long-term value. The generous bedrooms provide comfortable retreats with convenient access to the full and half baths. A partial basement adds valuable storage space and offers potential for a hobby area. Situated in an established neighborhood with easy access to shopping, dining, schools, and everyday amenities, this home combines space, functionality, and key updates. A fantastic opportunity to own a well-maintained property with room to grow.
Key facts
- New furnace
- Partial basement
- New roof
Tags
Neighborhood map
What this means for you Summary
Snapshot
- This is a 4-bed/1.5-bath single-family listed at $169k.
Deal economics
- At list price, monthly cash flow is $227 ($3k/yr) — positive.
- The deal already cash-flows at list — no discount required.
- To meet the 1% rule (rent ≥ 1% of price), the offer needs to be $160k (5.1% below list).
- Recommended offer: $154k (9.0% below list) — sets the bar for market timing.
- Cap rate 7.9% vs local median 6.0% in Muncie — top-decile yield for the area; either an underpriced asset or a hidden risk that comps aren't pricing in. Stress-test before assuming the spread holds.
Location & tenants
- Location reads 80/100 on livability (#18 in IN, #1,654 nationally) — a professional / high-income tenant draw. Strengths: amenities A+, commute A+, cost of living A+; Watch: schools D+, crime F, employment F.
- Muncie Community Schools (urban): math 18% / reading 25% proficiency, ranked #275 of 301 in IN (top 91%) — low school quality limits family demand, transient renter base, plan for 1-2y turnover; 68% free/reduced lunch — lower-income household profile, screen leases tightly.
- Market conditions: Rents rising fast (+8.1%/yr); 202 active listings in the ZIP; 2 comparable units currently listed for rent nearby; 171 units permitted in Delaware County in 2024 (57 in 5+ unit buildings).
- This rent runs 30% of the median local income ($63k/yr) — at the standard rent-burdened threshold; future hikes will face affordability resistance.
Forward outlook
- Local home prices are declining (-3.0%/yr); year-one equity from $1k of loan paydown is wiped out by about $5k of value loss. Plan a longer hold.
- Delaware County population projected at -11% by 2050 — secular population decline; favor cash flow + early exit over multi-decade hold.
- At projected returns (-3.0% appreciation + 8.0% rent growth), your $47k cash investment doubles in ~9 years — after that, you're playing with house money.
Negotiation context
- It's been on market 105 days — a 9% lower offer ($154k) is reasonable based on typical stale-listing flexibility.
- 5 sale attempts since 11y ago; this cycle's ask has dropped $30k (15%) from the opening price — seller is motivated, your offer sets the floor, not the list.
- Current owner paid $124k; 36% above their basis — modest negotiation headroom, anchor on the comps not their cost.
Risks & watch-outs
- Watch-outs: built in 1937 — expect roof / HVAC / electrical / plumbing capex.
Questions for the listing agent
- It's been on market 105 days. Have you received any prior offers? Is the seller open to a 9% concession, seller financing, or rate buy-down credit?
- Built in 1937 — when were the roof, HVAC, electrical panel, plumbing, and water heater last replaced?
- Why hasn't it sold? Are there any deal-killer items the seller is aware of (foundation, flood, title, zoning, code violations)?
- Is there a deadline driving the sale (1031 exchange, divorce, estate, relocation)? That informs how much negotiation room exists.
- Schools are D-rated, which usually means shorter tenancies and higher turnover. Who's the typical renter profile here, and what's been the actual vacancy rate?
- Crime grade is F in this area — have there been break-ins, vandalism, or insurance claims at this property in the last 3 years? What carrier currently insures it and at what premium?
- What's the average days-on-market for RENTAL listings here right now (not sales)? A rising rental-DOM trend means longer vacancies and softer asking-rent achievability than the comps imply.
- What's the recent tenant-quality profile in this submarket — average credit score on applications, eviction rate, late-payment / NSF rate, and stable-employment percentage? A property-management company in the area should have these aggregated.
- How much new for-sale + rental construction is in the pipeline within 1–3 miles? Heavy new supply typically softens prices + rents 12–24 months out; constrained supply supports both.
Investment metrics
- 1% rule
- 0.95% ✗
- Cap rate
- 7.90%
- Cash-on-cash
- 5.75%
- DSCR
- 1.26
- GRM
- 8.8
CMA / ARV
- ARV (median comp)
- $172,050
- List price
- $169,000
- Delta
- -1.77%
- Verdict
- FAIR
- Comps
- 20 within 1.0 mi
Show comp detail 12 sales within ~0.75 mi
| Address | Dist | Beds/Ba | Sqft | Sold | Price | $/sf | Match |
|---|---|---|---|---|---|---|---|
| 4801 W Peachtree Ln | 0.26mi | 4/2.0 | 1,679 (+3%) | 1mo | $210,000 | $125 | 80 |
| 4412 W Garver Dr | 0.05mi | 4/2.0 | 1,768 (+8%) | 6mo | $220,000 | $124 | 77 |
| 4208 W Gilbert St | 0.27mi | 3/2.0 (-1) | 1,646 (+1%) | 8mo | $250,000 | $152 | 73 |
| 408 S Harvey Rd | 0.34mi | 4/2.0 | 1,794 (+10%) | 0mo | $225,000 | $125 | 66 |
| 607 N Shellbark Rd | 0.55mi | 3/2.0 (-1) | 1,636 (+0%) | 2mo | $200,000 | $122 | 66 |
| 4111 W Peachtree Ln | 0.24mi | 3/2.0 (-1) | 1,806 (+10%) | 4mo | $200,000 | $111 | 61 |
| 4200 W Palomino Ct | 0.55mi | 3/2.0 (-1) | 1,710 (+5%) | 1mo | $325,000 | $190 | 59 |
| 4208 W Thornwood Ln | 0.59mi | 3/2.0 (-1) | 1,520 (-7%) | 2mo | $287,500 | $189 | 52 |
| 4204 W Beechwood Ave | 0.43mi | 3/2.0 (-1) | 1,814 (+11%) | 7mo | $290,000 | $160 | 49 |
| 4300 Whispering Way Ct | 0.58mi | 3/2.0 (-1) | 1,523 (-7%) | 7mo | $280,000 | $184 | 49 |
| 615 N Kylewood Dr | 0.37mi | 3/2.0 (-1) | 1,412 (-14%) | 5mo | $160,000 | $113 | 48 |
| 3400 W Godman Ave | 0.69mi | 4/1.0 | 1,392 (-15%) | 8mo | $173,000 | $124 | 34 |
Match score weights: distance 35% · size 25% · config 20% · recency 20%. Top-matched comps best support the ARV.
Projected returns pro-forma
-3.0% appreciation · 8.0% rent growth · sell at horizon
- IRR
- -2.4%
- Equity multiple
- 0.90×
- Total profit
- $-4,527
- Equity at exit
- $25,198
- IRR
- 11.7%
- Equity multiple
- 2.12×
- Total profit
- $52,994
- Equity at exit
- $14,612
Cash invested: $47,320 (down + closing). Projections, not guarantees.
Landlord ↔ Tenant lean methodology
- Overall (STATE)
- 90 Strongly Landlord-Friendly
- State Indiana
- 90 Strongly Landlord-Friendly · R+11
- County
- — inherits STATE
- City
- — inherits STATE
ZIP-level market 47304
- Home prices YoY
- -28.4%
- Rents YoY
- 8.1%
- Active inventory
- 202
- Price-to-rent
- 8.8×
Monthly cashflow live
- Estimated rent
- $1,603 medium interval (Pro) →
- Mortgage (P&I)
- −$886
- Tax from tax record
- −$83 /mo · $999/yr
- Insurance
- −$70
- HOA
- −$0
- Vacancy / Maint / Mgmt
- −$337
- Net cashflow
- $227
Break-even live
UW: 25.0% down · 7.5% · 30yr · 1.5% tax · 5.0% vac · 8.0% maint · 8.0% mgmt
Financing live
Cash to close
- Down payment
- $42,250
- Closing costs
- $5,070
- Reserves months
- —
- Total cash needed
- —
Loan-product check · same deal, 3 products live
Conventional
25% down · 7.5% · 30yr
- Down + closing
- —
- Monthly P&I
- —
- Monthly cashflow
- —
- DSCR
- —
- Eligible?
- —
Personal DTI + credit; lowest rate.
DSCR
20% down · 8.5% · 30yr
- Down + closing
- —
- Monthly P&I
- —
- Monthly cashflow
- —
- DSCR
- —
- Eligible?
- —
No personal income docs; deal must DSCR.
Hard money
10% down · 12.0% · 12mo
- Down + closing
- —
- Monthly P&I
- —
- Monthly cashflow
- —
- DSCR
- —
- Eligible?
- —
Short-term bridge; refi at stabilization.
Rent comps 2 comps
| Address | Beds | Baths | Sqft | Rent | $/sqft | DOM | Units | Dist |
|---|---|---|---|---|---|---|---|---|
| 5124 W Canterbury Dr Muncie, IN | 2.0–3.0 | 1.5 | 1050 | $1,438 | $1.37 | 43d | 2 | 0.61mi |
| 2800 W Memorial Dr Muncie, IN | 3.0 | 2.0 | 1216 | $1,139 | $0.94 | 43d | 1 | 1.40mi |
Listing history 29 events
-
2026-06-18status $169,000 Pending 105 DOM
-
2026-06-18days on market $169,000 Active 105 DOM
-
2026-06-17days on market $169,000 Active 104 DOM
-
2026-06-16days on market $169,000 Active 103 DOM
-
2026-06-15days on market $169,000 Active 102 DOM
-
2026-06-14days on market $169,000 Active 100 DOM
-
2026-06-13days on market $169,000 Active 99 DOM
-
2026-06-10days on market $169,000 Active 97 DOM
-
2026-06-09days on market $169,000 Active 96 DOM
-
2026-06-08days on market $169,000 Active 95 DOM
-
2026-06-07days on market $169,000 Active 94 DOM
-
2026-06-05pricedays on market $169,000 Active 91 DOM
-
2026-06-03days on market $179,000 Active 90 DOM
-
2026-06-02days on market $179,000 Active 89 DOM
-
2026-06-01days on market $179,000 Active 88 DOM
-
2026-05-31days on market $179,000 Active 87 DOM
-
2026-05-30days on market $179,000 Active 86 DOM
-
2026-05-07price $179,000 917-char remark
Show marketing remark (917 chars)
Enjoy this spacious home offering over 1,597 square feet of comfortable living space. This 3-bedroom, 1.5-bath property features a functional layout with two separate living areas, providing flexibility for entertaining, relaxing, or creating a dedicated office, playroom, or second family room. Major updates offer peace of mind, including new windows and siding in 2024, a new roof in 2021, and a new furnace in 2017. These improvements enhance both efficiency and long-term value. The generous bedrooms provide comfortable retreats with convenient access to the full and half baths. A partial basement adds valuable storage space and offers potential for a hobby area. Situated in an established neighborhood with easy access to shopping, dining, schools, and everyday amenities, this home combines space, functionality, and key updates. A fantastic opportunity to own a well-maintained property with room to grow.
-
2026-04-07price $189,000 917-char remark
Show marketing remark (917 chars)
Enjoy this spacious home offering over 1,597 square feet of comfortable living space. This 3-bedroom, 1.5-bath property features a functional layout with two separate living areas, providing flexibility for entertaining, relaxing, or creating a dedicated office, playroom, or second family room. Major updates offer peace of mind, including new windows and siding in 2024, a new roof in 2021, and a new furnace in 2017. These improvements enhance both efficiency and long-term value. The generous bedrooms provide comfortable retreats with convenient access to the full and half baths. A partial basement adds valuable storage space and offers potential for a hobby area. Situated in an established neighborhood with easy access to shopping, dining, schools, and everyday amenities, this home combines space, functionality, and key updates. A fantastic opportunity to own a well-maintained property with room to grow.
-
2026-03-05$199,000 Active 917-char remark
Show marketing remark (917 chars)
Enjoy this spacious home offering over 1,597 square feet of comfortable living space. This 3-bedroom, 1.5-bath property features a functional layout with two separate living areas, providing flexibility for entertaining, relaxing, or creating a dedicated office, playroom, or second family room. Major updates offer peace of mind, including new windows and siding in 2024, a new roof in 2021, and a new furnace in 2017. These improvements enhance both efficiency and long-term value. The generous bedrooms provide comfortable retreats with convenient access to the full and half baths. A partial basement adds valuable storage space and offers potential for a hobby area. Situated in an established neighborhood with easy access to shopping, dining, schools, and everyday amenities, this home combines space, functionality, and key updates. A fantastic opportunity to own a well-maintained property with room to grow.
-
2025-10-10price $199,900
-
2025-09-26price $210,000
-
2025-08-29$220,000 Active
-
2021-10-25soldstatus $124,000
-
2021-10-25soldstatus $124,000
-
2021-09-17$124,000
-
2021-09-17$124,000
-
2015-08-17soldstatus $64,000
-
2015-05-24$69,000
ⓘ Source: listings_history table (triggers on properties + properties_extension) + one-shot
backfill from property_details.listing_events for pre-trigger history.
Tax reassessment forecast IN · Partial reset (capped growth)
- Current annual tax
- $999 · $83/mo
- Projected year-2 tax
- $1,218 · $101/mo
- Expected delta
- +$219/yr (+$18/mo · 21.9%)
ⓘ Screening estimate from a state-policy table — verify with the county assessor before closing.
Climate risk First Street
- Flood 1/10 Low FEMA zone X (unshaded) · 0% chance over 30 yrs
- Wildfire 1/10 Low
- Heat 3/10 Moderate 7 d/yr ≥100°F today · 18 d/yr by 30 yrs out
- Wind 2/10 Low 100% chance of damaging wind over 30 yrs
- Air quality 3/10 Moderate 2 unhealthy d/yr today · 3 by 30 yrs out
Nearby sold comps map
Loading sold comps map…
Walkable amenities ~0.75 mi
Loading nearby amenities…
Taxation est. · year 1
- Rental income
- $19,240
- − Mortgage interest
- −$9,467
- − Property taxes
- −$999
- − Insurance
- −$845
- − Repairs & maintenance
- −$1,539
- − Management
- −$1,539
- − Depreciation
- −$4,916
- Taxable loss
- −$65
- Est. tax savings @ 24.0%
- +$16
- After-tax cash flow
- $2,736/yr
For passive investors: Depreciation is non-cash, so a rental often shows a tax loss while cash-flowing — sheltering income. Rental losses are passive: they offset passive income freely, and up to $25,000/yr can offset ordinary (W-2) income if you actively participate and your MAGI is under $100k (phasing out to $0 by $150k); unused losses carry forward. On sale, claimed depreciation is recaptured at up to 25%, and gains may owe capital-gains tax (a 1031 exchange can defer both). Figures are a year-1 estimate at your 24.0% rate — not tax advice; consult a CPA.
Schools (NCES district)
- District
- Muncie Community Schools
- NCES district ID
- 1807320
- Math proficiency
- 18% ▼ -9.00%
- Reading proficiency
- 25% ▼ -4.00%
- Median HH income
- $30,052
- Composite
- 17.22/100
- National rank
- #9099
- State rank
- #275 of 301 in IN
Livability — Muncie
- Score
- 80/100
- State rank
- #18
- US rank
- #1654
Category grades
Schools grade is shown separately in the Schools card above.
Census & demographics
- Census place
- Muncie, IN
- County
- Delaware County · 84,658 people
- City population
- 84,658
- Metro
- Muncie, IN
- Population (ZIP)
- 31,237
- Household income
- $63,215
- Rent vs Own
- Severe rent burden
- 1141.0
Population outlook (Delaware County) Hauer SSP2
- Today (2025)
- 113,036 people
- By 2030
- 111,313 · -1.5%
- By 2040
- 106,432 · -5.8%
- By 2050
- 100,747 · -10.9%
- By 2075
- 91,000 · -19.5%
- By 2100
- 80,687 · -28.6%
Race, ethnicity, and origin ACS 2023
- Neighborhood character
- Predominantly White (85%)
- Race & ethnicity
- White 85% Two or more races 5% Black 4% Asian 4% Hispanic / Latino 3%
- Common ancestry
- Lithuanian 2% Romanian 2% Slovak 1%
- Foreign-born
- 5% · Canada, Vietnam, China
- Languages at home
- 94% English-only · Spanish 2% Other Indo-European 1% Vietnamese 1%
Political lean MEDSL · Delaware
- 2024 margin
- R (+15.8) · D 41.2% · R 57.0% · Other 1.8%
- 2008→2024 swing
- -30.8pp toward R · 2008: 15.0pp · 2024: -15.8pp
- All cycles
- 2024: R+15.8 2020: R+13.2 2016: R+13.7 2012: D+3.1 2008: D+15.0
Not yet ingested
- Civics
- —
Market trends
- HPI YoY
- ▼ -78.53%
- Current HPI
- 197.5213
- Rent YoY
- ▲ 8.08%
- Metro
- Muncie, IN
- State GDP YoY
- ▲ 2.90%
- F500 in state
- 18
Industry mix (Fortune 500 HQ in IN)
| Industry | F500 HQs | Revenue |
|---|---|---|
| Industrial Machinery | 2 | $37B |
|
||
| Healthcare | 1 | $177B |
|
||
| Pharmaceuticals | 1 | $45B |
|
||
| Metals / Steel | 1 | $18B |
|
||
| Agriculture | 1 | $17B |
|
||
| Packaging | 1 | $12B |
|
||
Price history
+159.4% since first listed12 events — show timeline
- 2026-05-07 Price Changed $179,000 IRMLS
- 2026-04-07 Price Changed $189,000 IRMLS
- 2026-03-05 Listed $199,000 IRMLS
- 2025-10-10 Price Changed $199,900 IRMLS
- 2025-09-26 Price Changed $210,000 IRMLS
- 2025-08-29 Listed $220,000 IRMLS
- 2021-10-25 Sold (MLS) $124,000 MIBOR as Distributed by MLS Grid
- 2021-10-25 Sold (MLS) $124,000 IRMLS
- 2021-09-17 Listed $124,000 MIBOR as Distributed by MLS Grid
- 2021-09-17 Listed $124,000 IRMLS
- 2015-08-17 Sold (MLS) $64,000 IRMLS
- 2015-05-24 Listed $69,000 IRMLS
Property tax history
+3.8%/yrLatest (2024): $999 · +0.0% YoY. Source: county tax records.
Cash-flow waterfall
monthlySold comps — $/sqft
last 12 mo · ≤1 miLoading sold comps…