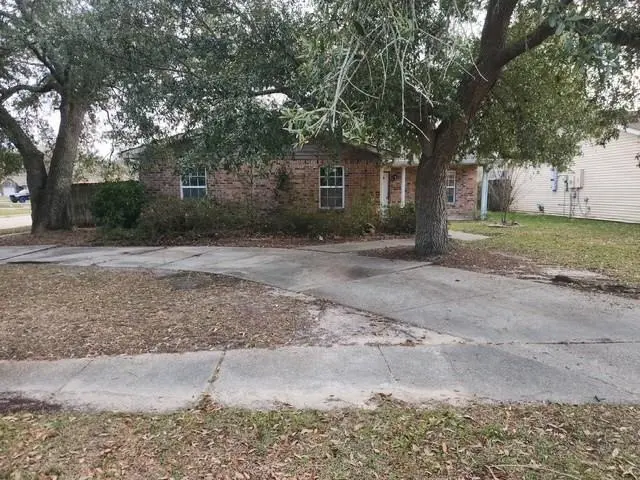
1420 Admiral Nelson Dr · Slidell, LA
Flood risk 8/10 · Major
- FEMA flood zone
- X (shaded)
- Chance of flooding over 30 yrs
- 0.75%
- Est. flood insurance / yr
- $507 – $1,088
Fire risk 5/10 · Moderate
- Est. fire insurance / yr
- $1,269 – $2,357
Heat risk 10/10 · Severe
- Hot days now (above 108°F)
- 7 days/yr
- Hot days in 30 yrs
- 22 days/yr
Wind risk 9/10 · Severe
- Chance of severe wind over 30 yrs
- 99.0%
Air-quality risk 2/10 · Minimal
- Unhealthy air days now
- 1 days/yr
- Unhealthy air days in 30 yrs
- 2 days/yr
Risk factors via First Street. Map © Google.
Why this score? — see what drove the B+ grade
The composite is a weighted blend of 9 inputs, each scored 0–100. Each bar is that input's sub-score; the figure is the points it added to the 100-point composite (weight × sub-score).
- Cash flow +30.0/30.0
- ARV discount +15.0/15.0
- DSCR +10.0/10.0
- 1% rule +8.3/10.0
- Schools +4.3/10.0
- Livability +3.5/5.0
- Rent growth +2.9/5.0
- Condition / age +2.5/5.0
- Appreciation +0.0/10.0
$133,000
🖨 Deal sheet 📄 Offer letter ✓ Due diligence
Listing remarks MLS
This Single Family style home offers 3 bedrooms and 2 bathrooms with approximately 1,460 square feet of living space on a 0.19 acre corner lot. Plenty of storage space!! Come on by and take a look.
Key facts
- 8,276 sq ft lot
- Built 1984
- Listed 149 days
Neighborhood map
What this means for you Summary
Snapshot
- This is a 3-bed/2.0-bath single-family listed at $133k.
Deal economics
- At list price, monthly cash flow is $486 ($6k/yr) — positive.
- The deal already cash-flows at list — no discount required.
- Meets the 1% rule at list price ($2k rent vs $133k).
- Recommended offer: $117k (12.0% below list) — sets the bar for market timing.
- Cap rate 11.3% vs local median 5.9% in Slidell — top-decile yield for the area; either an underpriced asset or a hidden risk that comps aren't pricing in. Stress-test before assuming the spread holds.
Location & tenants
- Location reads 70/100 on livability (#57 in LA) — a middle-class / working-renter tenant base. Strengths: cost of living A+, housing A+, health & safety A+; Watch: amenities F, commute F.
- St. Tammany Parish (suburban): math 43% / reading 55% proficiency, ranked #11 of 98 in LA (top 11%) — families likely to look elsewhere, expect single-tenant / working-renter base with shorter leases.
- Market conditions: Rents rising (+1.7%/yr); 589 active listings in the ZIP; 19 comparable units currently listed for rent nearby; rentals at typical pace (median 17d on market — plan ~3-4 weeks tenant-placement turnaround); solid renter incomes; 1,064 units permitted in St. Tammany Parish in 2024 (0 in 5+ unit buildings).
Forward outlook
- Local home prices are declining (-3.0%/yr); year-one equity from $920 of loan paydown is wiped out by about $4k of value loss. Plan a longer hold.
- St. Tammany County population projected at +27% by 2050 — long-run rental-demand tailwind backs the buy-and-hold thesis.
- At projected returns (-3.0% appreciation + 1.7% rent growth), your $37k cash investment doubles in ~9 years — after that, you're playing with house money.
Negotiation context
- It's been on market 149 days — a 12% lower offer ($117k) is reasonable based on typical stale-listing flexibility.
- 3 sale attempts since 5y ago; this cycle's ask has dropped $22k (14%) from the opening price — seller is motivated, your offer sets the floor, not the list.
Risks & watch-outs
- Watch-outs: flood insurance adds $66/mo.
- Climate carrying-cost: severe flood risk; severe wind risk, 99% chance of damaging wind over 30y; moderate wildfire risk; extreme-heat days projected 7→22/yr by 2055 (HVAC capex compounding) — expect insurance premiums to compound above CPI over the hold.
Questions for the listing agent
- It's been on market 149 days. Have you received any prior offers? Is the seller open to a 12% concession, seller financing, or rate buy-down credit?
- What's the actual annual flood-insurance premium (NFIP or private), and is the property in a SFHA with mandatory coverage?
- Why hasn't it sold? Are there any deal-killer items the seller is aware of (foundation, flood, title, zoning, code violations)?
- Is there a deadline driving the sale (1031 exchange, divorce, estate, relocation)? That informs how much negotiation room exists.
- Schools are B-rated — typically a magnet for longer-tenancy family renters. What's the average tenant stay here, and is there a school-zone premium baked into asking?
- What's the average days-on-market for RENTAL listings here right now (not sales)? A rising rental-DOM trend means longer vacancies and softer asking-rent achievability than the comps imply.
- What's the recent tenant-quality profile in this submarket — average credit score on applications, eviction rate, late-payment / NSF rate, and stable-employment percentage? A property-management company in the area should have these aggregated.
- How much new for-sale + rental construction is in the pipeline within 1–3 miles? Heavy new supply typically softens prices + rents 12–24 months out; constrained supply supports both.
Investment metrics
- 1% rule
- 1.33% ✓
- Cap rate
- 11.28%
- Cash-on-cash
- 17.81%
- DSCR
- 1.79
- GRM
- 6.3
CMA / ARV
- ARV (median comp)
- $225,892
- List price
- $133,000
- Delta
- -41.12%
- Verdict
- UNDERPRICED
- Comps
- 20 within 1.0 mi
Show comp detail 12 sales within ~0.75 mi
| Address | Dist | Beds/Ba | Sqft | Sold | Price | $/sf | Match |
|---|---|---|---|---|---|---|---|
| 1409 Kings Row | 0.11mi | 3/2.0 | 1,510 (+3%) | 2mo | $132,000 | $87 | 88 |
| 105 Foxcroft Dr | 0.27mi | 3/2.0 | 1,430 (-2%) | 3mo | $179,000 | $125 | 81 |
| 1621 Shylock Dr | 0.27mi | 3/2.0 | 1,565 (+7%) | 0mo | $199,000 | $127 | 75 |
| 1107 Cornwall Ct | 0.28mi | 3/2.0 | 1,560 (+7%) | 4mo | $89,000 | $57 | 72 |
| 696 Voters Rd | 0.36mi | 3/2.0 | 1,549 (+6%) | 3mo | $250,000 | $161 | 71 |
| 314 Brookhaven Ct | 0.55mi | 4/2.0 (+1) | 1,505 (+3%) | 2mo | $239,000 | $159 | 62 |
| 2029 Wellington Ln | 0.58mi | 3/2.0 | 1,350 (-8%) | 1mo | $155,000 | $115 | 60 |
| 212 Brookhaven Ct | 0.48mi | 3/2.0 | 1,595 (+9%) | 3mo | $192,000 | $120 | 60 |
| 2005 Wellington Ln | 0.44mi | 4/2.0 (+1) | 1,604 (+10%) | 7mo | $49,500 | $31 | 52 |
| 323 Almond Creek Rd | 0.69mi | 3/2.0 | 1,326 (-9%) | 4mo | $89,980 | $68 | 49 |
| 57274 Cedar Ave | 0.70mi | 3/2.0 | 1,328 (-9%) | 6mo | $179,900 | $135 | 48 |
| 134 Foxbriar Ct | 0.67mi | 4/2.0 (+1) | 1,335 (-9%) | 7mo | $188,500 | $141 | 44 |
Match score weights: distance 35% · size 25% · config 20% · recency 20%. Top-matched comps best support the ARV.
Projected returns pro-forma
-3.0% appreciation · 1.72% rent growth · sell at horizon
- IRR
- 5.0%
- Equity multiple
- 1.19×
- Total profit
- $7,185
- Equity at exit
- $19,831
- IRR
- 13.3%
- Equity multiple
- 2.00×
- Total profit
- $37,213
- Equity at exit
- $11,499
Cash invested: $37,240 (down + closing). Projections, not guarantees.
Landlord ↔ Tenant lean methodology
- Overall (STATE)
- 90 Strongly Landlord-Friendly
- State Louisiana
- 90 Strongly Landlord-Friendly · R+12
- County
- — inherits STATE
- City
- — inherits STATE
ZIP-level market 70461
- Home prices YoY
- -33.0%
- Rents YoY
- 1.7%
- Active inventory
- 589
- Price-to-rent
- 6.3×
Monthly cashflow live
- Estimated rent
- $1,773 high interval (Pro) →
- Mortgage (P&I)
- −$697
- Tax from tax record
- −$95 /mo · $1,138/yr
- Insurance
- −$55
- Flood insurance flood zone
- −$66 /mo · $798/yr
- HOA
- −$0
- Vacancy / Maint / Mgmt
- −$372
- Net cashflow
- $486
Break-even live
UW: 25.0% down · 7.5% · 30yr · 1.5% tax · 5.0% vac · 8.0% maint · 8.0% mgmt
Financing live
Cash to close
- Down payment
- $33,250
- Closing costs
- $3,990
- Reserves months
- —
- Total cash needed
- —
Loan-product check · same deal, 3 products live
Conventional
25% down · 7.5% · 30yr
- Down + closing
- —
- Monthly P&I
- —
- Monthly cashflow
- —
- DSCR
- —
- Eligible?
- —
Personal DTI + credit; lowest rate.
DSCR
20% down · 8.5% · 30yr
- Down + closing
- —
- Monthly P&I
- —
- Monthly cashflow
- —
- DSCR
- —
- Eligible?
- —
No personal income docs; deal must DSCR.
Hard money
10% down · 12.0% · 12mo
- Down + closing
- —
- Monthly P&I
- —
- Monthly cashflow
- —
- DSCR
- —
- Eligible?
- —
Short-term bridge; refi at stabilization.
Rent comps 19 comps
| Address | Beds | Baths | Sqft | Rent | $/sqft | DOM | Units | Dist |
|---|---|---|---|---|---|---|---|---|
| 1402 Shakespeare Ct Slidell, LA | 4.0 | 2.0 | 1347 | $1,725 | $1.28 | 44d | 1 | 0.08mi |
| 1918 Hempstead Dr Unit NA Slidell, LA | 4.0 | 2.0 | 1615 | $1,750 | $1.08 | 24d | 1 | 0.40mi |
| 1805 Brookter St Slidell, LA | 3.0 | 2.0 | 1027 | $1,650 | $1.61 | 3d | 1 | 0.41mi |
| 310 Foxcroft Dr Slidell, LA | 4.0 | 2.0 | 1535 | $1,950 | $1.27 | 24d | 1 | 0.41mi |
| 221 Bella Sera Ln Slidell, LA | 3.0 | 2.0 | 1028 | $1,525 | $1.48 | 12d | 1 | 0.44mi |
| 2012 Dylan Dr Slidell, LA | 3.0 | 2.0 | 1700 | $1,950 | $1.15 | 24d | 1 | 0.60mi |
| 1640 Town Center Pkwy Slidell, LA | 3.0 | 1.0–2.0 | 959 | $1,895 | $1.98 | 2d | 46 | 0.61mi |
| 128 Foxbriar Ct Slidell, LA | 3.0 | 2.0 | 1395 | $1,650 | $1.18 | 44d | 1 | 0.68mi |
| 57346 Maple Ave Slidell, LA | 3.0 | 2.5 | 1550 | $1,500 | $0.97 | 44d | 1 | 0.84mi |
| 57376 Beech Ave Slidell, LA | 2.0 | 1.5 | 1000 | $1,350 | $1.35 | 17d | 1 | 0.90mi |
| 57376 Beech Ave Slidell, LA | 2.0 | 1.5 | 1004 | $1,350 | $1.34 | 15d | 1 | 0.90mi |
| 1000 Clairise Ct Slidell, LA | 3.0 | 2.0 | 1319 | $1,900 | $1.44 | 44d | 1 | 0.91mi |
| 57389 Brookter Rd Slidell, LA | 2.0 | 1.0 | 971 | $1,200 | $1.24 | 20d | 1 | 0.93mi |
| 1303 Town Center Pkwy Slidell, LA | 3.0 | 1.0–2.0 | 990 | $1,825 | $1.84 | 2d | 31 | 0.97mi |
| 200 Long St Slidell, LA | 2.0–4.0 | 2.0 | 1112 | $1,373 | $1.23 | 2d | 1 | 1.25mi |
| 577 Panther Dr Slidell, LA | 3.0 | 2.0 | 1483 | $1,850 | $1.25 | 3d | 1 | 1.32mi |
| 2009 Beth Dr Slidell, LA | 3.0 | 2.0 | 1500 | $1,750 | $1.17 | 3d | 1 | 1.38mi |
| 3159 Dee St Slidell, LA | 3.0 | 1.0 | 898 | $1,400 | $1.56 | 44d | 1 | 1.42mi |
| 901 Old Spanish Trl Slidell, LA | 2.0 | 1.5 | 1070 | $1,120 | $1.05 | 12d | 1 | 1.46mi |
Listing history 24 events
-
2026-06-18days on market $133,000 Active 149 DOM
-
2026-06-17days on market $133,000 Active 148 DOM
-
2026-06-16days on market $133,000 Active 147 DOM
-
2026-06-15days on market $133,000 Active 146 DOM
-
2026-06-13days on market $133,000 Active 144 DOM
-
2026-06-10days on market $133,000 Active 141 DOM
-
2026-06-09days on market $133,000 Active 140 DOM
-
2026-06-08days on market $133,000 Active 139 DOM
-
2026-06-07days on market $133,000 Active 138 DOM
-
2026-06-03days on market $133,000 Active 134 DOM
-
2026-06-02days on market $133,000 Active 133 DOM
-
2026-06-01days on market $133,000 Active 132 DOM
-
2026-05-31days on market $133,000 Active 131 DOM
-
2026-04-20price $139,900 197-char remark
Show marketing remark (197 chars)
This Single Family style home offers 3 bedrooms and 2 bathrooms with approximately 1,460 square feet of living space on a 0.19 acre corner lot. Plenty of storage space!! Come on by and take a look.
-
2026-04-20price $139,900 197-char remark
Show marketing remark (197 chars)
This Single Family style home offers 3 bedrooms and 2 bathrooms with approximately 1,460 square feet of living space on a 0.19 acre corner lot. Plenty of storage space!! Come on by and take a look.
-
2026-03-23price $144,900 197-char remark
Show marketing remark (197 chars)
This Single Family style home offers 3 bedrooms and 2 bathrooms with approximately 1,460 square feet of living space on a 0.19 acre corner lot. Plenty of storage space!! Come on by and take a look.
-
2026-03-23price $144,900 197-char remark
Show marketing remark (197 chars)
This Single Family style home offers 3 bedrooms and 2 bathrooms with approximately 1,460 square feet of living space on a 0.19 acre corner lot. Plenty of storage space!! Come on by and take a look.
-
2026-02-20price $149,900 197-char remark
Show marketing remark (197 chars)
This Single Family style home offers 3 bedrooms and 2 bathrooms with approximately 1,460 square feet of living space on a 0.19 acre corner lot. Plenty of storage space!! Come on by and take a look.
-
2026-02-20price $149,900 197-char remark
Show marketing remark (197 chars)
This Single Family style home offers 3 bedrooms and 2 bathrooms with approximately 1,460 square feet of living space on a 0.19 acre corner lot. Plenty of storage space!! Come on by and take a look.
-
2026-01-20$154,900 Active 197-char remark
Show marketing remark (197 chars)
This Single Family style home offers 3 bedrooms and 2 bathrooms with approximately 1,460 square feet of living space on a 0.19 acre corner lot. Plenty of storage space!! Come on by and take a look.
-
2026-01-20$154,900 Active 197-char remark
Show marketing remark (197 chars)
This Single Family style home offers 3 bedrooms and 2 bathrooms with approximately 1,460 square feet of living space on a 0.19 acre corner lot. Plenty of storage space!! Come on by and take a look.
-
2021-03-03soldstatus $164,700
-
2021-02-26soldstatus $164,700
-
2021-01-03$168,000
ⓘ Source: listings_history table (triggers on properties + properties_extension) + one-shot
backfill from property_details.listing_events for pre-trigger history.
Tax reassessment forecast LA · Resets to sale price
- Current annual tax
- $1,138 · $95/mo
- Projected year-2 tax
- $1,138 · $95/mo
- Expected delta
- $0/yr ($0/mo · 0.0%)
ⓘ Screening estimate from a state-policy table — verify with the county assessor before closing.
Climate risk First Street
- Flood 8/10 Severe FEMA zone X (shaded) · 75% chance over 30 yrs
- Wildfire 5/10 Major
- Heat 10/10 Extreme 7 d/yr ≥108°F today · 22 d/yr by 30 yrs out
- Wind 9/10 Extreme 99% chance of damaging wind over 30 yrs
- Air quality 2/10 Low 1 unhealthy d/yr today · 2 by 30 yrs out
Nearby sold comps map
Loading sold comps map…
Walkable amenities ~0.75 mi
Loading nearby amenities…
Taxation est. · year 1
- Rental income
- $21,272
- − Mortgage interest
- −$7,450
- − Property taxes
- −$1,138
- − Insurance
- −$1,462
- − Repairs & maintenance
- −$1,702
- − Management
- −$1,702
- − Depreciation
- −$3,869
- Taxable income
- $3,949
- Est. tax owed @ 24.0%
- −$948
- After-tax cash flow
- $4,887/yr
For passive investors: Depreciation is non-cash, so a rental often shows a tax loss while cash-flowing — sheltering income. Rental losses are passive: they offset passive income freely, and up to $25,000/yr can offset ordinary (W-2) income if you actively participate and your MAGI is under $100k (phasing out to $0 by $150k); unused losses carry forward. On sale, claimed depreciation is recaptured at up to 25%, and gains may owe capital-gains tax (a 1031 exchange can defer both). Figures are a year-1 estimate at your 24.0% rate — not tax advice; consult a CPA.
Schools (NCES district)
- District
- St. Tammany Parish
- NCES district ID
- 2201650
- Math proficiency
- 43% ▼ -32.00%
- Reading proficiency
- 55% ▼ -26.00%
- Median HH income
- $61,752
- Composite
- 43.04/100
- National rank
- #3098
- State rank
- #11 of 98 in LA
Livability — Slidell
- Score
- 70/100
- State rank
- #57
- US rank
- #7673
Category grades
Schools grade is shown separately in the Schools card above.
Census & demographics
- County
- Saint Tammany Parish · 228,296 people
- City population
- 95,511
- Metro
- New Orleans-Metairie, LA
- Population (ZIP)
- 34,808
- Household income
- $89,003
- Rent vs Own
- Severe rent burden
- 328.0
Population outlook (St. Tammany County) Hauer SSP2
- Today (2025)
- 286,725 people
- By 2030
- 304,175 · +6.1%
- By 2040
- 336,203 · +17.3%
- By 2050
- 364,590 · +27.2%
- By 2075
- 433,362 · +51.1%
- By 2100
- 470,333 · +64.0%
Race, ethnicity, and origin ACS 2023
- Neighborhood character
- Diverse neighborhood (Simpson 0.63)
- Race & ethnicity
- White 55% Black 24% Two or more races 14% Hispanic / Latino 11% Asian 3%
- Hispanic origin (detail)
- Common ancestry
- Lithuanian 9% Italian 1% Romanian 1%
- Foreign-born
- 8% · Canada, China, Vietnam
- Languages at home
- 89% English-only · Spanish 7% Chinese 1% Vietnamese 1%
Political lean MEDSL · St. Tammany
- 2024 margin
- Solid R (+43.8) · D 27.3% · R 71.1% · Other 1.6%
- 2008→2024 swing
- +9.6pp toward D · 2008: -53.4pp · 2024: -43.8pp
- All cycles
- 2024: R+43.8 2020: R+44.2 2016: R+50.8 2012: R+52.2 2008: R+53.4
Not yet ingested
- Civics
- —
Market trends
- HPI YoY
- ▼ -74.47%
- Current HPI
- 151.3353
- Rent YoY
- ▲ 1.72%
- Metro
- New Orleans-Metairie, LA
- State GDP YoY
- ▲ 3.29%
- F500 in state
- 10
Industry mix (Fortune 500 HQ in LA)
| Industry | F500 HQs | Revenue |
|---|---|---|
| Telecommunications | 2 | $23B |
|
||
| Utilities | 1 | $12B |
|
||
| Wholesale / Distribution | 1 | $5B |
|
||
| Advertising | 1 | $2B |
|
||
Price history
-16.7% since first listed11 events — show timeline
- 2026-04-20 Price Changed $139,900 AcadianaMLS
- 2026-04-20 Price Changed $139,900 GSREIN
- 2026-03-23 Price Changed $144,900 AcadianaMLS
- 2026-03-23 Price Changed $144,900 GSREIN
- 2026-02-20 Price Changed $149,900 AcadianaMLS
- 2026-02-20 Price Changed $149,900 GSREIN
- 2026-01-20 Listed $154,900 GSREIN
- 2026-01-20 Listed $154,900 AcadianaMLS
- 2021-03-03 Sold (Public Records) $164,700 Public Records
- 2021-02-26 Sold (MLS) $164,700 GSREIN
- 2021-01-03 Listed $168,000 GSREIN
Property tax history
-3.2%/yrLatest (2025): $1,138 · -3.0% YoY. Source: county tax records.
Cash-flow waterfall
monthlySold comps — $/sqft
last 12 mo · ≤1 miLoading sold comps…