 Multi-family
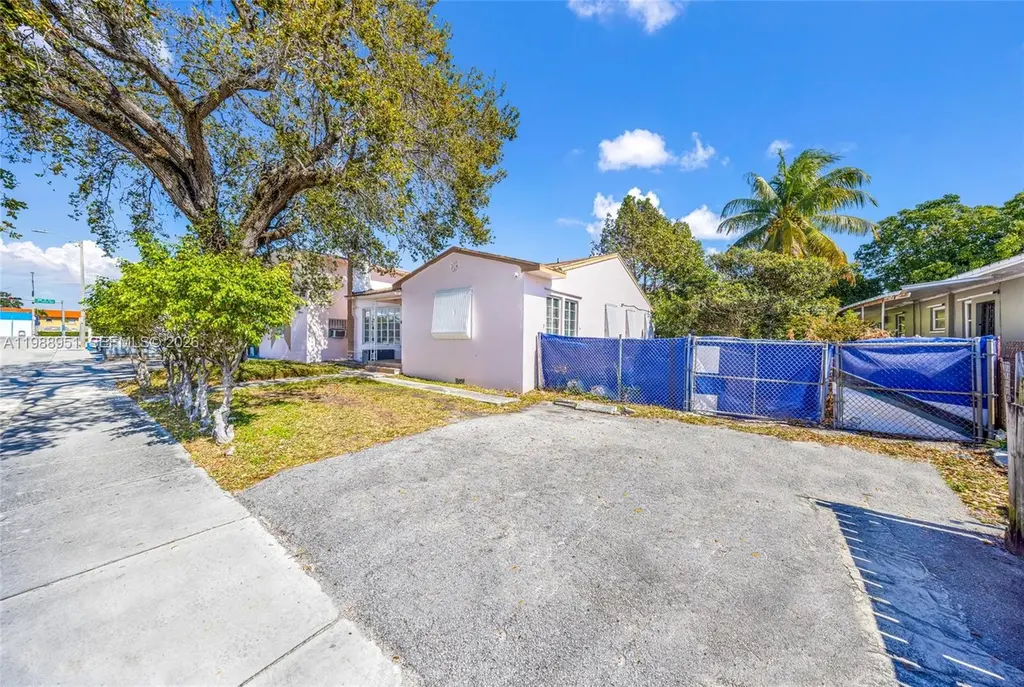
605 NW 34th Ave · Miami, FL
Flood risk 1/10 · Minimal
- FEMA flood zone
- X (unshaded)
- Chance of flooding over 30 yrs
- 0.0%
- Est. flood insurance / yr
- $507 – $1,088
Fire risk 1/10 · Minimal
- Est. fire insurance / yr
- $947 – $1,759
Heat risk 10/10 · Severe
- Hot days now (above 104°F)
- 7 days/yr
- Hot days in 30 yrs
- 28 days/yr
Wind risk 10/10 · Severe
- Chance of severe wind over 30 yrs
- 99.0%
Air-quality risk 2/10 · Minimal
- Unhealthy air days now
- 1 days/yr
- Unhealthy air days in 30 yrs
- 1 days/yr
Risk factors via First Street. Map © Google.
Why this score? — see what drove the C+ grade
The composite is a weighted blend of 9 inputs, each scored 0–100. Each bar is that input's sub-score; the figure is the points it added to the 100-point composite (weight × sub-score).
- Cash flow +27.1/30.0
- DSCR +9.4/10.0
- ARV discount +7.5/15.0
- 1% rule +6.8/10.0
- Schools +4.2/10.0
- Livability +3.9/5.0
- Condition / age +2.5/5.0
- Rent growth +2.2/5.0
- Appreciation +0.0/10.0
$1,700,000
🖨 Deal sheet 📄 Offer letter ✓ Due diligence
Multi-family units
County records classify this as Multi-Family (5+ Unit). Listing-text estimate: 1 unit. estimate disagrees with records
5+ unit building — per-unit beds/baths from public records are typically unavailable; the breakdown below (if shown) is an estimate from the listing text.
Listing remarks
Value-add "compound" opportunity featuring a unique 6-unit residential property on an expansive 10,400 Sq. Ft. lot. This property offers a versatile unit mix consisting of a standalone 3-bedroom, 2-bathroom single-family home (built 1948) and a separate two story 5-unit apartment building (built 1963) featuring all 1-bedroom, 1-bathroom layouts. All structures feature solid CBS construction and "great bones, " providing the perfect canvas for an investor to renovate and capture massive rental upside. Current Gross income $97,045 Current NOI $66,255 Strategically located in a high-demand growth pocket, the property is just blocks from the Magic City Casino and the futu
Key facts
- 400 sq ft lot
- Standalone 3 bedroom
- Health district
Tags
Property features AI
Finance
- Financial info: Rent includes trash collection; Unit rents reported: $1,600; $1,275; $1,475; $2,300
Exterior
- Parking: Total of 7 parking spaces; Open parking for units
- Utilities: Public sewer; Cable not available
- Home design: 2-story building; Shingle roof; Block construction; Effective year built
- Construction: Block construction; Shingle roof; Effective year built
- Exterior features: Open parking; Less than quarter acre lot
Interior
- Bedrooms: Four 1-bedroom units (month-to-month); Three 1-bedroom units (month-to-month); Two 1-bedroom units (month-to-month); One 3-bedroom unit (month-to-month)
- Flooring: Terrazzo; Tile
- Bathrooms: Each 1-bedroom unit has 1 full bathroom; 3-bedroom unit has 2 full bathrooms
- Heating & cooling: Central heating; Central air conditioning
- Interior features: Terrazzo and tile flooring; Central heating; Central air conditioning
Neighborhood map
What this means for you Summary
Snapshot
- This is a 6-bed/5.0-bath multifamily listed at $1.70M.
Deal economics
- At list price, monthly cash flow is $5k ($58k/yr) — positive.
- The deal already cash-flows at list — no discount required.
- Meets the 1% rule at list price ($20k rent vs $1.70M).
- Recommended offer: $1.60M (6.0% below list) — sets the bar for market timing.
- Cap rate 9.7% vs local median 1.9% in Miami — top-decile yield for the area; either an underpriced asset or a hidden risk that comps aren't pricing in. Stress-test before assuming the spread holds.
Location & tenants
- Location reads 78/100 on livability (#177 in FL, #2,724 nationally) — a middle-class / working-renter tenant base. Strengths: amenities A+, commute A+, health & safety A+; Watch: employment C-, crime F, cost of living F.
- Miami-Dade (suburban): math 45% / reading 54% proficiency, ranked #40 of 73 in FL (top 55%) — families likely to look elsewhere, expect single-tenant / working-renter base with shorter leases; 64% free/reduced lunch — lower-income household profile, screen leases tightly.
- Market conditions: Rents soft (-1.4%/yr); 239 active listings in the ZIP; 1 comparable units currently listed for rent nearby; lower-income renter base — watch delinquency; 10,051 units permitted in Miami-Dade County in 2024 (7,758 in 5+ unit buildings).
- At $20,034/mo this rent would consume 534% of the median local household income ($45k/yr) (locally 5223% of renters already pay >50% of income on rent) — very limited rent-growth headroom before tenants either downsize or default.
Forward outlook
- Local home prices are declining (-3.0%/yr); year-one equity from $12k of loan paydown is wiped out by about $51k of value loss. Plan a longer hold.
- Miami-Dade County population projected at +28% by 2050 — long-run rental-demand tailwind backs the buy-and-hold thesis.
Negotiation context
- It's been on market 86 days — a 6% lower offer ($1.60M) is reasonable based on typical stale-listing flexibility.
- Current owner paid $624k; list at $1.70M implies a 172% gain — meaningful room to come down on a strong offer.
Risks & watch-outs
- Climate carrying-cost: severe wind risk, 99% chance of damaging wind over 30y; extreme-heat days projected 7→28/yr by 2055 (HVAC capex compounding) — expect insurance premiums to compound above CPI over the hold.
Questions for the listing agent
- It's been on market 86 days. Have you received any prior offers? Is the seller open to a 6% concession, seller financing, or rate buy-down credit?
- Built in 1963 — when were the roof, HVAC, electrical panel, plumbing, and water heater last replaced?
- Why hasn't it sold? Are there any deal-killer items the seller is aware of (foundation, flood, title, zoning, code violations)?
- Is there a deadline driving the sale (1031 exchange, divorce, estate, relocation)? That informs how much negotiation room exists.
- Schools are B-rated — typically a magnet for longer-tenancy family renters. What's the average tenant stay here, and is there a school-zone premium baked into asking?
- Crime grade is F in this area — have there been break-ins, vandalism, or insurance claims at this property in the last 3 years? What carrier currently insures it and at what premium?
- What's the average days-on-market for RENTAL listings here right now (not sales)? A rising rental-DOM trend means longer vacancies and softer asking-rent achievability than the comps imply.
- What's the recent tenant-quality profile in this submarket — average credit score on applications, eviction rate, late-payment / NSF rate, and stable-employment percentage? A property-management company in the area should have these aggregated.
- How much new apartment / multifamily construction is in the pipeline within 1–3 miles? Heavy new supply (>2% of stock underway) typically softens rents 12–24 months out; light construction supports rent growth.
Investment metrics
- 1% rule
- 1.18% ✓
- Cap rate
- 9.69%
- Cash-on-cash
- 12.13%
- DSCR
- 1.54
- GRM
- 7.1
CMA / ARV
No comps found within radius.
Projected returns pro-forma
-3.0% appreciation · 0.0% rent growth · sell at horizon
- IRR
- -1.6%
- Equity multiple
- 0.94×
- Total profit
- $-27,896
- Equity at exit
- $253,476
- IRR
- 4.7%
- Equity multiple
- 1.30×
- Total profit
- $142,795
- Equity at exit
- $146,985
Cash invested: $476,000 (down + closing). Projections, not guarantees.
Landlord ↔ Tenant lean methodology
- Overall (STATE)
- 87 Strongly Landlord-Friendly
- State Florida
- 87 Strongly Landlord-Friendly · R+3
- County
- — inherits STATE
- City
- — inherits STATE
ZIP-level market 33125
- Rents YoY
- -1.4%
- Active inventory
- 239
- Price-to-rent
- 35.9×
Monthly cashflow live
- Estimated rent
- $20,034 medium interval (Pro) →
- Mortgage (P&I)
- −$8,915
- Tax from tax record
- −$1,392 /mo · $16,706/yr
- Insurance
- −$708
- HOA
- −$0
- Vacancy / Maint / Mgmt
- −$4,207
- Net cashflow
- $4,811
Break-even live
6-unit breakdown (identical units grouped — click to expand)
| Units | Beds | Baths | Est. rent |
|---|---|---|---|
| 1× unit | 3 | 2 | $3,943 |
| 5× units | 1 | 1 | $16,090 |
| #2 | 1 | 1 | $3,218 |
| #3 | 1 | 1 | $3,218 |
| #4 | 1 | 1 | $3,218 |
| #5 | 1 | 1 | $3,218 |
| #6 | 1 | 1 | $3,218 |
| Total (6 units) | $20,034 | ||
UW: 25.0% down · 7.5% · 30yr · 1.5% tax · 5.0% vac · 8.0% maint · 8.0% mgmt
Financing live
Cash to close
- Down payment
- $425,000
- Closing costs
- $51,000
- Reserves months
- —
- Total cash needed
- —
Loan-product check · same deal, 3 products live
Conventional
25% down · 7.5% · 30yr
- Down + closing
- —
- Monthly P&I
- —
- Monthly cashflow
- —
- DSCR
- —
- Eligible?
- —
Personal DTI + credit; lowest rate.
DSCR
20% down · 8.5% · 30yr
- Down + closing
- —
- Monthly P&I
- —
- Monthly cashflow
- —
- DSCR
- —
- Eligible?
- —
No personal income docs; deal must DSCR.
Hard money
10% down · 12.0% · 12mo
- Down + closing
- —
- Monthly P&I
- —
- Monthly cashflow
- —
- DSCR
- —
- Eligible?
- —
Short-term bridge; refi at stabilization.
Rent comps 1 comps
| Address | Beds | Baths | Sqft | Rent | $/sqft | DOM | Units | Dist |
|---|---|---|---|---|---|---|---|---|
| 2951 NW 13th St Unit 1399868P Miami, FL | 4.0–8.0 | 3.5–6.0 | 3745 | $17,671 | $4.72 | 8d | 2 | 0.72mi |
Listing history 16 events
-
2026-06-18days on market $1,700,000 Active 86 DOM
-
2026-06-17days on market $1,700,000 Active 85 DOM
-
2026-06-16days on market $1,700,000 Active 84 DOM
-
2026-06-15days on market $1,700,000 Active 83 DOM
-
2026-06-13days on market $1,700,000 Active 81 DOM
-
2026-06-09days on market $1,700,000 Active 77 DOM
-
2026-06-08days on market $1,700,000 Active 76 DOM
-
2026-06-07days on market $1,700,000 Active 75 DOM
-
2026-06-04days on market $1,700,000 Active 72 DOM
-
2026-06-03days on market $1,700,000 Active 71 DOM
-
2026-06-02days on market $1,700,000 Active 70 DOM
-
2026-06-01days on market $1,700,000 Active 69 DOM
-
2026-05-31days on market $1,700,000 Active 68 DOM
-
2026-03-20$1,700,000 Active
-
2019-07-31soldstatus $624,500
-
2002-01-08soldstatus $235,000
ⓘ Source: listings_history table (triggers on properties + properties_extension) + one-shot
backfill from property_details.listing_events for pre-trigger history.
Tax reassessment forecast FL · Resets to sale price
- Current annual tax
- $16,706 · $1,392/mo
- Projected year-2 tax
- $16,706 · $1,392/mo
- Expected delta
- $0/yr ($0/mo · 0.0%)
ⓘ Screening estimate from a state-policy table — verify with the county assessor before closing.
Climate risk First Street
- Flood 1/10 Low FEMA zone X (unshaded) · 0% chance over 30 yrs
- Wildfire 1/10 Low
- Heat 10/10 Extreme 7 d/yr ≥104°F today · 28 d/yr by 30 yrs out
- Wind 10/10 Extreme 99% chance of damaging wind over 30 yrs
- Air quality 2/10 Low 1 unhealthy d/yr today · 1 by 30 yrs out
Nearby sold comps map
Loading sold comps map…
Walkable amenities ~0.75 mi
Loading nearby amenities…
Taxation est. · year 1
- Rental income
- $240,408
- − Mortgage interest
- −$95,226
- − Property taxes
- −$16,706
- − Insurance
- −$8,500
- − Repairs & maintenance
- −$19,233
- − Management
- −$19,233
- − Depreciation
- −$49,455
- Taxable income
- $32,055
- Est. tax owed @ 24.0%
- −$7,693
- After-tax cash flow
- $50,043/yr
For passive investors: Depreciation is non-cash, so a rental often shows a tax loss while cash-flowing — sheltering income. Rental losses are passive: they offset passive income freely, and up to $25,000/yr can offset ordinary (W-2) income if you actively participate and your MAGI is under $100k (phasing out to $0 by $150k); unused losses carry forward. On sale, claimed depreciation is recaptured at up to 25%, and gains may owe capital-gains tax (a 1031 exchange can defer both). Figures are a year-1 estimate at your 24.0% rate — not tax advice; consult a CPA.
Schools (NCES district)
- District
- Miami-Dade
- NCES district ID
- 1200390
- Math proficiency
- 45% ▼ -16.00%
- Reading proficiency
- 54% ▼ -5.00%
- Median HH income
- $43,928
- Composite
- 41.76/100
- National rank
- #3397
- State rank
- #40 of 73 in FL
Livability — Miami
- Score
- 78/100
- State rank
- #177
- US rank
- #2724
Category grades
Schools grade is shown separately in the Schools card above.
Census & demographics
- Census place
- Miami, FL
- County
- Miami-Dade County · 2,697,751 people
- City population
- 827,308
- Metro
- Miami-Fort Lauderdale-Pompano Beach, FL
- Population (ZIP)
- 56,897
- Household income
- $44,979
- Rent vs Own
- Severe rent burden
- 5223.0
Population outlook (Miami-Dade County) Hauer SSP2
- Today (2025)
- 3,126,439 people
- By 2030
- 3,325,765 · +6.4%
- By 2040
- 3,697,561 · +18.3%
- By 2050
- 4,012,134 · +28.3%
- By 2075
- 4,605,612 · +47.3%
- By 2100
- 4,866,598 · +55.7%
Race, ethnicity, and origin ACS 2023
- Neighborhood character
- Predominantly Hispanic (92%)
- Race & ethnicity
- Hispanic / Latino 92% Two or more races 52% White 4% Black 4%
- Hispanic origin (detail)
- Mexican 2% Puerto Rican 3% Cuban 46% Dominican 3% Salvadoran 1%
- Common ancestry
- Hispanic 1%
- Foreign-born
- 68% · Canada, Jamaica, Dominican Republic
- Languages at home
- 9% English-only · Spanish 90%
Political lean MEDSL · Miami-Dade
- 2024 margin
- R (+11.4) · D 43.9% · R 55.4%
- 2008→2024 swing
- -27.6pp toward R · 2008: 16.1pp · 2024: -11.4pp
- All cycles
- 2024: R+11.4 2020: D+7.3 2016: D+29.6 2012: D+23.7 2008: D+16.1
Not yet ingested
- Civics
- —
Market trends
- HPI YoY
- ▼ -402.98%
- Current HPI
- 476.1631
- Rent YoY
- ▼ -1.39%
- Metro
- Miami-Fort Lauderdale-Pompano Beach, FL
- State GDP YoY
- ▲ 3.28%
- F500 in state
- 36
Industry mix (Fortune 500 HQ in FL)
| Industry | F500 HQs | Revenue |
|---|---|---|
| Industrial Technology | 2 | $29B |
|
||
| Insurance | 2 | $17B |
|
||
| Retail | 1 | $60B |
|
||
| Technology Distribution | 1 | $58B |
|
||
| Homebuilding | 1 | $35B |
|
||
| Technology Manufacturing | 1 | $35B |
|
||
Price history
+623.4% since first listed3 events — show timeline
- 2026-03-20 Listed $1,700,000 MARMLS
- 2019-07-31 Sold (Public Records) $624,500 Public Records
- 2002-01-08 Sold (Public Records) $235,000 Public Records
Property tax history
+8.1%/yrLatest (2025): $16,706 · +3.7% YoY. Source: county tax records.
Cash-flow waterfall
monthlySold comps — $/sqft
last 12 mo · ≤1 miLoading sold comps…