 Multi-family
1518 Miami St · South Bend, IN
Flood risk 1/10 · Minimal
- FEMA flood zone
- X (unshaded)
- Chance of flooding over 30 yrs
- 0.0%
- Est. flood insurance / yr
- $507 – $1,088
Fire risk 1/10 · Minimal
- Est. fire insurance / yr
- $717 – $1,331
Heat risk 3/10 · Minor
- Hot days now (above 99°F)
- 7 days/yr
- Hot days in 30 yrs
- 16 days/yr
Wind risk 2/10 · Minimal
- Chance of severe wind over 30 yrs
- —
Air-quality risk 3/10 · Minor
- Unhealthy air days now
- 2 days/yr
- Unhealthy air days in 30 yrs
- 3 days/yr
Risk factors via First Street. Map © Google.
Why this score? — see what drove the B- grade
The composite is a weighted blend of 9 inputs, each scored 0–100. Each bar is that input's sub-score; the figure is the points it added to the 100-point composite (weight × sub-score).
- Cash flow +30.0/30.0
- 1% rule +10.0/10.0
- DSCR +10.0/10.0
- ARV discount +7.5/15.0
- Rent growth +3.5/5.0
- Livability +3.2/5.0
- Condition / age +2.0/5.0
- Schools +1.4/10.0
- Appreciation +0.0/10.0
$110,000
🖨 Deal sheet 📄 Offer letter ✓ Due diligence
Multi-family units
County records classify this as Multi-Family (2-4 Unit). Listing-text estimate: 1 unit. estimate disagrees with records
Listing remarks
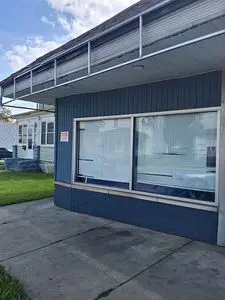
Mixed-use opportunity in Miami Village! 1518 Miami features a storefront plus an attached 2-bedroom apartment, creating potential for multiple income streams. Off-street parking for 2 vehicles and a location near Crooked Ewe, South Bend Farmers Market, Ivy Tech, Witches BrewPub, and LangLab place this property in the center of a growing area. Great opportunity for an owner-occupant or investor looking for future cash flow potential.
Key facts
- Attached apartment
- Off-street parking
- Storefront
Tags
Property features AI
Exterior
- Parking: Two open parking spaces
- Utilities: Public water; Public sewer
- Home design: Residential income property; Other property subtype
- Construction: Brick and vinyl siding exterior; Block foundation
- Exterior features: Level lot; Pets allowed
Interior
- Kitchen: Dishwasher; Refrigerator
- Flooring: Laminate flooring; Tile flooring
- Bathrooms: Two full bathrooms (both on the main level)
- Heating & cooling: Baseboard heating; Has heating
- Interior features: Partial basement; Basement present
Neighborhood map
What this means for you Summary
Snapshot
- This is a 2-bed/2.0-bath multifamily listed at $110k. Condition is rated fair.
Deal economics
- At list price, monthly cash flow is $680 ($8k/yr) — positive.
- The deal already cash-flows at list — no discount required.
- Meets the 1% rule at list price ($2k rent vs $110k).
- Recommended offer: $108k (1.5% below list) — sets the bar for market timing.
- Cap rate 13.7% vs local median 4.4% in South Bend — top-decile yield for the area; either an underpriced asset or a hidden risk that comps aren't pricing in. Stress-test before assuming the spread holds.
Location & tenants
- Location reads 64/100 on livability (#365 in IN) — a middle-class / working-renter tenant base. Strengths: cost of living A+, housing A+, health & safety A+; Watch: amenities D, employment D, crime F.
- South Bend Community School Corporation (urban): math 12% / reading 21% proficiency, ranked #284 of 301 in IN (top 94%) — low school quality limits family demand, transient renter base, plan for 1-2y turnover; 66% free/reduced lunch — lower-income household profile, screen leases tightly.
- Zoned schools: Lincoln Elementary School (math 7% / reading 6%, grade F, #964 of 994 statewide, top 97%, 467 students, 86% FRL); Jackson Middle School (math 3% / reading 8%, grade F, #326 of 330 statewide, top 99%, 528 students, 82% FRL); Riley High School (math 19% / reading 46%, grade F, #293 of 369 statewide, top 80%, 992 students, 67% FRL).
- Market conditions: Rents rising fast (+4.1%/yr); 77 active listings in the ZIP; 9 comparable units currently listed for rent nearby; rentals at typical pace (median 21d on market — plan ~3-4 weeks tenant-placement turnaround); lower-income renter base — watch delinquency; 754 units permitted in St. Joseph County in 2024 (460 in 5+ unit buildings).
- At $1,823/mo this rent would consume 51% of the median local household income ($43k/yr) (locally 545% of renters already pay >50% of income on rent) — very limited rent-growth headroom before tenants either downsize or default.
Forward outlook
- Local home prices are declining (-3.0%/yr); year-one equity from $761 of loan paydown is wiped out by about $3k of value loss. Plan a longer hold.
- At projected returns (-3.0% appreciation + 4.1% rent growth), your $31k cash investment doubles in ~5 years — after that, you're playing with house money.
Negotiation context
- It's been on market 30 days — a 2% lower offer ($108k) is reasonable based on typical stale-listing flexibility.
Risks & watch-outs
- Watch-outs: built in 1922 — expect roof / HVAC / electrical / plumbing capex.
Questions for the listing agent
- Have any recent inspections been done? Can we get a copy of the seller's disclosures and any deferred-maintenance estimates?
- Built in 1922 — when were the roof, HVAC, electrical panel, plumbing, and water heater last replaced?
- Is there a deadline driving the sale (1031 exchange, divorce, estate, relocation)? That informs how much negotiation room exists.
- Schools are F-rated, which usually means shorter tenancies and higher turnover. Who's the typical renter profile here, and what's been the actual vacancy rate?
- Crime grade is F in this area — have there been break-ins, vandalism, or insurance claims at this property in the last 3 years? What carrier currently insures it and at what premium?
- What's the average days-on-market for RENTAL listings here right now (not sales)? A rising rental-DOM trend means longer vacancies and softer asking-rent achievability than the comps imply.
- What's the recent tenant-quality profile in this submarket — average credit score on applications, eviction rate, late-payment / NSF rate, and stable-employment percentage? A property-management company in the area should have these aggregated.
- How much new apartment / multifamily construction is in the pipeline within 1–3 miles? Heavy new supply (>2% of stock underway) typically softens rents 12–24 months out; light construction supports rent growth.
Investment metrics
- 1% rule
- 1.66% ✓
- Cap rate
- 13.71%
- Cash-on-cash
- 26.49%
- DSCR
- 2.18
- GRM
- 5.0
CMA / ARV
No comps found within radius.
Projected returns pro-forma
-3.0% appreciation · 4.08% rent growth · sell at horizon
- IRR
- 21.5%
- Equity multiple
- 1.89×
- Total profit
- $27,514
- Equity at exit
- $16,401
- IRR
- 30.4%
- Equity multiple
- 3.86×
- Total profit
- $88,236
- Equity at exit
- $9,511
Cash invested: $30,800 (down + closing). Projections, not guarantees.
Landlord ↔ Tenant lean methodology
- Overall (STATE)
- 90 Strongly Landlord-Friendly
- State Indiana
- 90 Strongly Landlord-Friendly · R+11
- County
- — inherits STATE
- City
- — inherits STATE
ZIP-level market 46613
- Home prices YoY
- -7.2%
- Rents YoY
- 4.1%
- Active inventory
- 77
- Price-to-rent
- 9.2×
Monthly cashflow live
- Estimated rent
- $1,823 medium interval (Pro) →
- Mortgage (P&I)
- −$577
- Tax est. 1.5%
- −$138 /mo · $1,650/yr
- Insurance
- −$46
- HOA
- −$0
- Vacancy / Maint / Mgmt
- −$383
- Net cashflow
- $680
Break-even live
2-unit breakdown (identical units grouped — click to expand)
| Units | Beds | Baths | Est. rent |
|---|---|---|---|
| 1× unit | 2 | 1 | $994 |
| 1× unit | 0 | 1 | $829 |
| Total (2 units) | $1,823 | ||
UW: 25.0% down · 7.5% · 30yr · 1.5% tax · 5.0% vac · 8.0% maint · 8.0% mgmt
Financing live
Cash to close
- Down payment
- $27,500
- Closing costs
- $3,300
- Reserves months
- —
- Total cash needed
- —
Loan-product check · same deal, 3 products live
Conventional
25% down · 7.5% · 30yr
- Down + closing
- —
- Monthly P&I
- —
- Monthly cashflow
- —
- DSCR
- —
- Eligible?
- —
Personal DTI + credit; lowest rate.
DSCR
20% down · 8.5% · 30yr
- Down + closing
- —
- Monthly P&I
- —
- Monthly cashflow
- —
- DSCR
- —
- Eligible?
- —
No personal income docs; deal must DSCR.
Hard money
10% down · 12.0% · 12mo
- Down + closing
- —
- Monthly P&I
- —
- Monthly cashflow
- —
- DSCR
- —
- Eligible?
- —
Short-term bridge; refi at stabilization.
Rent comps 9 comps
| Address | Beds | Baths | Sqft | Rent | $/sqft | DOM | Units | Dist |
|---|---|---|---|---|---|---|---|---|
| 1213 E Donald St South Bend, IN | 2.0 | 1.0 | 648 | $1,050 | $1.62 | 21d | 1 | 0.45mi |
| 1701 E Donald St South Bend, IN | 2.0 | 1.0 | 720 | $1,075 | $1.49 | 43d | 1 | 0.78mi |
| 604 E South St South Bend, IN | 1.0 | 1.0 | 750 | $825 | $1.10 | 43d | 1 | 0.82mi |
| 533 Columbia St Unit C South Bend, IN | 1.0 | 1.0 | 600 | $700 | $1.17 | 21d | 1 | 0.95mi |
| 1106 S 20th St South Bend, IN | 1.0–3.0 | 1.0–2.0 | 885 | $924 | $1.04 | 13d | 1 | 0.96mi |
| 2804 Delaware St Mishawaka, IN | 2.0 | 1.0 | 720 | $1,200 | $1.67 | 13d | 1 | 1.11mi |
| 2530 Pleasant St Unit 3 South Bend, IN | 1.0 | 1.0 | 600 | $925 | $1.54 | 13d | 1 | 1.27mi |
| 2508 E Mishawaka Ave Unit 3A South Bend, IN | 1.0 | 1.0 | 600 | $1,200 | $2.00 | 43d | 1 | 1.29mi |
| 804 S 27th St South Bend, IN | 1.0 | 1.0 | 700 | $850 | $1.21 | 21d | 1 | 1.46mi |
Listing history 16 events
-
2026-06-18days on market $110,000 Active 30 DOM
-
2026-06-17days on market $110,000 Active 29 DOM
-
2026-06-16days on market $110,000 Active 28 DOM
-
2026-06-15days on market $110,000 Active 27 DOM
-
2026-06-14days on market $110,000 Active 25 DOM
-
2026-06-13days on market $110,000 Active 24 DOM
-
2026-06-10days on market $110,000 Active 22 DOM
-
2026-06-09days on market $110,000 Active 21 DOM
-
2026-06-08days on market $110,000 Active 20 DOM
-
2026-06-07days on market $110,000 Active 19 DOM
-
2026-06-03days on market $110,000 Active 15 DOM
-
2026-06-02days on market $110,000 Active 14 DOM
-
2026-06-01days on market $110,000 Active 13 DOM
-
2026-05-31days on market $110,000 Active 12 DOM
-
2026-05-30days on market $110,000 Active 11 DOM
-
2026-05-12$100,000 Active 174-char remark
ⓘ Source: listings_history table (triggers on properties + properties_extension) + one-shot
backfill from property_details.listing_events for pre-trigger history.
Climate risk First Street
- Flood 1/10 Low FEMA zone X (unshaded) · 0% chance over 30 yrs
- Wildfire 1/10 Low
- Heat 3/10 Moderate 7 d/yr ≥99°F today · 16 d/yr by 30 yrs out
- Wind 2/10 Low
- Air quality 3/10 Moderate 2 unhealthy d/yr today · 3 by 30 yrs out
Nearby sold comps map
Loading sold comps map…
Walkable amenities ~0.75 mi
Loading nearby amenities…
Taxation est. · year 1
- Rental income
- $21,876
- − Mortgage interest
- −$6,162
- − Property taxes
- −$1,650
- − Insurance
- −$550
- − Repairs & maintenance
- −$1,750
- − Management
- −$1,750
- − Depreciation
- −$3,200
- Taxable income
- $6,814
- Est. tax owed @ 24.0%
- −$1,635
- After-tax cash flow
- $6,524/yr
For passive investors: Depreciation is non-cash, so a rental often shows a tax loss while cash-flowing — sheltering income. Rental losses are passive: they offset passive income freely, and up to $25,000/yr can offset ordinary (W-2) income if you actively participate and your MAGI is under $100k (phasing out to $0 by $150k); unused losses carry forward. On sale, claimed depreciation is recaptured at up to 25%, and gains may owe capital-gains tax (a 1031 exchange can defer both). Figures are a year-1 estimate at your 24.0% rate — not tax advice; consult a CPA.
Condition & rehab AI · 1 photo
This property requires moderate renovations to improve its exterior, interior, and HVAC systems, significantly enhancing its resale and rental value.
Repairs flagged
- Major exterior siding — Severe weathering
- Major exterior paint — Peeling paint
- Major windows — Visible cracks in frames
- Major HVAC/mechanicals — No visible equipment
Value-add opportunities
- Both paint exterior — Enhances curb appeal and resale value
- Both repair windows — Improves energy efficiency and resale value
- Both install flooring — Enhances interior appeal and rental value
- Both upgrade HVAC — Improves comfort and energy efficiency
Renovation cost estimate screening
| Repair item | Severity | Est. cost |
|---|---|---|
| exterior siding · Severe weathering | Major | $15,000–50,000 |
| exterior paint · Peeling paint | Major | $15,000–50,000 |
| windows · Visible cracks in frames | Major | $15,000–50,000 |
| HVAC/mechanicals · No visible equipment | Major | $15,000–50,000 |
| Total estimated repair cost · 4 items | $60,000–200,000 |
Value-add ROI direction
- Both paint exterior — Enhances curb appeal and resale value ↑
- Both repair windows — Improves energy efficiency and resale value ↑
- Both install flooring — Enhances interior appeal and rental value ↑
- Both upgrade HVAC — Improves comfort and energy efficiency ↑
ⓘ Cost ranges are severity-bucket heuristics (US national rule-of-thumb). Get contractor quotes + a written scope before underwriting a rehab budget.
Schools (NCES district)
- District
- South Bend Community School Corporation
- NCES district ID
- 1810290
- Math proficiency
- 12% ▼ -10.00%
- Reading proficiency
- 21% ▼ -6.00%
- Median HH income
- $41,935
- Composite
- 14.21/100
- National rank
- #9452
- State rank
- #284 of 301 in IN
Livability — South Bend
- Score
- 64/100
- State rank
- #365
- US rank
- #13730
Category grades
Schools grade is shown separately in the Schools card above.
Census & demographics
- Census place
- South Bend, IN
- County
- Saint Joseph County · 189,048 people
- City population
- 99,767
- Metro
- South Bend-Mishawaka, IN-MI
- Population (ZIP)
- 12,279
- Household income
- $42,537
- Rent vs Own
- Severe rent burden
- 545.0
Population outlook (St. Joseph County) Hauer SSP2
- Today (2025)
- 273,186 people
- By 2030
- 273,594 · +0.1%
- By 2040
- 271,641 · -0.6%
- By 2050
- 269,187 · -1.5%
- By 2075
- 263,136 · -3.7%
- By 2100
- 245,659 · -10.1%
Race, ethnicity, and origin ACS 2023
- Neighborhood character
- Highly diverse neighborhood (Simpson 0.72)
- Race & ethnicity
- White 41% Hispanic / Latino 24% Black 23% Two or more races 22% Asian 2% Native American 1%
- Hispanic origin (detail)
- Mexican 22%
- Common ancestry
- Romanian 4% Italian 1% Slovak 1%
- Foreign-born
- 9% · Canada, Philippines
- Languages at home
- 81% English-only · Spanish 17% Other Asian/Pacific 1%
Political lean MEDSL · St. Joseph
- 2024 margin
- Toss-up / Even · D 50.0% · R 48.5% · Other 1.5%
- 2008→2024 swing
- -15.6pp toward R · 2008: 17.1pp · 2024: 1.5pp
- All cycles
- 2024: D+1.5 2020: D+5.8 2016: D+0.2 2012: D+3.5 2008: D+17.1
Not yet ingested
- Civics
- —
Market trends
- HPI YoY
- ▼ -20.88%
- Current HPI
- 270.0303
- Rent YoY
- ▲ 4.08%
- Metro
- South Bend-Mishawaka, IN-MI
- State GDP YoY
- ▲ 2.90%
- F500 in state
- 18
Industry mix (Fortune 500 HQ in IN)
| Industry | F500 HQs | Revenue |
|---|---|---|
| Industrial Machinery | 2 | $37B |
|
||
| Healthcare | 1 | $177B |
|
||
| Pharmaceuticals | 1 | $45B |
|
||
| Metals / Steel | 1 | $18B |
|
||
| Agriculture | 1 | $17B |
|
||
| Packaging | 1 | $12B |
|
||
Price history
1 event — show timeline
- 2026-05-19 Listed $110,000 IRMLS
Cash-flow waterfall
monthlySold comps — $/sqft
last 12 mo · ≤1 miLoading sold comps…