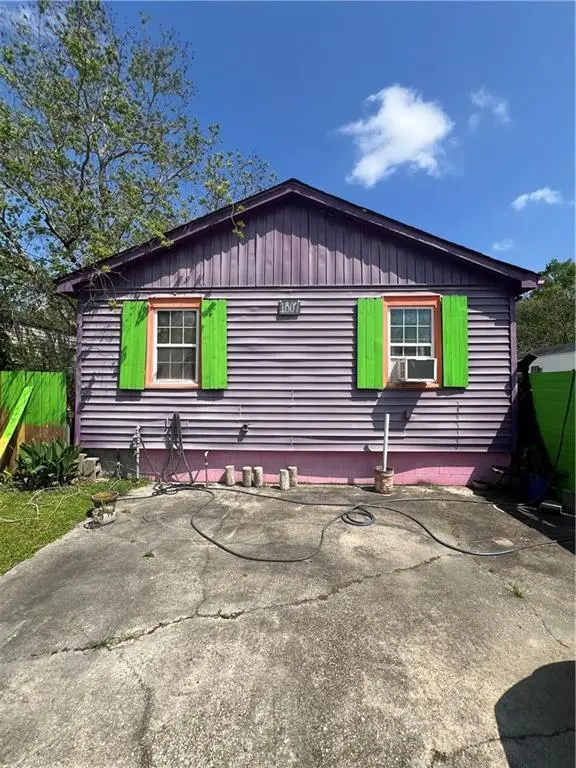
1807 Deborah Dr · Poydras, LA
Flood risk 8/10 · Major
- FEMA flood zone
- X (shaded)
- Chance of flooding over 30 yrs
- 0.6%
- Est. flood insurance / yr
- $507 – $1,088
Fire risk 1/10 · Minimal
- Est. fire insurance / yr
- $1,269 – $2,357
Heat risk 9/10 · Severe
- Hot days now (above 108°F)
- 7 days/yr
- Hot days in 30 yrs
- 20 days/yr
Wind risk 10/10 · Severe
- Chance of severe wind over 30 yrs
- 99.0%
Air-quality risk 2/10 · Minimal
- Unhealthy air days now
- 1 days/yr
- Unhealthy air days in 30 yrs
- 2 days/yr
Risk factors via First Street. Map © Google.
Why this score? — see what drove the B+ grade
The composite is a weighted blend of 9 inputs, each scored 0–100. Each bar is that input's sub-score; the figure is the points it added to the 100-point composite (weight × sub-score).
- Cash flow +30.0/30.0
- 1% rule +10.0/10.0
- DSCR +10.0/10.0
- Appreciation +7.7/10.0
- ARV discount +7.5/15.0
- Schools +5.0/10.0
- Livability +2.9/5.0
- Rent growth +2.5/5.0
- Condition / age +2.5/5.0
$55,000
🖨 Deal sheet 📄 Offer letter ✓ Due diligence
Listing remarks MLS
Great priced 3-bed 1-bath home in Lower St. Bernard. Perfect for a starter home, it has a nicely sized living room that opens to the kitchen and two spacious bedrooms. Property is fenced in, has an open deck, and a double driveway. The house is ready to move in, the enclosed back patio is damaged and will need to be torn down or replaced. Cash offers, or reno loans.
Key facts
- Open deck
- Double driveway
- Fenced in
Tags
Neighborhood map
What this means for you Summary
Snapshot
- This is a 3-bed/1.0-bath single-family listed at $55k.
Deal economics
- At list price, monthly cash flow is $620 ($7k/yr) — positive.
- The deal already cash-flows at list — no discount required.
- Meets the 1% rule at list price ($1k rent vs $55k).
- Recommended offer: $52k (6.0% below list) — sets the bar for market timing.
Location & tenants
- Location reads 58/100 on livability (#309 in LA) — a working-class tenant base; expect higher turnover. Strengths: cost of living A+, housing A-, crime B; Watch: amenities F, commute F, employment F.
- Market conditions: 95 active listings in the ZIP; 112 units permitted in St. Bernard Parish in 2024 (0 in 5+ unit buildings).
Forward outlook
- In year one you build about $3k of equity ($380 loan paydown + $3k appreciation (5.5% local appreciation)).
- St. Bernard County population projected at +89% by 2050 — long-run rental-demand tailwind backs the buy-and-hold thesis.
- At projected returns (5.5% appreciation + 3.0% rent growth), your $15k cash investment doubles in ~2 years — after that, you're playing with house money.
- By year 9, paydown + projected appreciation supports a ~$30k cash-out refi (75% LTV) — recoverable capital for the next deal without selling this one.
Negotiation context
- It's been on market 83 days — a 6% lower offer ($52k) is reasonable based on typical stale-listing flexibility.
- 4 sale attempts since 26y ago; this cycle's ask has dropped $5k (8%) from the opening price — seller is motivated, your offer sets the floor, not the list.
- Current owner paid $41k; 33% above their basis — modest negotiation headroom, anchor on the comps not their cost.
Risks & watch-outs
- Watch-outs: flood insurance adds $66/mo.
- Climate carrying-cost: severe flood risk; severe wind risk, 99% chance of damaging wind over 30y; extreme-heat days projected 7→20/yr by 2055 (HVAC capex compounding) — expect insurance premiums to compound above CPI over the hold.
Questions for the listing agent
- It's been on market 83 days. Have you received any prior offers? Is the seller open to a 6% concession, seller financing, or rate buy-down credit?
- What's the actual annual flood-insurance premium (NFIP or private), and is the property in a SFHA with mandatory coverage?
- Why hasn't it sold? Are there any deal-killer items the seller is aware of (foundation, flood, title, zoning, code violations)?
- Is there a deadline driving the sale (1031 exchange, divorce, estate, relocation)? That informs how much negotiation room exists.
- What's the average days-on-market for RENTAL listings here right now (not sales)? A rising rental-DOM trend means longer vacancies and softer asking-rent achievability than the comps imply.
- What's the recent tenant-quality profile in this submarket — average credit score on applications, eviction rate, late-payment / NSF rate, and stable-employment percentage? A property-management company in the area should have these aggregated.
- How much new for-sale + rental construction is in the pipeline within 1–3 miles? Heavy new supply typically softens prices + rents 12–24 months out; constrained supply supports both.
Investment metrics
- 1% rule
- 2.44% ✓
- Cap rate
- 21.27%
- Cash-on-cash
- 53.48%
- DSCR
- 3.38
- GRM
- 3.4
CMA / ARV
- ARV (median comp)
- $174,282
- List price
- $55,000
- Delta
- -68.44%
- Verdict
- UNDERPRICED
- Comps
- 20 within 1.0 mi
Show comp detail 3 sales within ~0.75 mi
| Address | Dist | Beds/Ba | Sqft | Sold | Price | $/sf | Match |
|---|---|---|---|---|---|---|---|
| 1913 Joseph Dr | 0.14mi | 3/2.0 | 1,289 (-4%) | 15mo | $160,000 | $124 | 70 |
| 2501 Torres Dr | 0.69mi | 3/1.0 | 1,151 (-15%) | 13mo | $172,000 | $149 | 33 |
| 2504 Torres Dr | 0.72mi | 3/1.5 | 1,144 (-15%) | 12mo | $112,000 | $98 | 29 |
Match score weights: distance 35% · size 25% · config 20% · recency 20%. Top-matched comps best support the ARV.
Projected returns pro-forma
5.49% appreciation · 3.0% rent growth · sell at horizon
- IRR
- 56.6%
- Equity multiple
- 4.49×
- Total profit
- $53,765
- Equity at exit
- $32,814
- IRR
- 54.0%
- Equity multiple
- 9.30×
- Total profit
- $127,836
- Equity at exit
- $58,043
Cash invested: $15,400 (down + closing). Projections, not guarantees.
Landlord ↔ Tenant lean methodology
- Overall (STATE)
- 90 Strongly Landlord-Friendly
- State Louisiana
- 90 Strongly Landlord-Friendly · R+12
- County
- — inherits STATE
- City
- — inherits STATE
ZIP-level market 70085
- Home prices YoY
- 3.4%
- Active inventory
- 95
- Price-to-rent
- 3.4×
Monthly cashflow live
- Estimated rent
- $1,342 medium interval (Pro) →
- Mortgage (P&I)
- −$288
- Tax from tax record
- −$63 /mo · $754/yr
- Insurance
- −$23
- Flood insurance flood zone
- −$66 /mo · $798/yr
- HOA
- −$0
- Vacancy / Maint / Mgmt
- −$282
- Net cashflow
- $620
Break-even live
UW: 25.0% down · 7.5% · 30yr · 1.5% tax · 5.0% vac · 8.0% maint · 8.0% mgmt
Financing live
Cash to close
- Down payment
- $13,750
- Closing costs
- $1,650
- Reserves months
- —
- Total cash needed
- —
Loan-product check · same deal, 3 products live
Conventional
25% down · 7.5% · 30yr
- Down + closing
- —
- Monthly P&I
- —
- Monthly cashflow
- —
- DSCR
- —
- Eligible?
- —
Personal DTI + credit; lowest rate.
DSCR
20% down · 8.5% · 30yr
- Down + closing
- —
- Monthly P&I
- —
- Monthly cashflow
- —
- DSCR
- —
- Eligible?
- —
No personal income docs; deal must DSCR.
Hard money
10% down · 12.0% · 12mo
- Down + closing
- —
- Monthly P&I
- —
- Monthly cashflow
- —
- DSCR
- —
- Eligible?
- —
Short-term bridge; refi at stabilization.
Listing history 19 events
-
2026-06-18days on market $55,000 Active 83 DOM
-
2026-06-17days on market $55,000 Active 82 DOM
-
2026-06-16days on market $55,000 Active 81 DOM
-
2026-06-15days on market $55,000 Active 80 DOM
-
2026-06-13days on market $55,000 Active 78 DOM
-
2026-06-10days on market $55,000 Active 75 DOM
-
2026-06-09days on market $55,000 Active 74 DOM
-
2026-06-08days on market $55,000 Active 73 DOM
-
2026-06-07days on market $55,000 Active 72 DOM
-
2026-06-03days on market $55,000 Active 68 DOM
-
2026-06-02days on market $55,000 Active 67 DOM
-
2026-06-01days on market $55,000 Active 66 DOM
-
2026-05-31days on market $55,000 Active 65 DOM
-
2026-03-27$60,000 Active 368-char remark
Show marketing remark (368 chars)
Great priced 3-bed 1-bath home in Lower St. Bernard. Perfect for a starter home, it has a nicely sized living room that opens to the kitchen and two spacious bedrooms. Property is fenced in, has an open deck, and a double driveway. The house is ready to move in, the enclosed back patio is damaged and will need to be torn down or replaced. Cash offers, or reno loans.
-
2000-07-28soldstatus $41,240
-
2000-07-26soldstatus $41,240
-
2000-06-16$44,900
-
2000-06-16$44,900
ⓘ Source: listings_history table (triggers on properties + properties_extension) + one-shot
backfill from property_details.listing_events for pre-trigger history.
Tax reassessment forecast LA · Resets to sale price
- Current annual tax
- $754 · $63/mo
- Projected year-2 tax
- $754 · $63/mo
- Expected delta
- $0/yr ($0/mo · 0.0%)
ⓘ Screening estimate from a state-policy table — verify with the county assessor before closing.
Climate risk First Street
- Flood 8/10 Severe FEMA zone X (shaded) · 60% chance over 30 yrs
- Wildfire 1/10 Low
- Heat 9/10 Extreme 7 d/yr ≥108°F today · 20 d/yr by 30 yrs out
- Wind 10/10 Extreme 99% chance of damaging wind over 30 yrs
- Air quality 2/10 Low 1 unhealthy d/yr today · 2 by 30 yrs out
Nearby sold comps map
Loading sold comps map…
Walkable amenities ~0.75 mi
Loading nearby amenities…
Taxation est. · year 1
- Rental income
- $16,110
- − Mortgage interest
- −$3,081
- − Property taxes
- −$754
- − Insurance
- −$1,072
- − Repairs & maintenance
- −$1,289
- − Management
- −$1,289
- − Depreciation
- −$1,600
- Taxable income
- $7,025
- Est. tax owed @ 24.0%
- −$1,686
- After-tax cash flow
- $5,753/yr
For passive investors: Depreciation is non-cash, so a rental often shows a tax loss while cash-flowing — sheltering income. Rental losses are passive: they offset passive income freely, and up to $25,000/yr can offset ordinary (W-2) income if you actively participate and your MAGI is under $100k (phasing out to $0 by $150k); unused losses carry forward. On sale, claimed depreciation is recaptured at up to 25%, and gains may owe capital-gains tax (a 1031 exchange can defer both). Figures are a year-1 estimate at your 24.0% rate — not tax advice; consult a CPA.
Schools (NCES district)
No district data.
Livability — Poydras
- Score
- 58/100
- State rank
- #309
- US rank
- #21341
Category grades
Schools grade is shown separately in the Schools card above.
Census & demographics
- Population (ZIP)
- 4,952
Population outlook (St. Bernard County) Hauer SSP2
- Today (2025)
- 66,513 people
- By 2030
- 77,768 · +16.9%
- By 2040
- 101,296 · +52.3%
- By 2050
- 125,770 · +89.1%
- By 2075
- 188,160 · +182.9%
- By 2100
- 239,339 · +259.8%
Race, ethnicity, and origin ACS 2023
- Neighborhood character
- Majority White (62%)
- Race & ethnicity
- White 62% Hispanic / Latino 26% Two or more races 16% Black 5% Native American 1%
- Hispanic origin (detail)
- Puerto Rican 1%
- Common ancestry
- Lithuanian 17% Italian 2% Serbian 1%
- Foreign-born
- 1% · Canada
- Languages at home
- 96% English-only · Spanish 3% French/Haitian/Cajun 1%
Political lean MEDSL · St. Bernard
- 2024 margin
- Strong R (+29.3) · D 34.5% · R 63.8% · Other 1.7%
- 2008→2024 swing
- +16.1pp toward D · 2008: -45.4pp · 2024: -29.3pp
- All cycles
- 2024: R+29.3 2020: R+28.5 2016: R+33.4 2012: R+24.7 2008: R+45.4
Not yet ingested
- Civics
- —
Market trends
- HPI YoY
- ▲ 5.49%
- Current HPI
- 168.4026
- Rent YoY
- —
- Metro
- —
- State GDP YoY
- ▲ 3.29%
- F500 in state
- 10
Industry mix (Fortune 500 HQ in LA)
| Industry | F500 HQs | Revenue |
|---|---|---|
| Telecommunications | 2 | $23B |
|
||
| Utilities | 1 | $12B |
|
||
| Wholesale / Distribution | 1 | $5B |
|
||
| Advertising | 1 | $2B |
|
||
Price history
+33.6% since first listed6 events — show timeline
- 2026-03-27 Listed $60,000 AcadianaMLS
- 2026-03-27 Listed $60,000 GSREIN
- 2000-07-28 Sold (Public Records) $41,240 Public Records
- 2000-07-26 Sold (MLS) $41,240 GSREIN
- 2000-06-16 Listed $44,900 AcadianaMLS
- 2000-06-16 Listed $44,900 GSREIN
Property tax history
+3.4%/yrLatest (2024): $754 · +8.4% YoY. Source: county tax records.
Cash-flow waterfall
monthlySold comps — $/sqft
last 12 mo · ≤1 miLoading sold comps…