 Fourplex
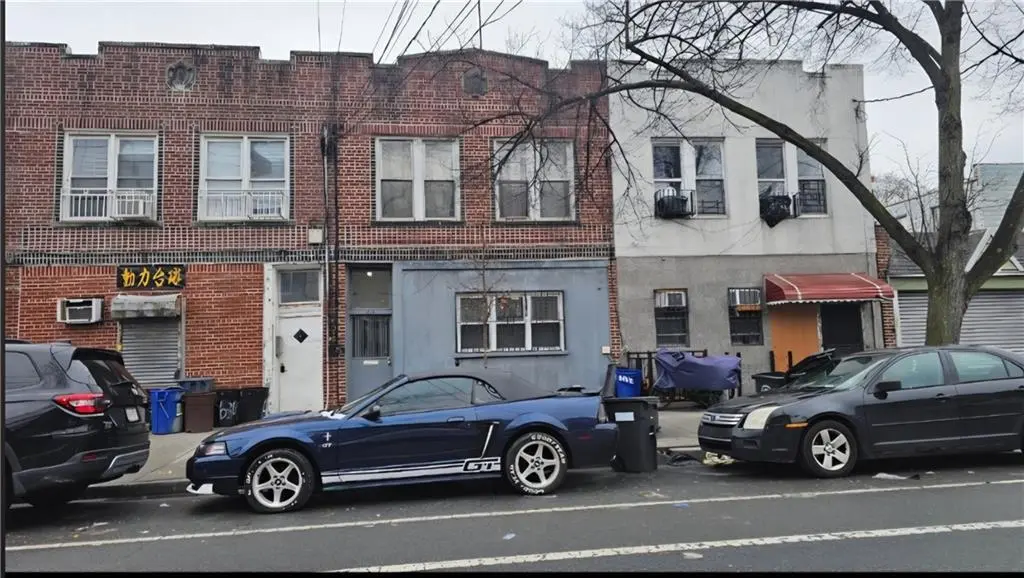
6309 10th Ave · New York, NY
Flood risk 4/10 · Minor
- FEMA flood zone
- X (unshaded)
- Chance of flooding over 30 yrs
- 0.2%
- Est. flood insurance / yr
- $507 – $1,088
Fire risk 1/10 · Minimal
- Est. fire insurance / yr
- $691 – $1,283
Heat risk 7/10 · Major
- Hot days now (above 97°F)
- 7 days/yr
- Hot days in 30 yrs
- 16 days/yr
Wind risk 6/10 · Moderate
- Chance of severe wind over 30 yrs
- 61.0%
Air-quality risk 4/10 · Minor
- Unhealthy air days now
- 5 days/yr
- Unhealthy air days in 30 yrs
- 7 days/yr
Risk factors via First Street. Map © Google.
Why this score? — see what drove the D- grade
The composite is a weighted blend of 9 inputs, each scored 0–100. Each bar is that input's sub-score; the figure is the points it added to the 100-point composite (weight × sub-score).
- Appreciation +10.0/10.0
- ARV discount +7.5/15.0
- Cash flow +6.3/30.0
- Schools +5.0/10.0
- Livability +3.8/5.0
- Rent growth +2.5/5.0
- Condition / age +2.5/5.0
- 1% rule +0.7/10.0
- DSCR +0.6/10.0
$1,750,000
🖨 Deal sheet 📄 Offer letter ✓ Due diligence
Multi-family units
County records classify this as Multi-Family (2-4 Unit). Listing-text estimate: 4 units. confirmed
Listing remarks
Bensonhurst. Great Location! Beautiful 4 family brick. Great for investment or use. Close to all. Must see. .. .. ..
Key facts
- Great location
- 4 family brick
- 1,600 sq ft lot
Tags
Property features AI
Finance
- Financial info: Financing considered: Exchange, Bank Mortgage, or Cash; Multifamily with 4 units (income details: Unit 1 rent $1,700; Unit 2 rent $1,750; Unit 3 projected rent $2,000; Unit 4 rent $1,700)
Exterior
- Parking: No designated parking
- Utilities: Electric: Other; Hot water: Other
- Home design: Attached building; Residential property; Zoned R5B
- Construction: Brick construction; Other roof (see remarks); Other foundation; Building footprint approximately 1,600 (dimensions 80.00 x 20.00)
- Exterior features: Other yard (see remarks)
Interior
- Bedrooms: Unit 1: 1 bedroom (1st floor); Unit 2: 2 bedrooms (1st floor); Unit 3: 2 bedrooms (2nd floor); Unit 4: 2 bedrooms (2nd floor)
- Flooring: Other flooring (see remarks)
- Bathrooms: Four full bathrooms total; Each unit has one full bathroom
- Heating & cooling: Heating fuel: Other; Heat delivery: Other; No air conditioning units
- Interior features: Full basement; Other flooring (see remarks); No central air units
Neighborhood map
What this means for you Summary
Snapshot
- This is a 4 × 7-bed/4.0-bath units multifamily listed at $1.75M.
Deal economics
- At list price, monthly cash flow is $-3k ($-37k/yr) — negative. Per door: $-777/mo.
- To cash-flow at today's rent, offer at most $1.20M (31.4% below list).
- To meet the 1% rule (rent ≥ 1% of price), the offer needs to be $994k (43.2% below list).
- Recommended offer: $994k (43.2% below list) — sets the bar for 1% rule.
- Cap rate 4.2% vs local median 2.6% in New York — top-decile yield for the area; either an underpriced asset or a hidden risk that comps aren't pricing in. Stress-test before assuming the spread holds.
Location & tenants
- Location reads 75/100 on livability (#268 in NY, #4,188 nationally) — a middle-class / working-renter tenant base. Strengths: amenities A+, commute A+, health & safety A; Watch: crime F, cost of living F.
- Market conditions: 123 active listings in the ZIP; 10,063 units permitted in Kings County in 2024 (9,789 in 5+ unit buildings).
- At $9,943/mo this rent would consume 204% of the median local household income ($58k/yr) (locally 6849% of renters already pay >50% of income on rent) — very limited rent-growth headroom before tenants either downsize or default.
Forward outlook
- In year one you build about $187k of equity ($12k loan paydown + $175k appreciation (10.0% local appreciation)).
- Kings County population projected at +13% by 2050 — modest demand growth; plan on rents tracking national, not racing it.
- By year 2, paydown + projected appreciation supports a ~$301k cash-out refi (75% LTV) — recoverable capital for the next deal without selling this one.
Negotiation context
- Only 10 days on market — expect competitive offers; lowballing is unlikely to land.
- Current owner paid $109k; list at $1.75M implies a 1506% gain — meaningful room to come down on a strong offer.
Risks & watch-outs
- Watch-outs: built in 1931 — expect roof / HVAC / electrical / plumbing capex.
- Climate carrying-cost: major wind risk, 61% chance of damaging wind over 30y; extreme-heat days projected 7→16/yr by 2055 (HVAC capex compounding) — expect insurance premiums to compound above CPI over the hold.
Questions for the listing agent
- What do current leases actually rent for vs. the listed asking? Can we see a recent rent roll and the last 12 months of T-12 income?
- Can we see the unit-by-unit rent roll, current vacancy, and any below-market leases? What's the average tenancy length?
- What capital expenditures (roof, boiler, parking lot, exteriors) have been made in the last 5 years, and what's planned in the next 2?
- Built in 1931 — when were the roof, HVAC, electrical panel, plumbing, and water heater last replaced?
- Is there a deadline driving the sale (1031 exchange, divorce, estate, relocation)? That informs how much negotiation room exists.
- Schools are B-rated — typically a magnet for longer-tenancy family renters. What's the average tenant stay here, and is there a school-zone premium baked into asking?
- Crime grade is F in this area — have there been break-ins, vandalism, or insurance claims at this property in the last 3 years? What carrier currently insures it and at what premium?
- The area grade is low — what's the realistic commute time and amenity access for the typical tenant pool here? Any planned neighborhood developments (good or bad) we should know about?
- What's the average days-on-market for RENTAL listings here right now (not sales)? A rising rental-DOM trend means longer vacancies and softer asking-rent achievability than the comps imply.
- What's the recent tenant-quality profile in this submarket — average credit score on applications, eviction rate, late-payment / NSF rate, and stable-employment percentage? A property-management company in the area should have these aggregated.
- How much new apartment / multifamily construction is in the pipeline within 1–3 miles? Heavy new supply (>2% of stock underway) typically softens rents 12–24 months out; light construction supports rent growth.
Investment metrics
- 1% rule
- 0.57% ✗
- Cap rate
- 4.16%
- Cash-on-cash
- -7.61%
- DSCR
- 0.66
- GRM
- 14.7
CMA / ARV
No comps found within radius.
Projected returns pro-forma
10.0% appreciation · 3.0% rent growth · sell at horizon
- IRR
- 18.9%
- Equity multiple
- 2.54×
- Total profit
- $754,699
- Equity at exit
- $1,576,539
- IRR
- 17.5%
- Equity multiple
- 5.85×
- Total profit
- $2,376,968
- Equity at exit
- $3,399,865
Cash invested: $490,000 (down + closing). Projections, not guarantees.
Landlord ↔ Tenant lean methodology
- Overall (CITY)
- 0 Strongly Tenant-Friendly
- State New York
- 15 Strongly Tenant-Friendly · D+10
- County
- — inherits STATE
- City New York
- 0 Strongly Tenant-Friendly · D+34
ZIP-level market 11219
- Home prices YoY
- 4.9%
- Active inventory
- 123
- Price-to-rent
- 58.7×
Monthly cashflow live
- Estimated rent
- $9,943 medium interval (Pro) →
- Mortgage (P&I)
- −$9,177
- Tax from tax record
- −$1,055 /mo · $12,661/yr
- Insurance
- −$729
- HOA
- −$0
- Vacancy / Maint / Mgmt
- −$2,088
- Net cashflow
- $-3,106
Break-even live
4-unit breakdown (identical units grouped — click to expand)
| Units | Beds | Baths | Est. rent |
|---|---|---|---|
| 4× units | 7 | 4 | $9,944 |
| #1 | 7 | 4 | $2,486 |
| #2 | 7 | 4 | $2,486 |
| #3 | 7 | 4 | $2,486 |
| #4 | 7 | 4 | $2,486 |
| Total (4 units) | $9,943 | ||
UW: 25.0% down · 7.5% · 30yr · 1.5% tax · 5.0% vac · 8.0% maint · 8.0% mgmt
Financing live
Cash to close
- Down payment
- $437,500
- Closing costs
- $52,500
- Reserves months
- —
- Total cash needed
- —
Loan-product check · same deal, 3 products live
Conventional
25% down · 7.5% · 30yr
- Down + closing
- —
- Monthly P&I
- —
- Monthly cashflow
- —
- DSCR
- —
- Eligible?
- —
Personal DTI + credit; lowest rate.
DSCR
20% down · 8.5% · 30yr
- Down + closing
- —
- Monthly P&I
- —
- Monthly cashflow
- —
- DSCR
- —
- Eligible?
- —
No personal income docs; deal must DSCR.
Hard money
10% down · 12.0% · 12mo
- Down + closing
- —
- Monthly P&I
- —
- Monthly cashflow
- —
- DSCR
- —
- Eligible?
- —
Short-term bridge; refi at stabilization.
Listing history 7 events
-
2026-06-18days on market $1,750,000 Active 10 DOM
-
2026-06-17days on market $1,750,000 Active 9 DOM
-
2026-06-16days on market $1,750,000 Active 8 DOM
-
2026-06-15days on market $1,750,000 Active 7 DOM
-
2026-06-13days on market $1,750,000 Active 5 DOM
-
2026-06-08remarks 116-char remark
-
2026-06-08$1,750,000 Active 1 DOM
ⓘ Source: listings_history table (triggers on properties + properties_extension) + one-shot
backfill from property_details.listing_events for pre-trigger history.
Tax reassessment forecast NY · Partial reset (capped growth)
- Current annual tax
- $12,661 · $1,055/mo
- Projected year-2 tax
- $21,118 · $1,760/mo
- Expected delta
- +$8,457/yr (+$705/mo · 66.8%)
ⓘ Screening estimate from a state-policy table — verify with the county assessor before closing.
Climate risk First Street
- Flood 4/10 Moderate FEMA zone X (unshaded) · 20% chance over 30 yrs
- Wildfire 1/10 Low
- Heat 7/10 Severe 7 d/yr ≥97°F today · 16 d/yr by 30 yrs out
- Wind 6/10 Major 61% chance of damaging wind over 30 yrs
- Air quality 4/10 Moderate 5 unhealthy d/yr today · 7 by 30 yrs out
Nearby sold comps map
Loading sold comps map…
Walkable amenities ~0.75 mi
Loading nearby amenities…
Taxation est. · year 1
- Rental income
- $119,316
- − Mortgage interest
- −$98,027
- − Property taxes
- −$12,661
- − Insurance
- −$8,750
- − Repairs & maintenance
- −$9,545
- − Management
- −$9,545
- − Depreciation
- −$50,909
- Taxable loss
- −$70,122
- Est. tax savings @ 24.0%
- +$16,829
- After-tax cash flow
- $-20,448/yr
For passive investors: Depreciation is non-cash, so a rental often shows a tax loss while cash-flowing — sheltering income. Rental losses are passive: they offset passive income freely, and up to $25,000/yr can offset ordinary (W-2) income if you actively participate and your MAGI is under $100k (phasing out to $0 by $150k); unused losses carry forward. On sale, claimed depreciation is recaptured at up to 25%, and gains may owe capital-gains tax (a 1031 exchange can defer both). Figures are a year-1 estimate at your 24.0% rate — not tax advice; consult a CPA.
Schools (NCES district)
No district data.
Livability — New York
- Score
- 75/100
- State rank
- #268
- US rank
- #4188
Category grades
Schools grade is shown separately in the Schools card above.
Census & demographics
- Census place
- New York, NY
- County
- Kings County · 2,614,986 people
- City population
- 7,731,280
- Metro
- New York-Newark-Jersey City, NY-NJ-PA
- Population (ZIP)
- 94,196
- Household income
- $58,347
- Rent vs Own
- Severe rent burden
- 6849.0
Population outlook (Kings County) Hauer SSP2
- Today (2025)
- 2,847,441 people
- By 2030
- 2,937,006 · +3.1%
- By 2040
- 3,095,491 · +8.7%
- By 2050
- 3,228,968 · +13.4%
- By 2075
- 3,321,723 · +16.7%
- By 2100
- 3,111,387 · +9.3%
Race, ethnicity, and origin ACS 2023
- Neighborhood character
- Diverse neighborhood (Simpson 0.58)
- Race & ethnicity
- White 60% Asian 21% Hispanic / Latino 13% Two or more races 3% Black 1%
- Hispanic origin (detail)
- Mexican 5% Puerto Rican 2%
- Common ancestry
- Romanian 4% Italian 2% Scotch-Irish 1%
- Foreign-born
- 30% · China, Canada, Jamaica
- Languages at home
- 18% English-only · German/W. Germanic 39% Chinese 19% Spanish 13%
Political lean MEDSL · Kings
- 2024 margin
- Solid D (+44.0) · D 72.0% · R 28.0%
- 2008→2024 swing
- -15.5pp toward R · 2008: 59.4pp · 2024: 44.0pp
- All cycles
- 2024: D+44.0 2020: D+54.8 2016: D+61.8 2012: D+63.9 2008: D+59.4
Not yet ingested
- Civics
- —
Market trends
- HPI YoY
- ▲ 14.87%
- Current HPI
- 315.9088
- Rent YoY
- —
- Metro
- New York-Newark-Jersey City, NY-NJ-PA
- State GDP YoY
- ▲ 2.60%
- F500 in state
- 92
Industry mix (Fortune 500 HQ in NY)
| Industry | F500 HQs | Revenue |
|---|---|---|
| Financial Services | 10 | $950B |
|
||
| Consumer Goods | 9 | $162B |
|
||
| Insurance | 4 | $225B |
|
||
| Telecommunications | 2 | $144B |
|
||
| Pharmaceuticals | 2 | $112B |
|
||
| Media / Entertainment | 2 | $69B |
|
||
Price history
+1505.5% since first listed2 events — show timeline
- 2026-06-08 Listed $1,750,000 BNYMLS
- 1984-07-01 Sold (Public Records) $109,000 Public Records
Property tax history
+5.4%/yrLatest (2024): $12,661 · +14.2% YoY. Source: county tax records.
Cash-flow waterfall
monthlySold comps — $/sqft
last 12 mo · ≤1 miLoading sold comps…