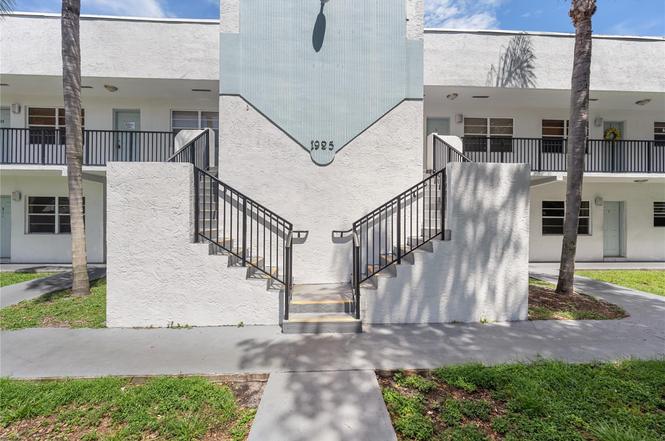
1925 Madison St #22 · Hollywood, FL
Flood risk No data
- FEMA flood zone
- —
- Chance of flooding over 30 yrs
- —
- Est. flood insurance / yr
- —
Fire risk No data
- Est. fire insurance / yr
- —
Heat risk No data
- Hot days now (above threshold)
- —
- Hot days in 30 yrs
- —
Wind risk No data
- Chance of severe wind over 30 yrs
- —
Air-quality risk No data
- Unhealthy air days now
- —
- Unhealthy air days in 30 yrs
- —
Risk factors via First Street. Map © Google.
Why this score? — see what drove the D grade
The composite is a weighted blend of 9 inputs, each scored 0–100. Each bar is that input's sub-score; the figure is the points it added to the 100-point composite (weight × sub-score).
- Cash flow +9.4/30.0
- 1% rule +7.5/10.0
- ARV discount +7.5/15.0
- Schools +4.1/10.0
- Livability +3.8/5.0
- DSCR +2.6/10.0
- Rent growth +2.6/5.0
- Condition / age +2.5/5.0
- Appreciation +0.0/10.0
$165,000
🖨 Deal sheet 📄 Offer letter ✓ Due diligence
Listing remarks
SPACIOUS 1/1 WITH TILED FLOORS, VERY SPACIOUS AND ROOMY INSIDE. IT INCLUDES WATER AND TRASH IN THE MAINTENANCE FEES. CLOSE TO YOUNG CIRCLE AND THE HOLLYWOOD NIGHTLIFE & BEACH. VERY CENTRALLY LOCATED, CLOSE TO SHOPPING AND THE HOLLYWOOD CIRCLE, THEATERS, DON'T MISS OUT ON THIS DREAM UNIT. seller will pay up to 3% closing cost credit to buyer at the closing. Please see the HOA Application in the Supplements attached.
Key facts
- Tiled floors
- Close to theaters
- Close to shopping
Tags
Property features AI
Finance
- Financial info: Monthly HOA fee: $515
- HOA & community: Homeowners association with monthly fee; HOA fee includes grounds maintenance and water; Association provides parking
Exterior
- Parking: Carport (1 space, covered); Assigned covered parking
- Security: Smoke detectors; Security fence
- Utilities: Water service included in association fees
- Home design: Condominium; 2 stories; Resale condition; Faces south
- Construction: Block/CBS construction
- Exterior features: Not waterfront; Assigned parking
Interior
- Kitchen: Dishwasher; Electric range; Microwave; Refrigerator
- Bedrooms: Main level bedrooms not specified
- Flooring: Tile
- Bathrooms: 1 full bathroom
- Heating & cooling: Central electric heating; Central electric air conditioning
- Interior features: No notable built-in interior features; Blinds on windows
- Laundry & utility: Electric water heater
Neighborhood map
What this means for you Summary
Snapshot
- This is a 1-bed/1.0-bath condo listed at $165k.
Deal economics
- At list price, monthly cash flow is $-119 ($-1k/yr) — negative.
- To cash-flow at today's rent, offer at most $144k (12.7% below list).
- Meets the 1% rule at list price ($2k rent vs $165k).
- Recommended offer: $144k (12.7% below list) — sets the bar for cash-flow.
- Cap rate 5.4% vs local median 3.2% in Hollywood — top-decile yield for the area; either an underpriced asset or a hidden risk that comps aren't pricing in. Stress-test before assuming the spread holds.
Location & tenants
- Location reads 76/100 on livability (#232 in FL, #3,548 nationally) — a middle-class / working-renter tenant base. Strengths: commute A+, housing A+, crime B+; Watch: amenities D.
- Broward (suburban): math 42% / reading 53% proficiency, ranked #46 of 73 in FL (top 63%) — families likely to look elsewhere, expect single-tenant / working-renter base with shorter leases.
- Zoned schools: Hollywood Central Elementary School (math 22% / reading 32%, grade F, #1,969 of 2,144 statewide, top 94%, 351 students, 68% FRL); Olsen Middle School (math 18% / reading 24%, grade F, #555 of 571 statewide, top 97%, 633 students, 73% FRL); South Broward High School (math 24% / reading 49%, grade F, #351 of 667 statewide, top 54%, 2,397 students, 59% FRL) — zoned schools average 67% FRL vs 51% district-wide (15 pts higher); higher-poverty schools than district average — tighter screening recommended.
- Zoned-school proficiency averages 28% at this address vs 48% district-wide (-19 pts) — the specific schools serving this property underperform the Broward average; the district grade overstates school quality for this exact location.
- Market conditions: Rents flat; 589 active listings in the ZIP; 40 comparable units currently listed for rent nearby; rentals at typical pace (median 15d on market — plan ~3-4 weeks tenant-placement turnaround); 2,111 units permitted in Broward County in 2024 (1,265 in 5+ unit buildings).
- This rent runs 44% of the median local income ($56k/yr) — at the standard rent-burdened threshold; future hikes will face affordability resistance.
Forward outlook
- Local home prices are declining (-3.0%/yr); year-one equity from $1k of loan paydown is wiped out by about $5k of value loss. Plan a longer hold.
- Broward County population projected at +34% by 2050 — long-run rental-demand tailwind backs the buy-and-hold thesis.
Negotiation context
- It's been on market 99 days — a 9% lower offer ($150k) is reasonable based on typical stale-listing flexibility.
- 3 sale attempts; this cycle's ask is 9900% above the opening price — seller raised mid-cycle; expect resistance to lowballs.
Risks & watch-outs
- Watch-outs: HOA is 25% of rent.
Questions for the listing agent
- What do current leases actually rent for vs. the listed asking? Can we see a recent rent roll and the last 12 months of T-12 income?
- It's been on market 99 days. Have you received any prior offers? Is the seller open to a 13% concession, seller financing, or rate buy-down credit?
- What does the HOA fee cover, when was the last increase, and are there any pending special assessments or reserve-fund shortfalls?
- Any open or pending special assessments — roof, HVAC, plumbing, elevator, façade? What's the per-unit balance and payoff schedule, and is the seller paying it off at close or rolling it to the buyer?
- Why hasn't it sold? Are there any deal-killer items the seller is aware of (foundation, flood, title, zoning, code violations)?
- Is there a deadline driving the sale (1031 exchange, divorce, estate, relocation)? That informs how much negotiation room exists.
- The area grade is low — what's the realistic commute time and amenity access for the typical tenant pool here? Any planned neighborhood developments (good or bad) we should know about?
- What's the average days-on-market for RENTAL listings here right now (not sales)? A rising rental-DOM trend means longer vacancies and softer asking-rent achievability than the comps imply.
- What's the recent tenant-quality profile in this submarket — average credit score on applications, eviction rate, late-payment / NSF rate, and stable-employment percentage? A property-management company in the area should have these aggregated.
- How much new apartment / multifamily construction is in the pipeline within 1–3 miles? Heavy new supply (>2% of stock underway) typically softens rents 12–24 months out; light construction supports rent growth.
Investment metrics
- 1% rule
- 1.25% ✓
- Cap rate
- 5.43%
- Cash-on-cash
- -3.09%
- DSCR
- 0.86
- GRM
- 6.6
CMA / ARV
No comps found within radius.
Projected returns pro-forma
-3.0% appreciation · 0.43% rent growth · sell at horizon
- IRR
- -25.8%
- Equity multiple
- 0.15×
- Total profit
- $-39,109
- Equity at exit
- $24,602
- IRR
- -44.1%
- Equity multiple
- -0.35×
- Total profit
- $-62,465
- Equity at exit
- $14,266
Cash invested: $46,200 (down + closing). Projections, not guarantees.
Landlord ↔ Tenant lean methodology
- Overall (STATE)
- 87 Strongly Landlord-Friendly
- State Florida
- 87 Strongly Landlord-Friendly · R+3
- County
- — inherits STATE
- City
- — inherits STATE
ZIP-level market 33020
- Rents YoY
- 0.4%
- Active inventory
- 589
- Price-to-rent
- 6.6×
Monthly cashflow live
- Estimated rent
- $2,068 high interval (Pro) →
- Mortgage (P&I)
- −$865
- Tax from tax record
- −$304 /mo · $3,644/yr
- Insurance
- −$69
- HOA
- −$515
- Vacancy / Maint / Mgmt
- −$434
- Net cashflow
- $-119
Break-even live
UW: 25.0% down · 7.5% · 30yr · 1.5% tax · 5.0% vac · 8.0% maint · 8.0% mgmt
Financing live
Cash to close
- Down payment
- $41,250
- Closing costs
- $4,950
- Reserves months
- —
- Total cash needed
- —
Loan-product check · same deal, 3 products live
Conventional
25% down · 7.5% · 30yr
- Down + closing
- —
- Monthly P&I
- —
- Monthly cashflow
- —
- DSCR
- —
- Eligible?
- —
Personal DTI + credit; lowest rate.
DSCR
20% down · 8.5% · 30yr
- Down + closing
- —
- Monthly P&I
- —
- Monthly cashflow
- —
- DSCR
- —
- Eligible?
- —
No personal income docs; deal must DSCR.
Hard money
10% down · 12.0% · 12mo
- Down + closing
- —
- Monthly P&I
- —
- Monthly cashflow
- —
- DSCR
- —
- Eligible?
- —
Short-term bridge; refi at stabilization.
Rent comps 40 comps
| Address | Beds | Baths | Sqft | Rent | $/sqft | DOM | Units | Dist |
|---|---|---|---|---|---|---|---|---|
| 2001 Van Buren St Hollywood, FL | 2.0 | 1.0–2.0 | 788 | $2,801 | $3.55 | 15d | 171 | 0.20mi |
| 320 S Federal Hwy Hollywood, FL | 2.0 | 1.0–2.0 | 742 | $2,758 | $3.72 | 24d | 9 | 0.22mi |
| 303 S Federal Hwy Hollywood, FL | 1.0–3.0 | 1.0–3.0 | 992 | $2,175 | $2.19 | 2d | 35 | 0.26mi |
| 1818 Hollywood Blvd Hollywood, FL | 3.0 | 1.0–2.5 | 1089 | $2,764 | $2.54 | 1d | 17 | 0.30mi |
| 1770 S Young Cir Hollywood, FL | 2.0 | 1.0–2.0 | 881 | $3,652 | $4.15 | 1d | 42 | 0.30mi |
| 2165 Van Buren St Hollywood, FL | 3.0 | 1.0–3.0 | 1072 | $2,797 | $2.61 | 1d | 14 | 0.38mi |
| 1776 Polk St Hollywood, FL | 1.0–2.0 | 1.0–2.0 | 954 | $2,843 | $2.98 | 15d | 25 | 0.49mi |
| 2233 Hollywood Blvd Hollywood, FL | 1.0–2.0 | 1.0–2.0 | 913 | $2,540 | $2.78 | 15d | 94 | 0.50mi |
| 200 E Pembroke Rd Hallandale Beach, FL | 3.0 | 1.0–2.0 | 1006 | $2,840 | $2.82 | 1d | 62 | 0.74mi |
| 2630 Madison St Hollywood, FL | 1.0 | 1.0 | 400 | $1,500 | $3.75 | 24d | 1 | 0.88mi |
| 2630 Madison St Unit b Hollywood, FL | 1.0 | 1.0 | 400 | $1,500 | $3.75 | 24d | 1 | 0.88mi |
| 1927 Cleveland St Unit 1542853P Hollywood, FL | — | 1.0 | 570 | $2,722 | $4.78 | 2d | 1 | 1.16mi |
| 2829 Van Buren St #208 Hollywood, FL | — | 1.0 | 460 | $1,300 | $2.83 | 13d | 1 | 1.16mi |
| 2806 Taylor St Hollywood, FL | — | 1.0 | 450 | $1,449 | $3.22 | 7d | 1 | 1.18mi |
| 2806 Taylor St Apt C Hollywood, FL | 2.0 | 2.0 | 650 | $2,295 | $3.53 | 7d | 1 | 1.18mi |
| 2806 Taylor St Apt C Hollywood, FL | 2.0 | 2.0 | 650 | $2,295 | $3.53 | 24d | 1 | 1.18mi |
| 401 N Federal Hwy Hallandale Beach, FL | 1.0–3.0 | 1.0–2.0 | 973 | $1,892 | $1.94 | 15d | 48 | 1.19mi |
| 1710 McKinley St #5 Hollywood, FL | 1.0 | 1.0 | 573 | $1,400 | $2.44 | 24d | 1 | 1.21mi |
| 1710 McKinley St #5 Hollywood, FL | 1.0 | 1.0 | 573 | $1,450 | $2.53 | 18d | 1 | 1.21mi |
| 836 NW 10th St Unit 4 Hallandale Beach, FL | — | 1.0 | 423 | $1,250 | $2.96 | 24d | 1 | 1.22mi |
| 2204 McKinley St #2 Hollywood, FL | 1.0 | 1.0 | 635 | $1,800 | $2.83 | 1d | 1 | 1.22mi |
| 2204 McKinley St #2 Hollywood, FL | 1.0 | 1.0 | 635 | $1,850 | $2.91 | 17d | 1 | 1.22mi |
| 1815 McKinley St Unit 9 Hollywood, FL | 2.0 | 1.0 | 650 | $1,750 | $2.69 | 16d | 1 | 1.23mi |
| 840 NW 10th St Unit 8 Hallandale Beach, FL | 1.0 | 1.0 | 441 | $1,400 | $3.17 | 24d | 1 | 1.23mi |
| 2918 Jackson St Unit 1 Hollywood, FL | 2.0 | 1.0 | 750 | $1,700 | $2.27 | 7d | 1 | 1.23mi |
| 2918 Jackson St Hollywood, FL | 2.0 | 1.0 | 750 | $1,700 | $2.27 | 3d | 1 | 1.23mi |
| 2840 Taylor St #28 Hollywood, FL | 1.0 | 1.0 | 560 | $1,800 | $3.21 | 24d | 1 | 1.24mi |
| 1533 Cleveland St Hollywood, FL | 1.0 | 1.0 | 512 | $1,200 | $2.34 | 24d | 1 | 1.24mi |
| 2915 Jackson St Unit 12 Hollywood, FL | 1.0 | 1.0 | 500 | $1,425 | $2.85 | 16d | 1 | 1.25mi |
| 2915 Jackson St Hollywood, FL | 1.0 | 1.0 | 500 | $1,425 | $2.85 | 13d | 1 | 1.25mi |
| 2830 Fillmore St Unit 2 Hollywood, FL | 1.0 | 1.0 | 750 | $1,450 | $1.93 | 7d | 1 | 1.27mi |
| 2830 Fillmore St Unit 5 Hollywood, FL | 1.0 | 1.0 | 700 | $1,450 | $2.07 | 24d | 1 | 1.27mi |
| 1560 McKinley St Unit 115w Hollywood, FL | 1.0 | 1.5 | 665 | $1,500 | $2.26 | 3d | 1 | 1.27mi |
| 1425 Arthur St Unit 414B Hollywood, FL | 1.0 | 1.5 | 597 | $1,750 | $2.93 | 18d | 1 | 1.28mi |
| 2111 Roosevelt St Unit 3 Hollywood, FL | 1.0 | 1.0 | 600 | $1,425 | $2.38 | 24d | 1 | 1.30mi |
| 1520 McKinley St Unit 107E Hollywood, FL | 1.0 | 1.5 | 665 | $1,700 | $2.56 | 17d | 1 | 1.30mi |
| 1944 Taft St Unit 2 Hollywood, FL | 2.0 | 2.0 | 750 | $1,800 | $2.40 | 7d | 1 | 1.30mi |
| 1521 N 23rd Ave Hollywood, FL | 2.0 | 2.0 | 750 | $2,000 | $2.67 | 24d | 1 | 1.31mi |
| 1816 Taft St Unit 8 Hollywood, FL | 1.0 | 1.0 | 500 | $1,399 | $2.80 | 2d | 1 | 1.31mi |
| 2443 Cleveland St Unit 2 Hollywood, FL | 1.0 | 1.0 | 600 | $1,500 | $2.50 | 24d | 1 | 1.32mi |
HOA detail condo
- Monthly dues
- $515 · $6,180/yr
- Likely covers
- watertrash
- Assessments
- None detected in remarks — confirm with the listing agent.
Listing history 17 events
-
2026-06-18days on market $165,000 Active 99 DOM
-
2026-06-17days on market $165,000 Active 98 DOM
-
2026-06-16days on market $165,000 Active 97 DOM
-
2026-06-15days on market $165,000 Active 96 DOM
-
2026-06-13days on market $165,000 Active 94 DOM
-
2026-06-09days on market $165,000 Active 90 DOM
-
2026-06-07days on market $165,000 Active 88 DOM
-
2026-06-04days on market $165,000 Active 85 DOM
-
2026-06-03days on market $165,000 Active 84 DOM
-
2026-06-02days on market $165,000 Active 83 DOM
-
2026-06-01days on market $165,000 Active 82 DOM
-
2026-05-31days on market $165,000 Active 81 DOM
-
2026-04-21historical $1,650
-
2026-03-25$1,650
-
2026-03-24historical $1,650
-
2026-03-21$1,650
-
2025-08-30$165,000 Active
ⓘ Source: listings_history table (triggers on properties + properties_extension) + one-shot
backfill from property_details.listing_events for pre-trigger history.
Tax reassessment forecast FL · Resets to sale price
- Current annual tax
- $3,644 · $304/mo
- Projected year-2 tax
- $3,644 · $304/mo
- Expected delta
- $0/yr ($0/mo · 0.0%)
ⓘ Screening estimate from a state-policy table — verify with the county assessor before closing.
Nearby sold comps map
Loading sold comps map…
Walkable amenities ~0.75 mi
Loading nearby amenities…
Taxation est. · year 1
- Rental income
- $24,819
- − Mortgage interest
- −$9,243
- − Property taxes
- −$3,644
- − Insurance
- −$825
- − Repairs & maintenance
- −$1,985
- − Management
- −$1,985
- − HOA
- −$6,180
- − Depreciation
- −$4,800
- Taxable loss
- −$3,844
- Est. tax savings @ 24.0%
- +$922
- After-tax cash flow
- $-503/yr
For passive investors: Depreciation is non-cash, so a rental often shows a tax loss while cash-flowing — sheltering income. Rental losses are passive: they offset passive income freely, and up to $25,000/yr can offset ordinary (W-2) income if you actively participate and your MAGI is under $100k (phasing out to $0 by $150k); unused losses carry forward. On sale, claimed depreciation is recaptured at up to 25%, and gains may owe capital-gains tax (a 1031 exchange can defer both). Figures are a year-1 estimate at your 24.0% rate — not tax advice; consult a CPA.
Schools (NCES district)
- District
- Broward
- NCES district ID
- 1200180
- Math proficiency
- 42% ▼ -18.00%
- Reading proficiency
- 53% ▼ -5.00%
- Median HH income
- $52,139
- Composite
- 40.88/100
- National rank
- #3621
- State rank
- #46 of 73 in FL
Livability — Hollywood
- Score
- 76/100
- State rank
- #232
- US rank
- #3548
Category grades
Schools grade is shown separately in the Schools card above.
Census & demographics
- Census place
- Hollywood, FL
- County
- Broward County · 1,963,430 people
- City population
- 109,079
- Metro
- Miami-Fort Lauderdale-Pompano Beach, FL
- Population (ZIP)
- 46,322
- Household income
- $56,473
- Rent vs Own
- Severe rent burden
- 3948.0
Population outlook (Broward County) Hauer SSP2
- Today (2025)
- 2,207,033 people
- By 2030
- 2,360,704 · +7.0%
- By 2040
- 2,661,208 · +20.6%
- By 2050
- 2,946,698 · +33.5%
- By 2075
- 3,602,273 · +63.2%
- By 2100
- 3,970,984 · +79.9%
Race, ethnicity, and origin ACS 2023
- Neighborhood character
- Diverse neighborhood (Simpson 0.68)
- Race & ethnicity
- Hispanic / Latino 43% Two or more races 31% White 28% Black 24% Asian 1%
- Hispanic origin (detail)
- Mexican 1% Puerto Rican 4% Cuban 9% Dominican 3% Salvadoran 3%
- Common ancestry
- Hispanic 5% Lithuanian 2% Scotch-Irish 1%
- Foreign-born
- 41% · Canada, Jamaica, Dominican Republic
- Languages at home
- 48% English-only · Spanish 38% French/Haitian/Cajun 6% Russian/Polish/Slavic 2%
Political lean MEDSL · Broward
- 2024 margin
- D (+17.0) · D 58.0% · R 41.0%
- 2008→2024 swing
- -17.8pp toward R · 2008: 34.7pp · 2024: 17.0pp
- All cycles
- 2024: D+17.0 2020: D+29.8 2016: D+35.0 2012: D+34.9 2008: D+34.7
Not yet ingested
- Civics
- —
Market trends
- HPI YoY
- ▼ -406.34%
- Current HPI
- 524.7664
- Rent YoY
- ▲ 0.43%
- Metro
- Miami-Fort Lauderdale-Pompano Beach, FL
- State GDP YoY
- ▲ 3.28%
- F500 in state
- 36
Industry mix (Fortune 500 HQ in FL)
| Industry | F500 HQs | Revenue |
|---|---|---|
| Industrial Technology | 2 | $29B |
|
||
| Insurance | 2 | $17B |
|
||
| Retail | 1 | $60B |
|
||
| Technology Distribution | 1 | $58B |
|
||
| Homebuilding | 1 | $35B |
|
||
| Technology Manufacturing | 1 | $35B |
|
||
Price history
-99.0% since first listed5 events — show timeline
- 2026-04-21 Rental Removed $1,650 RMLSFL
- 2026-03-25 Listed for Rent $1,650 RMLSFL
- 2026-03-24 Rental Removed $1,650 GFLMLS
- 2026-03-21 Listed for Rent $1,650 GFLMLS
- 2025-08-30 Listed $165,000 Beaches MLS
Property tax history
+10.2%/yrLatest (2025): $3,644 · +5.5% YoY. Source: county tax records.
Cash-flow waterfall
monthlySold comps — $/sqft
last 12 mo · ≤1 miLoading sold comps…