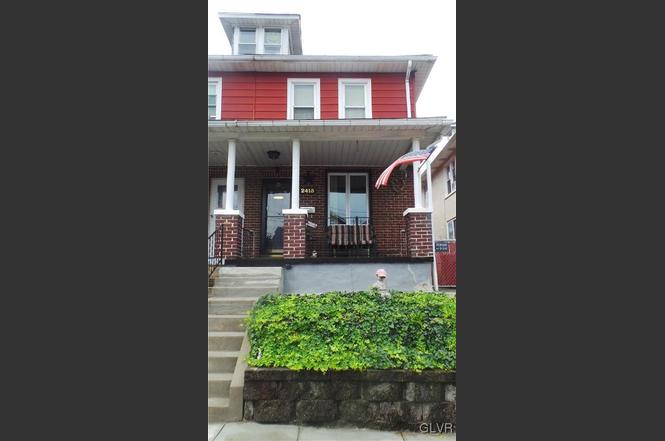
2415 Victor St · Wilson, PA
Flood risk 1/10 · Minimal
- FEMA flood zone
- X (unshaded)
- Chance of flooding over 30 yrs
- 0.0%
- Est. flood insurance / yr
- $473 – $860
Fire risk 3/10 · Minor
- Est. fire insurance / yr
- $511 – $949
Heat risk 5/10 · Moderate
- Hot days now (above 99°F)
- 7 days/yr
- Hot days in 30 yrs
- 16 days/yr
Wind risk 4/10 · Minor
- Chance of severe wind over 30 yrs
- 15.0%
Air-quality risk 3/10 · Minor
- Unhealthy air days now
- 3 days/yr
- Unhealthy air days in 30 yrs
- 5 days/yr
Risk factors via First Street. Map © Google.
Why this score? — see what drove the D grade
The composite is a weighted blend of 9 inputs, each scored 0–100. Each bar is that input's sub-score; the figure is the points it added to the 100-point composite (weight × sub-score).
- Cash flow +13.0/30.0
- ARV discount +9.7/15.0
- Livability +4.4/5.0
- DSCR +3.9/10.0
- Rent growth +3.7/5.0
- 1% rule +3.5/10.0
- Schools +3.5/10.0
- Condition / age +2.5/5.0
- Appreciation +0.0/10.0
$239,800
🖨 Deal sheet 📄 Offer letter ✓ Due diligence
Listing remarks MLS
OWNERS RELOCATING! This lovingly maintained home can be available quickly. It features 3 bedrooms, full bath plus extra toilet on 1st floor, covered front porch and covered rear patio area with a fully fenced yard. Spacious living room/dining room combo, modern kitchen, 1st floor laundry, newer windows and CENTRAL A/C. Basement partially finished for play area or recreation. Full unfinished 3rd floor storage attic. Property will be sold with a clear Wilson CO. Wired surveillance system stays. Make appointment today! * UGI is currently installing new gas lines on the block so for next week or so please note Victor St. may be closed off at entrance to street. .. we are told they should be completed soon and apologize for any temporary inconvenience this causes.
Key facts
- Wood flooring
- Finished room
- Attic storage
Tags
Property features AI
Finance
- Other: Above-grade finished area approximately 1,254 (finished living space); Below-grade finished area approximately 156 (partially finished basement); Lot dimensions approximately 20' x 100' (approx. 0.046 acres), public records
Exterior
- Parking: On-street parking
- Utilities: 100 amp electric service with circuit breakers; Public water; Public sewer
- Home design: 2-story house; Aluminum siding and brick exterior; Asphalt/fiberglass roof
- Construction: Built with aluminum siding and brick; Asphalt/fiberglass roof
- Exterior features: Covered patio; Porch; Yard fenced
Interior
- Kitchen: Dishwasher; Electric oven; Electric range
- Bedrooms: Total rooms: 7; Basement present (see Basement details)
- Flooring: Carpet; Engineered hardwood; Vinyl
- Bathrooms: 1 full bathroom
- Heating & cooling: Forced air heating (oil); Central air conditioning; Ceiling fans
- Interior features: Dining area; Separate/formal dining room
- Laundry & utility: Washer hookup; Dryer hookup; Electric water heater
Neighborhood map
What this means for you Summary
Snapshot
- This is a 3-bed/1.0-bath townhouse listed at $240k.
Deal economics
- At list price, monthly cash flow is $-11 ($-136/yr) — negative.
- To cash-flow at today's rent, offer at most $238k (0.8% below list).
- To meet the 1% rule (rent ≥ 1% of price), the offer needs to be $205k (14.6% below list).
- Recommended offer: $205k (14.6% below list) — sets the bar for 1% rule.
- Cap rate 6.2% vs local median 5.1% in Wilson — meaningfully above typical; check what's discounted (condition, days-on-market, listing class) to confirm the premium yield is real.
Location & tenants
- Location reads 88/100 on livability (#32 in PA, #171 nationally) — a professional / high-income tenant draw. Strengths: schools A+, amenities A+, cost of living A+; Watch: commute F.
- Wilson Area SD (suburban): math 28% / reading 52% proficiency, ranked #338 of 539 in PA (top 63%) — families likely to look elsewhere, expect single-tenant / working-renter base with shorter leases.
- Market conditions: Rents rising fast (+4.9%/yr); 185 active listings in the ZIP; 35 comparable units currently listed for rent nearby; rentals at typical pace (median 15d on market — plan ~3-4 weeks tenant-placement turnaround); solid renter incomes; 567 units permitted in Northampton County in 2024 (151 in 5+ unit buildings).
- This rent runs 32% of the median local income ($78k/yr) — at the standard rent-burdened threshold; future hikes will face affordability resistance.
Forward outlook
- Local home prices are declining (-3.0%/yr); year-one equity from $2k of loan paydown is wiped out by about $7k of value loss. Plan a longer hold.
Negotiation context
- Only 4 days on market — expect competitive offers; lowballing is unlikely to land.
- 2 sale attempts since 8y ago with the ask held roughly flat each time — persistent listings suggest the price (not the market) is what's stuck; bring a comps-based counter.
- Current owner paid $125k; list at $240k implies a 92% gain — meaningful room to come down on a strong offer.
Risks & watch-outs
- Watch-outs: built in 1915 — expect roof / HVAC / electrical / plumbing capex.
- Climate carrying-cost: extreme-heat days projected 7→16/yr by 2055 (HVAC capex compounding) — expect insurance premiums to compound above CPI over the hold.
Questions for the listing agent
- What do current leases actually rent for vs. the listed asking? Can we see a recent rent roll and the last 12 months of T-12 income?
- Built in 1915 — when were the roof, HVAC, electrical panel, plumbing, and water heater last replaced?
- Is there a deadline driving the sale (1031 exchange, divorce, estate, relocation)? That informs how much negotiation room exists.
- Schools are A-rated — typically a magnet for longer-tenancy family renters. What's the average tenant stay here, and is there a school-zone premium baked into asking?
- The area grade is low — what's the realistic commute time and amenity access for the typical tenant pool here? Any planned neighborhood developments (good or bad) we should know about?
- What's the average days-on-market for RENTAL listings here right now (not sales)? A rising rental-DOM trend means longer vacancies and softer asking-rent achievability than the comps imply.
- What's the recent tenant-quality profile in this submarket — average credit score on applications, eviction rate, late-payment / NSF rate, and stable-employment percentage? A property-management company in the area should have these aggregated.
- How much new for-sale + rental construction is in the pipeline within 1–3 miles? Heavy new supply typically softens prices + rents 12–24 months out; constrained supply supports both.
Investment metrics
- 1% rule
- 0.85% ✗
- Cap rate
- 6.24%
- Cash-on-cash
- -0.20%
- DSCR
- 0.99
- GRM
- 9.8
CMA / ARV
- ARV (on-the-fly)
- $252,054
- Comps found
- 12
Show comp detail 12 sales within ~0.75 mi
| Address | Dist | Beds/Ba | Sqft | Sold | Price | $/sf | Match |
|---|---|---|---|---|---|---|---|
| 2420 Sycamore St | 0.15mi | 3/1.0 | 1,144 (-9%) | 2mo | $230,000 | $201 | 77 |
| 2406 Birch St | 0.27mi | 3/1.5 | 1,265 (+1%) | 9mo | $220,900 | $175 | 76 |
| 2474 Forest St | 0.33mi | 3/1.0 | 1,280 (+2%) | 6mo | $245,000 | $191 | 76 |
| 2200 Birch St | 0.29mi | 3/2.0 | 1,320 (+5%) | 4mo | $290,000 | $220 | 71 |
| 2716 Division St | 0.61mi | 3/1.0 | 1,250 (-0%) | 1mo | $320,000 | $256 | 71 |
| 2425 Sycamore St | 0.17mi | 3/1.0 | 1,376 (+10%) | 9mo | $240,000 | $174 | 68 |
| 2236 2nd St | 0.28mi | 3/1.0 | 1,158 (-8%) | 10mo | $207,000 | $179 | 66 |
| 900 Ridge St | 0.50mi | 3/1.5 | 1,161 (-7%) | 9mo | $233,000 | $201 | 55 |
| 2028 Washington Blvd | 0.56mi | 3/1.5 | 1,120 (-11%) | 0mo | $270,000 | $241 | 54 |
| 921 Ridge St | 0.52mi | 3/1.5 | 1,123 (-10%) | 9mo | $225,000 | $200 | 49 |
| 6 Gold Rose Ln | 0.72mi | 3/1.5 | 1,380 (+10%) | 7mo | $330,000 | $239 | 42 |
| 1914 Fairview Ave | 0.72mi | 3/1.0 | 1,440 (+15%) | 4mo | $275,000 | $191 | 38 |
Match score weights: distance 35% · size 25% · config 20% · recency 20%. Top-matched comps best support the ARV.
Projected returns pro-forma
-3.0% appreciation · 4.94% rent growth · sell at horizon
- IRR
- -14.5%
- Equity multiple
- 0.47×
- Total profit
- $-35,491
- Equity at exit
- $35,755
- IRR
- -2.9%
- Equity multiple
- 0.79×
- Total profit
- $-14,378
- Equity at exit
- $20,734
Cash invested: $67,144 (down + closing). Projections, not guarantees.
Landlord ↔ Tenant lean methodology
- Overall (STATE)
- 62 Landlord-Friendly
- State Pennsylvania
- 62 Landlord-Friendly · EVEN
- County
- — inherits STATE
- City
- — inherits STATE
ZIP-level market 18042
- Rents YoY
- 4.9%
- Active inventory
- 185
- Price-to-rent
- 9.8×
Monthly cashflow live
- Estimated rent
- $2,048 high interval (Pro) →
- Mortgage (P&I)
- −$1,258
- Tax from tax record
- −$272 /mo · $3,266/yr
- Insurance
- −$100
- HOA
- −$0
- Vacancy / Maint / Mgmt
- −$430
- Net cashflow
- $-11
Break-even live
UW: 25.0% down · 7.5% · 30yr · 1.5% tax · 5.0% vac · 8.0% maint · 8.0% mgmt
Financing live
Cash to close
- Down payment
- $59,950
- Closing costs
- $7,194
- Reserves months
- —
- Total cash needed
- —
Loan-product check · same deal, 3 products live
Conventional
25% down · 7.5% · 30yr
- Down + closing
- —
- Monthly P&I
- —
- Monthly cashflow
- —
- DSCR
- —
- Eligible?
- —
Personal DTI + credit; lowest rate.
DSCR
20% down · 8.5% · 30yr
- Down + closing
- —
- Monthly P&I
- —
- Monthly cashflow
- —
- DSCR
- —
- Eligible?
- —
No personal income docs; deal must DSCR.
Hard money
10% down · 12.0% · 12mo
- Down + closing
- —
- Monthly P&I
- —
- Monthly cashflow
- —
- DSCR
- —
- Eligible?
- —
Short-term bridge; refi at stabilization.
Rent comps 35 comps
| Address | Beds | Baths | Sqft | Rent | $/sqft | DOM | Units | Dist |
|---|---|---|---|---|---|---|---|---|
| 2306 3rd St Easton, PA | 3.0 | 1.0 | 1240 | $2,000 | $1.61 | 14d | 1 | 0.16mi |
| 2474 Lincoln Ave Easton, PA | 3.0 | 1.0 | 1500 | $1,800 | $1.20 | 43d | 1 | 0.24mi |
| 2246 2nd St Easton, PA | 3.0 | 1.5 | 1449 | $2,150 | $1.48 | 2d | 1 | 0.25mi |
| 2434 Birch St Easton, PA | 3.0 | 1.0 | 1294 | $1,900 | $1.47 | 2d | 1 | 0.29mi |
| 2406 Birch St Easton, PA | 3.0 | 1.5 | 1265 | $2,300 | $1.82 | 14d | 1 | 0.30mi |
| 2406 Birch St Easton, PA | 3.0 | 1.5 | 1265 | $2,300 | $1.82 | 2d | 1 | 0.30mi |
| 2248 Birch St Easton, PA | 3.0 | 1.5 | 1425 | $1,850 | $1.30 | 43d | 1 | 0.31mi |
| 2250 Butler St Unit 06 Easton, PA | 2.0 | 1.0 | 1000 | $1,700 | $1.70 | 19d | 1 | 0.45mi |
| 312 Lehigh Dr Easton, PA | 3.0 | 1.5 | 1664 | $3,250 | $1.95 | 2d | 1 | 0.47mi |
| 817 Ridge St Easton, PA | 2.0 | 1.0 | 1014 | $1,900 | $1.87 | 43d | 1 | 0.54mi |
| 100 Woodmont Cir Easton, PA | 1.0–2.0 | 1.0–2.0 | 978 | $2,450 | $2.51 | 2d | 11 | 0.63mi |
| 10 White Rose Ln Easton, PA | 3.0 | 2.5 | 1867 | $2,900 | $1.55 | 2d | 1 | 0.71mi |
| 1619 Butler St Easton, PA | 3.0 | 1.0 | 965 | $2,050 | $2.12 | 23d | 1 | 0.75mi |
| 2118 Northampton St Unit 1 Easton, PA | 2.0 | 1.0 | 1240 | $1,595 | $1.29 | 23d | 1 | 0.82mi |
| 2001 Ferry St Easton, PA | 3.0 | 1.0 | 1440 | $2,200 | $1.53 | 43d | 1 | 0.82mi |
| 2125 Northampton St Easton, PA | 3.0 | 1.0 | 1440 | $2,000 | $1.39 | 14d | 1 | 0.85mi |
| 613 Oakwood St Easton, PA | 2.0 | 1.0 | 1025 | $1,898 | $1.85 | 2d | 1 | 0.85mi |
| 1616 Ferry St Unit 2 Easton, PA | 3.0 | 1.0 | 1316 | $1,700 | $1.29 | 2d | 1 | 0.90mi |
| 2960 William Penn Hwy Easton, PA | 3.0 | 1.5 | 1134 | $2,300 | $2.03 | 19d | 1 | 0.92mi |
| 3241 Freemansburg Ave Easton, PA | 3.0 | 2.5 | 1778 | $2,850 | $1.60 | 23d | 1 | 1.00mi |
| 1237 Butler St Unit 2 Easton, PA | 3.0 | 1.0 | 900 | $1,700 | $1.89 | 2d | 1 | 1.03mi |
| 11 Early St Easton, PA | 2.0 | 1.0 | 998 | $1,625 | $1.63 | 43d | 1 | 1.05mi |
| 1205 Butler St Easton, PA | 2.0 | 1.0 | 900 | $1,700 | $1.89 | 14d | 1 | 1.07mi |
| 1108 Butler St Unit 7 Easton, PA | 3.0 | 1.0 | 1146 | $1,575 | $1.37 | 43d | 1 | 1.15mi |
| 94 Jonathan Dr Easton, PA | 2.0 | 1.0 | 1045 | $2,200 | $2.11 | 2d | 1 | 1.17mi |
| 600 Canal St Easton, PA | 2.0 | 1.0 | 900 | $1,599 | $1.78 | 23d | 2 | 1.21mi |
| 600 Canal St Easton, PA | 2.0 | 1.0 | 900 | $1,599 | $1.78 | 2d | 2 | 1.21mi |
| 203 S 11th St Unit 1st floor Easton, PA | 2.0 | 1.0 | 900 | $1,450 | $1.61 | 43d | 1 | 1.22mi |
| 1051 Washington St Easton, PA | 3.0 | 1.0 | 900 | $1,550 | $1.72 | 14d | 1 | 1.22mi |
| 648 Line St #1 Easton, PA | 2.0 | 1.0 | 1200 | $1,595 | $1.33 | 2d | 1 | 1.23mi |
| 122 N 13th St Easton, PA | 4.0 | 3.0 | 1736 | $2,300 | $1.32 | 2d | 1 | 1.27mi |
| 457 W Lincoln St Easton, PA | 1.0–2.0 | 1.0–2.0 | 837 | $1,932 | $2.31 | 2d | 6 | 1.36mi |
| 1247 Jackson St Easton, PA | 2.0 | 2.0 | 1200 | $1,700 | $1.42 | 2d | 1 | 1.44mi |
| 922 Northampton St Unit 1 Easton, PA | 2.0 | 1.0 | 900 | $1,395 | $1.55 | 43d | 1 | 1.44mi |
| 812 Ferry St Easton, PA | 2.0 | 1.0 | 1000 | $1,640 | $1.64 | 23d | 1 | 1.47mi |
Listing history 5 events
-
2026-06-18days on market $239,800 Active 4 DOM
-
2026-06-17days on market $239,800 Active 3 DOM
-
2026-06-16days on market $239,800 Active 2 DOM
-
2026-06-15remarks 272-char remark
-
2026-06-15$239,800 Active 1 DOM
ⓘ Source: listings_history table (triggers on properties + properties_extension) + one-shot
backfill from property_details.listing_events for pre-trigger history.
Tax reassessment forecast PA · Partial reset (capped growth)
- Current annual tax
- $3,266 · $272/mo
- Projected year-2 tax
- $3,528 · $294/mo
- Expected delta
- +$261/yr (+$22/mo · 8.0%)
ⓘ Screening estimate from a state-policy table — verify with the county assessor before closing.
Climate risk First Street
- Flood 1/10 Low FEMA zone X (unshaded) · 0% chance over 30 yrs
- Wildfire 3/10 Moderate
- Heat 5/10 Major 7 d/yr ≥99°F today · 16 d/yr by 30 yrs out
- Wind 4/10 Moderate 15% chance of damaging wind over 30 yrs
- Air quality 3/10 Moderate 3 unhealthy d/yr today · 5 by 30 yrs out
Nearby sold comps map
Loading sold comps map…
Walkable amenities ~0.75 mi
Loading nearby amenities…
Taxation est. · year 1
- Rental income
- $24,582
- − Mortgage interest
- −$13,433
- − Property taxes
- −$3,266
- − Insurance
- −$1,199
- − Repairs & maintenance
- −$1,967
- − Management
- −$1,967
- − Depreciation
- −$6,976
- Taxable loss
- −$4,225
- Est. tax savings @ 24.0%
- +$1,014
- After-tax cash flow
- $878/yr
For passive investors: Depreciation is non-cash, so a rental often shows a tax loss while cash-flowing — sheltering income. Rental losses are passive: they offset passive income freely, and up to $25,000/yr can offset ordinary (W-2) income if you actively participate and your MAGI is under $100k (phasing out to $0 by $150k); unused losses carry forward. On sale, claimed depreciation is recaptured at up to 25%, and gains may owe capital-gains tax (a 1031 exchange can defer both). Figures are a year-1 estimate at your 24.0% rate — not tax advice; consult a CPA.
Schools (NCES district)
- District
- Wilson Area SD
- NCES district ID
- 4226550
- Math proficiency
- 28% ▼ -29.00%
- Reading proficiency
- 52% ▼ -21.00%
- Median HH income
- $58,534
- Composite
- 35.22/100
- National rank
- #4984
- State rank
- #338 of 539 in PA
Livability — Wilson
- Score
- 88/100
- State rank
- #32
- US rank
- #171
Category grades
Schools grade is shown separately in the Schools card above.
Census & demographics
- Census place
- Wilson, PA
- County
- Northampton County · 236,814 people
- Metro
- Allentown-Bethlehem-Easton, PA-NJ
- Population (ZIP)
- 45,532
- Household income
- $77,556
- Rent vs Own
- Severe rent burden
- 1590.0
Population outlook (Northampton County) Hauer SSP2
- Today (2025)
- 312,227 people
- By 2030
- 314,769 · +0.8%
- By 2040
- 316,914 · +1.5%
- By 2050
- 318,037 · +1.9%
- By 2075
- 334,003 · +7.0%
- By 2100
- 344,696 · +10.4%
Race, ethnicity, and origin ACS 2023
- Neighborhood character
- Diverse neighborhood (Simpson 0.61)
- Race & ethnicity
- White 57% Hispanic / Latino 21% Black 12% Two or more races 12% Asian 3%
- Hispanic origin (detail)
- Mexican 3% Puerto Rican 7% Dominican 3%
- Common ancestry
- Romanian 3% Polish 2% Iranian 1%
- Foreign-born
- 13% · Canada, China, Jamaica
- Languages at home
- 80% English-only · Spanish 15% Other Indo-European 1% Arabic 1%
Political lean MEDSL · Northampton
- 2024 margin
- Toss-up / Even · D 48.6% · R 50.4%
- 2008→2024 swing
- -14.1pp toward R · 2008: 12.3pp · 2024: -1.8pp
- All cycles
- 2024: R+1.8 2020: D+0.7 2016: R+3.8 2012: D+4.6 2008: D+12.3
Not yet ingested
- Civics
- —
Market trends
- HPI YoY
- ▼ -460.52%
- Current HPI
- 254.8776
- Rent YoY
- ▲ 4.94%
- Metro
- Allentown-Bethlehem-Easton, PA-NJ
- State GDP YoY
- ▲ 1.68%
- F500 in state
- 34
Industry mix (Fortune 500 HQ in PA)
| Industry | F500 HQs | Revenue |
|---|---|---|
| Healthcare | 2 | $309B |
|
||
| Insurance | 2 | $27B |
|
||
| Telecommunications / Media | 1 | $124B |
|
||
| Industrial Distribution | 1 | $22B |
|
||
| Financial Services | 1 | $20B |
|
||
| Chemicals / Materials | 1 | $18B |
|
||
Price history
+293.1% since first listed6 events — show timeline
- 2026-06-14 Listed $239,800 GLVRMLS
- 2018-10-24 Sold (Public Records) $125,000 Public Records
- 2018-10-18 Sold (MLS) $125,000 GLVRMLS
- 2018-08-23 Pending — GLVRMLS
- 2018-08-16 Listed $125,000 GLVRMLS
- 1995-11-01 Sold (Public Records) $61,000 Public Records
Property tax history
+2.2%/yrLatest (2026): $3,266 · +3.2% YoY. Source: county tax records.
Cash-flow waterfall
monthlySold comps — $/sqft
last 12 mo · ≤1 miLoading sold comps…