 Multi-family
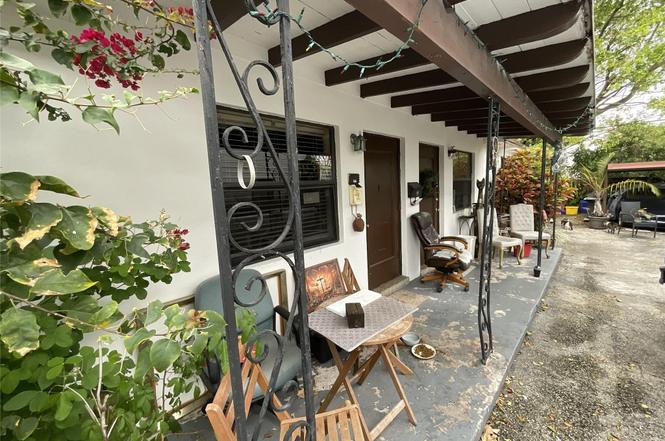
325 Conniston Rd · West Palm Beach, FL
Flood risk 4/10 · Minor
- FEMA flood zone
- X (unshaded)
- Chance of flooding over 30 yrs
- 0.13%
- Est. flood insurance / yr
- $507 – $1,088
Fire risk 1/10 · Minimal
- Est. fire insurance / yr
- $947 – $1,759
Heat risk 10/10 · Severe
- Hot days now (above 105°F)
- 7 days/yr
- Hot days in 30 yrs
- 27 days/yr
Wind risk 10/10 · Severe
- Chance of severe wind over 30 yrs
- 99.0%
Air-quality risk 2/10 · Minimal
- Unhealthy air days now
- 1 days/yr
- Unhealthy air days in 30 yrs
- 1 days/yr
Risk factors via First Street. Map © Google.
Why this score? — see what drove the C+ grade
The composite is a weighted blend of 9 inputs, each scored 0–100. Each bar is that input's sub-score; the figure is the points it added to the 100-point composite (weight × sub-score).
- Cash flow +25.2/30.0
- DSCR +8.3/10.0
- ARV discount +7.5/15.0
- 1% rule +6.7/10.0
- Schools +4.3/10.0
- Livability +4.1/5.0
- Rent growth +3.4/5.0
- Condition / age +2.5/5.0
- Appreciation +0.0/10.0
$495,000
🖨 Deal sheet (PDF) 📄 Offer letter ✓ Due diligence
Multi-family units
County records classify this as Multi-Family (2-4 Unit). Listing-text estimate: 1 unit. estimate disagrees with records
Listing remarks
Estate Sale | 325 Conniston Rd is a 2plex 2 (2/1) in the Central Park neighborhood of West Palm Beach 2 block north of Soso. While the property benefits from Central Park’s more approachable basis and strong local rental demand, it simultaneously trades off SoSo’s brand equity, buyer psychology, and redevelopment momentum. In practical terms, this means tenant demand, resale interest, and valuation benchmarks are often underwritten against SoSo and near-water South End comparables, not just interior Central Park assets The tenants each pay $1800 and reside there under a month-to-month agreement. Please drive by subject property and submit an offer before requesting an interior s
Key facts
- Built 1956
Neighborhood map
What this means for you Summary
Snapshot
- This is a ?-bed/2.0-bath multifamily listed at $495k.
Deal economics
- At list price, monthly cash flow is $1k ($13k/yr) — positive.
- The deal already cash-flows at list — no discount required.
- Meets the 1% rule at list price ($6k rent vs $495k).
- Cap rate 9.0% vs local median 3.8% in West Palm Beach — top-decile yield for the area; either an underpriced asset or a hidden risk that comps aren't pricing in. Stress-test before assuming the spread holds.
Location & tenants
- Location reads 82/100 on livability (#75 in FL, #1,255 nationally) — a professional / high-income tenant draw. Strengths: commute A+, housing A+, health & safety A+; Watch: employment C-, crime F.
- Palm Beach (suburban): math 46% / reading 53% proficiency, ranked #34 of 73 in FL (top 47%) — families likely to look elsewhere, expect single-tenant / working-renter base with shorter leases.
- Market conditions: Rents rising (+3.4%/yr); 212 active listings in the ZIP; 40 comparable units currently listed for rent nearby; rentals at typical pace (median 23d on market — plan ~3-4 weeks tenant-placement turnaround); solid renter incomes; 3,974 units permitted in Palm Beach County in 2024 (1,012 in 5+ unit buildings).
- At $5,814/mo this rent would consume 80% of the median local household income ($87k/yr) (locally 1055% of renters already pay >50% of income on rent) — very limited rent-growth headroom before tenants either downsize or default.
Forward outlook
- Local home prices are declining (-3.0%/yr); year-one equity from $3k of loan paydown is wiped out by about $15k of value loss. Plan a longer hold.
- Palm Beach County population projected at +30% by 2050 — long-run rental-demand tailwind backs the buy-and-hold thesis.
Negotiation context
- Only 0 days on market — expect competitive offers; lowballing is unlikely to land.
Risks & watch-outs
- Watch-outs: built in 1956 — expect roof / HVAC / electrical / plumbing capex.
- Climate carrying-cost: severe wind risk, 99% chance of damaging wind over 30y; extreme-heat days projected 7→27/yr by 2055 (HVAC capex compounding) — expect insurance premiums to compound above CPI over the hold.
Questions for the listing agent
- Built in 1956 — when were the roof, HVAC, electrical panel, plumbing, and water heater last replaced?
- Is there a deadline driving the sale (1031 exchange, divorce, estate, relocation)? That informs how much negotiation room exists.
- Crime grade is F in this area — have there been break-ins, vandalism, or insurance claims at this property in the last 3 years? What carrier currently insures it and at what premium?
- What's the average days-on-market for RENTAL listings here right now (not sales)? A rising rental-DOM trend means longer vacancies and softer asking-rent achievability than the comps imply.
- What's the recent tenant-quality profile in this submarket — average credit score on applications, eviction rate, late-payment / NSF rate, and stable-employment percentage? A property-management company in the area should have these aggregated.
- How much new apartment / multifamily construction is in the pipeline within 1–3 miles? Heavy new supply (>2% of stock underway) typically softens rents 12–24 months out; light construction supports rent growth.
Investment metrics
- 1% rule
- 1.17% ✓
- Cap rate
- 8.97%
- Cash-on-cash
- 9.56%
- DSCR
- 1.43
- GRM
- 7.1
CMA / ARV
No comps found within radius.
Projected returns pro-forma
-3.0% appreciation · 3.44% rent growth · sell at horizon
- IRR
- -1.4%
- Equity multiple
- 0.95×
- Total profit
- $-7,193
- Equity at exit
- $73,806
- IRR
- 8.8%
- Equity multiple
- 1.69×
- Total profit
- $95,495
- Equity at exit
- $42,799
Cash invested: $138,600 (down + closing). Projections, not guarantees.
Landlord ↔ Tenant lean methodology
- Overall (STATE)
- 87 Strongly Landlord-Friendly
- State Florida
- 87 Strongly Landlord-Friendly · R+3
- County
- — inherits STATE
- City
- — inherits STATE
ZIP-level market 33405
- Rents YoY
- 3.4%
- Active inventory
- 212
- Price-to-rent
- 14.2×
Monthly cashflow live
- Estimated rent
- $5,814 medium interval (Pro) →
- Mortgage (P&I)
- −$2,596
- Tax from tax record
- −$687 /mo · $8,246/yr
- Insurance
- −$206
- HOA
- −$0
- Vacancy / Maint / Mgmt
- −$1,221
- Net cashflow
- $1,104
Break-even live
Sensitivity live
| Price | -10% $1,384 | -5% $1,244 | +0% $1,104 | +5% $964 | +10% $824 |
|---|---|---|---|---|---|
| Rent | -10% $645 | -5% $874 | +0% $1,104 | +5% $1,333 | +10% $1,563 |
| Rate | -1.0pp $1,353 | -0.5pp $1,230 | base $1,104 | +0.5pp $976 | +1.0pp $845 |
2-unit breakdown (identical units grouped — click to expand)
| Units | Beds | Baths | Est. rent |
|---|---|---|---|
| 2× units | 2 | 1 | $5,814 |
| #1 | 2 | 1 | $2,907 |
| #2 | 2 | 1 | $2,907 |
| Total (2 units) | $5,814 | ||
UW: 25.0% down · 7.5% · 30yr · 1.5% tax · 5.0% vac · 8.0% maint · 8.0% mgmt
Financing live
Cash to close
- Down payment
- $123,750
- Closing costs
- $14,850
- Reserves months
- —
- Total cash needed
- —
Loan-product check · same deal, 3 products live
Conventional
25% down · 7.5% · 30yr
- Down + closing
- —
- Monthly P&I
- —
- Monthly cashflow
- —
- DSCR
- —
- Eligible?
- —
Personal DTI + credit; lowest rate.
DSCR
20% down · 8.5% · 30yr
- Down + closing
- —
- Monthly P&I
- —
- Monthly cashflow
- —
- DSCR
- —
- Eligible?
- —
No personal income docs; deal must DSCR.
Hard money
10% down · 12.0% · 12mo
- Down + closing
- —
- Monthly P&I
- —
- Monthly cashflow
- —
- DSCR
- —
- Eligible?
- —
Short-term bridge; refi at stabilization.
Rent comps 40 comps
| Address | Beds | Baths | Sqft | Rent | $/sqft | DOM | Units | Dist |
|---|---|---|---|---|---|---|---|---|
| 340 Walton Blvd Unit Single Family House West Palm Beach, FL | 3.0 | 2.0 | 1700 | $4,000 | $2.35 | 0d | 1 | 0.01mi |
| 340 Walton Blvd West Palm Beach, FL | 3.0 | 2.5 | 1854 | $4,000 | $2.16 | 8d | 1 | 0.01mi |
| 3800 Washington Rd West Palm Beach, FL | 2.0–3.0 | 2.0 | 1318 | $3,500 | $2.66 | 3d | 6 | 0.29mi |
| 3800 Washington Rd West Palm Beach, FL | 2.0–3.0 | 2.0 | 1318 | $3,500 | $2.66 | 8d | 5 | 0.29mi |
| 3800 Washington Rd West Palm Beach, FL | 2.0–3.0 | 2.0 | 1318 | $3,975 | $3.02 | 21d | 4 | 0.29mi |
| 3901 S Flagler Dr West Palm Beach, FL | 2.0–5.0 | 2.0–5.0 | 2266 | $3,500 | $1.54 | 23d | 6 | 0.30mi |
| 3901 S Flagler Dr West Palm Beach, FL | 2.0–5.0 | 2.0–5.0 | 2266 | $3,000 | $1.32 | 4d | 6 | 0.30mi |
| 236 Greymon Dr West Palm Beach, FL | 3.0 | 2.0 | 1813 | $8,500 | $4.69 | 25d | 1 | 0.31mi |
| 3701 S Flagler Dr Unit B303 West Palm Beach, FL | 2.0 | 2.0 | 1290 | $3,850 | $2.98 | 5d | 1 | 0.31mi |
| 3210 Vincent Rd West Palm Beach, FL | 3.0 | 2.0 | 1551 | $8,500 | $5.48 | 25d | 1 | 0.44mi |
| 300 Buckingham Rd West Palm Beach, FL | 3.0 | 2.0 | 1600 | $15,000 | $9.38 | 25d | 1 | 0.49mi |
| 719 Briggs St West Palm Beach, FL | 3.0 | 2.0 | 1328 | $3,500 | $2.64 | 21d | 1 | 0.50mi |
| 521 Hampton Rd West Palm Beach, FL | 2.0 | 1.0 | 1188 | $4,000 | $3.37 | 25d | 1 | 0.52mi |
| 353 E Lakewood Rd West Palm Beach, FL | 3.0 | 2.0 | 1440 | $5,650 | $3.92 | 25d | 1 | 0.54mi |
| 3111 S Dixie Hwy West Palm Beach, FL | 3.0 | 1.0–2.0 | 1024 | $4,199 | $4.10 | 0d | 15 | 0.59mi |
| 733 Green St West Palm Beach, FL | 2.0 | 1.0 | 1116 | $3,400 | $3.05 | 4d | 1 | 0.71mi |
| 832 Green St #1 West Palm Beach, FL | 3.0 | 2.0 | 1700 | $4,550 | $2.68 | 12d | 1 | 0.78mi |
| 5008 Parker Ave West Palm Beach, FL | 3.0 | 2.0 | 1318 | $4,000 | $3.03 | 25d | 1 | 0.81mi |
| 240 Almeria Rd West Palm Beach, FL | 3.0 | 3.0 | 1092 | $9,000 | $8.24 | 5d | 1 | 0.82mi |
| 1041 W Lakewood Rd West Palm Beach, FL | 3.0 | 2.5 | 1857 | $4,300 | $2.32 | 25d | 1 | 0.93mi |
| 727 Bunker Rd West Palm Beach, FL | 3.0 | 1.0 | 875 | $3,200 | $3.66 | 21d | 1 | 0.94mi |
| 727 Fernwood Dr West Palm Beach, FL | 3.0 | 3.0 | 1667 | $7,200 | $4.32 | 25d | 1 | 0.99mi |
| 2741 Parker Ave West Palm Beach, FL | 2.0 | 2.0 | 1682 | $3,750 | $2.23 | 25d | 1 | 1.01mi |
| 904 Ortega Rd West Palm Beach, FL | 3.0 | 1.0 | 910 | $3,500 | $3.85 | 6d | 1 | 1.03mi |
| 605 Sunset Rd West Palm Beach, FL | 3.0 | 2.0 | 1434 | $4,000 | $2.79 | 25d | 1 | 1.05mi |
| 360 Palmetto St West Palm Beach, FL | 2.0 | 2.0 | 1318 | $3,600 | $2.73 | 4d | 1 | 1.12mi |
| 616 Upland Rd West Palm Beach, FL | 3.0 | 2.0 | 1456 | $4,500 | $3.09 | 25d | 1 | 1.13mi |
| 616 Upland Rd West Palm Beach, FL | 3.0 | 2.0 | 1456 | $4,500 | $3.09 | 21d | 1 | 1.13mi |
| 110 Wilson Rd West Palm Beach, FL | 3.0 | 1.0 | 1433 | $8,000 | $5.58 | 25d | 1 | 1.15mi |
| 515 Ardmore Rd West Palm Beach, FL | 2.0 | 2.5 | 1741 | $6,895 | $3.96 | 23d | 1 | 1.18mi |
| 945 Sunset Rd Unit 1 West Palm Beach, FL | 3.0 | 3.0 | 1505 | $5,300 | $3.52 | 25d | 1 | 1.24mi |
| 833 Ardmore Rd West Palm Beach, FL | 3.0 | 2.5 | 1132 | $4,500 | $3.98 | 16d | 1 | 1.26mi |
| 833 Ardmore Rd West Palm Beach, FL | 3.0 | 2.5 | 1132 | $4,500 | $3.98 | 18d | 1 | 1.26mi |
| 255 Cortez Rd West Palm Beach, FL | 3.0 | 2.0 | 1674 | $22,500 | $13.44 | 25d | 1 | 1.33mi |
| 1801 S Flagler Dr #11 West Palm Beach, FL | 1.0 | 1.5 | 1075 | $6,500 | $6.05 | 25d | 1 | 1.42mi |
| 1801 S Flagler Dr #1105 West Palm Beach, FL | 2.0 | 2.0 | 1348 | $7,000 | $5.19 | 25d | 1 | 1.42mi |
| 1801 S Flagler Dr #1104 West Palm Beach, FL | 2.0 | 2.0 | 1086 | $3,750 | $3.45 | 0d | 1 | 1.42mi |
| 2109 Dock St West Palm Beach, FL | 3.0 | 2.0 | 1593 | $3,500 | $2.20 | 4d | 1 | 1.45mi |
| 1911 Parker Ave West Palm Beach, FL | 2.0 | 2.0 | 1135 | $14,000 | $12.33 | 25d | 1 | 1.45mi |
| 1713 Florida Ave Unit A2 West Palm Beach, FL | 2.0 | 1.0 | 888 | $3,500 | $3.94 | 25d | 1 | 1.47mi |
Listing history 2 events
-
2026-02-10historical
-
2026-01-27$495,000
ⓘ Source: listings_history table (triggers on properties + properties_extension) + one-shot
backfill from property_details.listing_events for pre-trigger history.
Tax reassessment forecast FL · Resets to sale price
- Current annual tax
- $8,246 · $687/mo
- Projected year-2 tax
- $8,246 · $687/mo
- Expected delta
- $0/yr ($0/mo · 0.0%)
ⓘ Screening estimate from a state-policy table — verify with the county assessor before closing.
Climate risk First Street
- Flood 4/10 Moderate FEMA zone X (unshaded) · 13% chance over 30 yrs
- Wildfire 1/10 Low
- Heat 10/10 Extreme 7 d/yr ≥105°F today · 27 d/yr by 30 yrs out
- Wind 10/10 Extreme 99% chance of damaging wind over 30 yrs
- Air quality 2/10 Low 1 unhealthy d/yr today · 1 by 30 yrs out
Nearby sold comps map
Loading sold comps map…
Walkable amenities ~0.75 mi
Loading nearby amenities…
Taxation est. · year 1
- Rental income
- $69,768
- − Mortgage interest
- −$27,728
- − Property taxes
- −$8,246
- − Insurance
- −$2,475
- − Repairs & maintenance
- −$5,581
- − Management
- −$5,581
- − Depreciation
- −$14,400
- Taxable income
- $5,757
- Est. tax owed @ 24.0%
- −$1,382
- After-tax cash flow
- $11,864/yr
For passive investors: Depreciation is non-cash, so a rental often shows a tax loss while cash-flowing — sheltering income. Rental losses are passive: they offset passive income freely, and up to $25,000/yr can offset ordinary (W-2) income if you actively participate and your MAGI is under $100k (phasing out to $0 by $150k); unused losses carry forward. On sale, claimed depreciation is recaptured at up to 25%, and gains may owe capital-gains tax (a 1031 exchange can defer both). Figures are a year-1 estimate at your 24.0% rate — not tax advice; consult a CPA.
Schools (NCES district)
- District
- Palm Beach
- NCES district ID
- 1201500
- Math proficiency
- 46% ▼ -16.00%
- Reading proficiency
- 53% ▼ -4.00%
- Median HH income
- $53,943
- Composite
- 42.72/100
- National rank
- #3160
- State rank
- #34 of 73 in FL
Livability — West Palm Beach
- Score
- 82/100
- State rank
- #75
- US rank
- #1255
Category grades
Schools grade is shown separately in the Schools card above.
Census & demographics
- Census place
- West Palm Beach, FL
- County
- Palm Beach County · 1,438,312 people
- City population
- 222,012
- Metro
- Miami-Fort Lauderdale-Pompano Beach, FL
- Population (ZIP)
- 19,780
- Household income
- $87,341
- Rent vs Own
- Severe rent burden
- 1055.0
Population outlook (Palm Beach County) Hauer SSP2
- Today (2025)
- 1,637,487 people
- By 2030
- 1,743,255 · +6.5%
- By 2040
- 1,948,712 · +19.0%
- By 2050
- 2,132,979 · +30.3%
- By 2075
- 2,530,027 · +54.5%
- By 2100
- 2,706,979 · +65.3%
Race, ethnicity, and origin ACS 2023
- Neighborhood character
- Majority Hispanic (51%)
- Race & ethnicity
- Hispanic / Latino 51% White 44% Two or more races 24% Black 3% Asian 1%
- Hispanic origin (detail)
- Mexican 7% Puerto Rican 5% Cuban 17% Dominican 2%
- Common ancestry
- Scotch-Irish 2% Slovak 2% Romanian 2%
- Foreign-born
- 37% · Canada, Guatemala, Jamaica
- Languages at home
- 50% English-only · Spanish 44% Other Indo-European 2% French/Haitian/Cajun 1%
Political lean MEDSL · Palm Beach
- 2024 margin
- Toss-up / Even · D 50.0% · R 49.2%
- 2008→2024 swing
- -22.1pp toward R · 2008: 22.9pp · 2024: 0.8pp
- All cycles
- 2024: D+0.8 2020: D+12.8 2016: D+15.3 2012: D+17.0 2008: D+22.9
Not yet ingested
- Civics
- —
Market trends
- HPI YoY
- ▼ -662.68%
- Current HPI
- 509.781
- Rent YoY
- ▲ 3.44%
- Metro
- Miami-Fort Lauderdale-Pompano Beach, FL
- State GDP YoY
- ▲ 3.28%
- F500 in state
- 36
Industry mix (Fortune 500 HQ in FL)
| Industry | F500 HQs | Revenue |
|---|---|---|
| Industrial Technology | 2 | $29B |
|
||
| Insurance | 2 | $17B |
|
||
| Retail | 1 | $60B |
|
||
| Technology Distribution | 1 | $58B |
|
||
| Homebuilding | 1 | $35B |
|
||
| Technology Manufacturing | 1 | $35B |
|
||
Price history
2 events — show timeline
- 2026-02-10 Listing Removed — Beaches MLS
- 2026-01-27 Listed $495,000 Beaches MLS
Property tax history
+7.0%/yrLatest (2025): $8,246 · +8.2% YoY. Source: county tax records.
Cash-flow waterfall
monthlySold comps — $/sqft
last 12 mo · ≤1 miLoading sold comps…